
The conflict in the Middle East is raising doubts about major carbon capture projects in the Gulf region. Carbon capture, utilization, and storage, known as CCUS, is a technology that prevents carbon dioxide (CO₂) from entering the atmosphere. It captures CO₂ from industrial sources and stores it underground or uses it in industrial processes. CCUS is seen as crucial for cutting hard‑to‑abate emissions from oil, gas, cement, and steel.
Gulf Ambitions Hit the Pause Button
Before the conflict, Gulf plans aimed for about 20 million tonnes per year (Mtpa) of CCUS capacity by 2030. This would have positioned the region as a key global hub. But Rystad Energy says this is now unlikely. The pipeline may shrink closer to the lower case of around 12 Mtpa by 2035 due to delays and repriced risk.
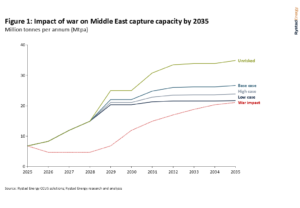
The Gulf’s CCUS buildout has strong logical drivers. The region has abundant oil and gas operations, and projects often connect to those facilities. However, when the upstream energy system is disrupted, CCUS plans can be delayed, pushed back, or re‑evaluated. This change affects investors’ view of CCUS as a near‑term investment in the region.
Rising Costs and Risk Reprice Carbon Capture
One major risk from prolonged conflict is rising energy costs. If energy prices jump — which often happens during regional conflict — the cost to capture and transport CO₂ also rises.
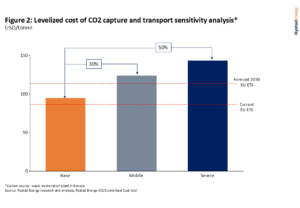
Rystad’s analysis shows that a 50 % rise in energy prices could increase capture and transport costs by about 30 %. That could push the cost of capturing a tonne of CO₂ well above the price range expected by 2030 in the European Union’s emissions trading system.
- The analysis suggests an increase from $95 per tonne to $124 per tonne using a ‘middle impact’ case, where energy prices rise about 50%.
Higher costs come from more expensive power, higher equipment prices, and slower supply chains. All these pressures hit CCUS projects hard because they are already more costly than conventional infrastructure.
Energy‑intensive capture systems need cheap, reliable supplies of power and materials. Rising inflation and disrupted supply chains could reduce availability and slow project build‑outs.
Longer project timelines may also raise the cost of capital. Investors typically demand higher returns when projects take longer or face greater uncertainty. In some cases, projects may only move forward if they are supported by governments or strategic partners, especially when the cost per tonne of CO₂ captured rises above key benchmarks.
Global CCUS Market Still Expanding
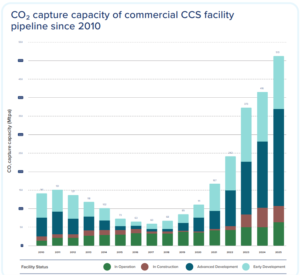
While the Gulf faces near‑term risks, the global CCUS market has continued to grow. A large number of projects are being developed worldwide.
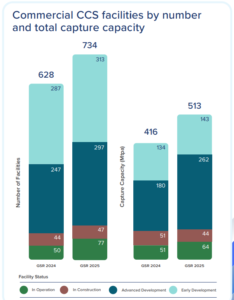
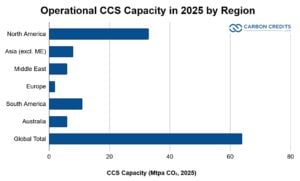
As of 2025, ~628 CCUS projects are tracked globally across all stages, with potential capture capacity exceeding 416 Mtpa if completed. Operational capacity reached 64 Mtpa from 77 facilities. The breakdown by number of facilities and total capture capacity is as follows:
The market is growing because many governments and companies have adopted emission‑reduction mandates. About 63 % of industries say these mandates accelerate CCUS deployment.
- Nearly 55 % of new CCUS projects are integrated with other low‑carbon technologies like hydrogen or renewable energy.
North America leads global capacity, accounting for about 46 % of total CCUS project capacity. Europe holds around 26 %, Asia‑Pacific about 21 %, and the Middle East & Africa roughly 7 % of the total project pipeline.
The oil and gas sector remains the largest user of CCUS, making up about 53 % of the global captured CO₂. Industrial decarbonization in sectors like cement and steel now represents around 25 % of the planned capacity worldwide.
Market research also shows that the CCS market size was estimated at about USD 3.9 billion in 2025, growing at a compound annual growth rate (CAGR) of 7 % to reach USD 6.7 billion by 2033. This growth reflects rising investments in decarbonization technologies across industrial and power sectors.
Long-Term Outlook: The Gigaton Challenge
CCUS projects are growing, but still fall far short of what climate models recommend. A recent Rystad Energy forecast suggests that global CCUS capacity could expand to more than 550 million tonnes per year by 2030. That’s more than a tenfold increase over today’s roughly 45 million tonnes per year of captured CO₂.
However, this projected expansion is still far below what many climate scenarios require. Limiting global warming to under 2 °C often needs CCUS to capture nearly 8 gigatonnes of CO₂ each year by 2050 in many energy transition models. That means growth must accelerate sharply after 2030 to meet climate goals.
The IDTechEx forecast shows a strong long‑term outlook for CCUS. It estimates global capture capacity will hit around 0.7 gigatonnes per year by 2036. This indicates rapid growth, with a CAGR over 20% from 2026 to 2036. This would place CCUS as a major technology in global decarbonization, if investment and deployment scale up quickly.
What This Means for the Gulf and the World
For the Gulf region, rising geopolitical risk is changing how CCUS projects are evaluated. Many planned build‑outs linked to oil and gas value chains may be slowed or repriced as risk premiums rise.
Some analysts now expect that Gulf CCUS capacity may align with a more cautious trajectory through the mid‑2030s rather than a rapid 2030 build‑out. Moreover, the 8 Mtpa shortfall equals 1.5% of the projected 550 Mtpa global capacity, placing intense pressure on North America and Europe to accelerate.
Rising costs from energy price shocks further complicate the equation. With Middle East & Africa capacity shrinking from 7% to ~4% of the total pipeline, US 45Q projects and EU ETS industrial clusters must find enough replacement capacity.
Still, global drivers for CCUS remain strong. Governments and companies worldwide continue to plan and build projects. New technologies and integrations with hydrogen, renewable energy, and industrial clusters could help spread costs and scale the technology.
As many countries expand their net‑zero plans, CCUS will play a key role in managing emissions that are difficult to eliminate through electrification or fuel switching alone.
In this evolving landscape, the CCUS market is poised for significant long‑term growth, but near‑term geopolitical disruptions and cost pressures will require careful planning, strong policy support, and sustained investment. Strategic partnerships and global cooperation will be key to ensuring that CCUS can meet both economic and climate goals.