

Renewable energy is a revolution, reshaping the global power scene. It offers sustainable alternatives to the dirty deeds of fossil fuels. Solar, wind, hydro, geothermal, and bioenergy sources are painting a brighter, cleaner energy landscape for all.
For a comprehensive understanding of solar energy—including technical details, key players, regulatory considerations, and future trends—this guide offers valuable insights.
Executive Summary
- What is Solar Energy?
- Solar Power’s Role in Achieving Net Zero
- How Does Solar Energy Work?
- What is Photovoltaic (PV) Technology?
- What is Concentrating Solar-Thermal Power (CSP)?
- Renewables Set to Overtake Coal by 2026: Solar Takes the Spotlight
- Top Countries Leading the Solar Energy Boom
- Global Solar Market Growth Forecast
- Top 5 Global Solar Companies: 2026 Estimates
- What’s Driving Solar Growth?
- Battery Energy Storage System (BESS) in Solar
- Advantages of Solar Energy: Why Solar Energy is a Smart Choice
- Challenges in Adopting Solar Technology
- Investment Trends: Top Solar Energy Stocks to Watch in 2026
- Solar Energy and Carbon Credits
- Smarter Solar: Community, Microgrids, and AI Power the Future
- From Panels to Powerhouses: 2026’s Solar Efficiency Boom
- Conclusion
What is Solar Energy?
Solar energy is the radiation that comes from the Sun and can be used to generate heat, electricity, and chemical reactions. The amount of solar energy reaching the Earth is far greater than what we currently use. If harnessed efficiently, it can sustainably meet all our energy needs.
Solar Power’s Role in Achieving Net Zero
Solar power is crucial for achieving net-zero emissions. This goal stems from the Paris Agreement, which seeks to limit global warming to below 2°C, aiming for 1.5°C. Solar energy is carbon-free and renewable, allowing us to use less fossil fuel. This shift helps countries reduce carbon emissions and meet climate targets. With lower costs and better technology, solar power is growing in homes, industries, and cities.
Large solar farms and rooftop panels are taking the place of coal and gas plants, cutting emissions. New technologies like agrivoltaics, floating solar, and building-integrated panels boost solar’s potential. Battery storage and smart grids also make solar energy more reliable.
Governments support solar adoption through incentives, tax credits, and clean energy policies. As a result, solar energy will significantly help reduce carbon emissions by providing clean energy for the grid, transportation, and industries.
This progress will assist countries in meeting their net-zero goals for climate change and lead to a greener future.
How Does Solar Energy Work?
Most solar energy today comes from solar PV, which uses special materials called semiconductors—like silicon—to capture sunlight and turn it into electricity. When sunlight hits these materials, it knocks electrons loose, creating an electric current.
Solar panels, often seen on rooftops and in large solar farms, contain many small solar cells made of semiconductor material. These cells absorb sunlight, release electrons, and direct them to flow in the same direction, producing electricity. This power can then be used immediately or stored in batteries for later use.
Solar energy is converted into electricity using two main technologies:
- Photovoltaics (PV)
- Concentrating solar-thermal power (CSP)
However, both technologies help power homes, businesses, and electric vehicles, making solar energy a key player in the shift to clean power. They are also commonly known as utility-scale solar.
What is Photovoltaic (PV) Technology?
Photovoltaic (PV) technology is the most commonly used solar technology. A single PV unit, called a solar cell, is a thin device that typically generates 1 to 2 watts of power. Multiple solar cells connect to form a module or panel, and several panels create an array.
These arrays connect to the electrical grid, forming a complete PV system. An inverter converts the direct current (DC) electricity from panels into alternating current (AC) for home and business use. The solar cells are enclosed in glass or plastic layers to protect them from outdoor conditions
The efficiency of a solar PV depends on the material’s ability to convert sunlight into electricity. It is influenced by factors like light intensity and the semiconductor’s bandgap, which determines how much light the material absorbs.
Moving on, we will explain the materials used in a solar cell.
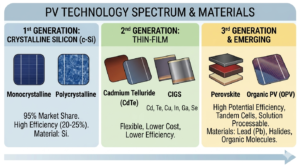
Silicon and Thin-Film Solar Cells
Silicon: The most common material in solar panels, making up 95% of PV modules. It is one of the most abundant elements on Earth, making up 28% of the Earth’s crust. China dominates production, supplying 79% of the world’s silicon in 2023.
Silicon’s crystal structure helps convert sunlight into electricity effectively. Panels last over 25 years, retaining at least 80% of their power. Thus, silicon is the top choice because it is affordable, efficient, and long-lasting. According to the Renewable Energy Institute’s latest report, in China, the cost of crystalline silicon solar panels was just $0.11 per watt.
Thin-Film Solar Cells: These are made by layering PV materials on glass, plastic, or metal. The two main types are:
- Cadmium Telluride (CdTe): The second-most used PV material. It is cheaper to produce but less efficient than silicon.
- Copper Indium Gallium Diselenide (CIGS): Offers high efficiency but is harder to manufacture due to its complex composition.
As per the U.S. DOE, thin-film solar cells make up about 3% to 5% of the global market but are generally less efficient than silicon. The highest efficiency for thin-film cells is 22.1%, while monocrystalline silicon cells can reach 25%, and polycrystalline silicon cells exceed 20%.
Although thin-film cells are cheaper, they require extra protection for durability. While PV technology has improved in efficiency and cost, silicon remains the top choice for long-lasting and reliable solar power.
What is Concentrating Solar-Thermal Power (CSP)?
The second type of solar energy is CSP- concentrating solar-thermal power. This technology uses mirrors to generate electricity. Unlike solar panels, which turn sunlight directly into electricity, CSP focuses sunlight onto a receiver to create heat. This heat produces steam, which powers a turbine to generate electricity.
How CSP Plants Work
CSP plants consist of three main components:
- Solar Collectors – Mirrors or lenses capture and focus sunlight onto a receiver. Common types include parabolic troughs, power towers, and parabolic dishes.
- Thermal Energy Storage – Excess heat is stored, allowing plants to generate power even when sunlight is unavailable.
- Power Block – Heat is transferred to a working fluid, such as molten salt or oil, which produces steam. This steam drives a turbine connected to a generator, producing electricity. The electricity is then distributed for residential and commercial use.
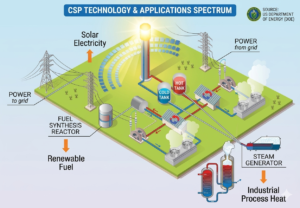
The image above illustrates how CSP can work with existing power plants, including fossil fuel systems. It has lower operating costs than nuclear and hydrocarbon plants because it requires less maintenance. It can also combine with other energy sources to keep the power grid stable. As energy demand rises, CSP provides a reliable and sustainable way to generate electricity.
Looking ahead to 2025 and beyond, improvements in solar panel efficiency, energy storage, and system design will help shape the future of global energy.
Global PV vs CSP Market Size Forecast
Renewables Set to Overtake Coal by 2026: Solar Takes the Spotlight
Renewable energy is moving ahead at a rapid pace. According to new forecasts from the International Energy Agency, clean power sources are on track to surpass coal and become the world’s largest source of electricity by 2026 at the latest.
The surge in renewables is largely fueled by strong growth in solar and wind energy. Together, they generated over 4,000 terawatt hours (TWh) of electricity in 2024. This figure is expected to climb sharply and cross 6,000 TWh by 2026.
In fact, solar power is leading the charge. It is projected to add more than 600 TWh each year, making it the fastest-growing energy source. Its share in global electricity generation could nearly double—from about 8% in 2025 to 15% by 2030.
Meanwhile, wind energy is also expanding steadily, with an average annual growth rate of around 10%. Their combined share is set to increase from 17% in 2025 to 27% by 2030.
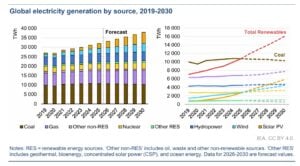
As a result of this rapid expansion, renewable energy will continue to gain a larger share of the global electricity mix. Overall, renewables are expected to grow at an average rate of 8.4% through 2030.
Coal’s Decline Becomes Clear
The shift away from coal is becoming more visible. By 2026, the transition is almost certain. At this point:
- Renewables are expected to supply 36% of global electricity
- Coal’s share will fall to 32%, marking its lowest level in a century
Top Countries Leading the Solar Energy Boom
Clean energy is gaining strong momentum worldwide. Today, nearly 140 countries have climate and energy security policies in place. As a result, renewables like solar and wind have become cost-competitive with fossil fuels.
This shift is driving demand from businesses and households. At the same time, it is boosting local manufacturing of solar panels and wind turbines.
China Powers Ahead with Massive Solar Expansion
China continues to dominate the global solar market. However, its strategy goes beyond meeting current demand. Instead, the country is building extra capacity to prepare for future needs.
This aggressive approach allows China to support energy-intensive sectors such as AI, cloud computing, and electric vehicles. In simple terms, it ensures the grid is ready when demand surges.
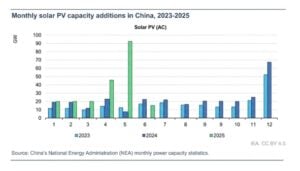
- According to the National Energy Administration (NEA), in 2025, China set a new record by installing 315.07 GW of new solar PV capacity.
- This massive expansion pushed the country’s cumulative installed solar capacity to 1.20 TW by the end of the year. The growth was remarkable, with solar capacity rising 35.4 % year-on-year, underscoring China’s rapid acceleration in renewable energy deployment.
This means the country added more than twice the solar capacity of all other nations combined. As a result, China now accounts for about 67% of global installations. Another key milestone is approaching. China’s total installed solar capacity is expected to surpass coal power capacity for the first time. This marks a major shift in the country’s energy transition.
Looking ahead, solar generation will keep rising strongly. The IEA expects solar output in China to increase by 320–360 TWh every year through 2030. This growth alone will meet about 60% of the country’s annual electricity demand increase.
In fact, China’s solar expansion over the next five years will be larger than the rest of the world combined.
- The China Photovoltaic Industry Association estimates that China could add 180–240 GW of solar capacity in 2026. This would represent roughly one-third of global additions.
Between 2026 and 2030, annual installations in China could range between 238 GW and 287 GW. Although additions may slow slightly after the record 315 GW installed in 2025, growth is expected to stabilize and recover. In the most optimistic case, installations could reach around 320 GW again by 2030.
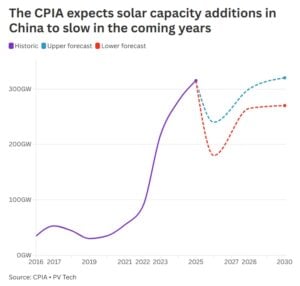
Overall, China remains the world’s largest and fastest-growing solar market.
India Emerges as the Fastest-Growing Solar Market
India is quickly becoming a global solar leader. While it started from a smaller base, its growth rate is among the highest in the world.
Looking ahead, solar will play a major role in meeting energy demand. Around 50% of India’s additional electricity demand through 2030 is expected to come from solar power. Coal will still contribute, but at a much lower share of about 25%.
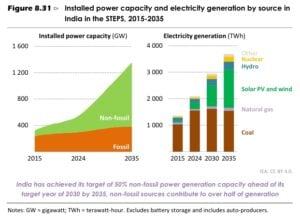
Solar generation in India is set to grow rapidly. It is expected to increase by around 24% each year. As a result, solar’s share in electricity generation will reach about 10% by 2026 and rise close to 18% by 2030.
At the same time, installed capacity has expanded sharply. By June 2025, India’s solar capacity reached 110.9 GW. This is a huge jump from just 2.82 GW in 2014—nearly a 39-fold increase.
In addition, yearly installations are rising fast. In FY 2024–25 alone, India added 23.83 GW of solar capacity. This reflects strong policy support and growing investor interest.
Domestic manufacturing is also improving. Module production capacity increased from 2.3 GW to 88 GW. Meanwhile, solar cell production rose from 1.2 GW to 25 GW. These gains are helping India reduce reliance on imports.
Recent data highlights how strong this growth has become. In 2025, India added a record 37.9 GW of solar capacity, marking a 54.7% increase from 2024.
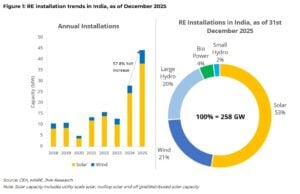
Government programs have played a key role in this expansion. Initiatives like PM Surya Ghar: Muft Bijli Yojana and PM-KUSUM have encouraged households and farmers to adopt solar energy.
Looking forward, India plans to add nearly 300 GW of renewable capacity between 2026 and 2030, with solar taking the lead.
In short, India combines rising energy demand with aggressive solar expansion, making it the second-largest growth engine after China.
U.S. Solar Growth Hits Pause, Not Stop
Solar power in the United States kept growing fast, but its share in the overall electricity mix rose more slowly. This is because other sources, especially natural gas, also expanded quickly. Solar’s share crossed 7% in 2025 and is expected to reach 10% by 2028 and 11% by 2030.
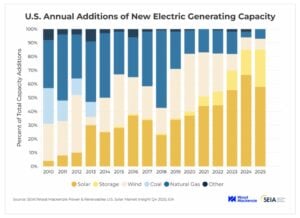
- The U.S. installed 43.2 gigawatts (GW) of new solar capacity in 2025, according to the Solar Energy Industries Association (SEIA) and Wood Mackenzie.
- Solar made up 54% of all new electricity-generating capacity, staying the top technology for the fifth year in a row.
Growth slowed in 2025. Total solar installations fell 14% from 2024 levels. The drop came mainly from fewer utility-scale projects. In the fourth quarter, installations fell 40% from the previous quarter. The One Big Beautiful Bill Act (OBBBA) caused delays. Developers pushed many projects to 2026–2028.
How does 2026 look for US solar? Insights from Wood Mackenzie
Wood Mackenzie said in its U.S. Energy Storage Monitor Q1 2026 that the country’s storage market is set to grow strongly over the next few years.
From 2026 to 2031, the U.S. is expected to add nearly 0.5 terawatt-hours (TWh) of energy storage. This marks about a 250% increase compared to the 2020–2025 period.
- The utility-scale segment will lead this growth. It is projected to expand at an average rate of 16% per year, supported by federal incentives and rising electricity demand during peak hours.
- The commercial and community (CCI) segment is also set to grow fast. Annual installations in this segment could increase by 39% between 2025 and 2030, driven by state-level programs, tax credits, and the need for stronger grid support.
- The residential segment may see a slight dip. After a strong 2025, when many homeowners benefited from the Section 25D Investment Tax Credit (ITC), installations are expected to fall by 2% in 2026.
Looking ahead, the report highlights some uncertainty. Different scenarios suggest a 52 GW gap in total installations, depending on factors like electricity demand growth, rules around Foreign Entities of Concern (FEOC), and policy changes.
Even with these risks, the overall outlook remains positive. Annual U.S. energy storage installations are expected to exceed 28 GW by 2031 across all segments.
What EIA Says?
The EIA reported 53 GW of new capacity in 2025. This was the highest since 2002. Wind and utility-scale solar together produced 17% of U.S. electricity. Two decades ago, it was less than 1%.
Growth is expected to rebound. Developers plan to add 86 GW of new capacity in 2026. This could set a new record. Solar will make up 51% of the total. Battery storage will account for 28%, and wind 14%. Utility-scale solar alone could reach 43.4 GW. That is a 60% increase from 2025.
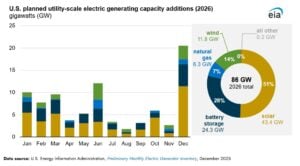
A few states will drive this growth. Texas will lead with about 40% of new solar capacity. California will also play a major role. Together, they will contribute nearly half of all additions. States like Indiana, Arizona, Michigan, Florida, and New York will each add over 1 GW.
Overall, the U.S. solar sector remains strong. Short-term challenges exist. But long-term demand stays high. Solar will play a bigger role in the clean energy transition.
Solar Leads EU’s Clean Energy Surge
The EU has set clear goals for 2030. These include a 55% cut in greenhouse gas emissions, the rollout of 600 GW of new solar capacity, and an 11.7% reduction in final energy use compared to earlier projections by the European Commission. These targets are not just about climate action. They also aim to improve energy security and reduce reliance on costly fossil fuel imports.
- Solar power is driving much of this progress. As per IEA, between 2026 and 2030, the EU is expected to add over 400 GW of new renewable capacity, with around 70% coming from solar alone.
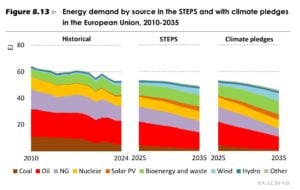
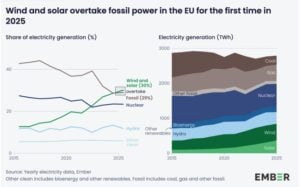
Latest analysis from think tank, Ember showed solar generation hit a record 369 TWh in 2025, marking over 20% growth for the fourth year in a row. Solar now provides 13% of EU electricity, overtaking both coal and hydropower.
Furthermore, growth has been widespread. Every EU country increased solar output, while nations like Hungary, Cyprus, Greece, Spain, and the Netherlands now get over 20% of their electricity from solar.
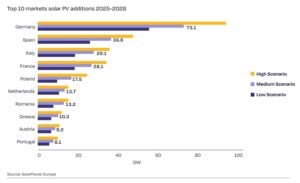
This rapid rise is largely due to capacity expansion. In 2025 alone, the EU added 65 GW of solar, split almost evenly between large solar farms and rooftop systems. Total solar output has more than doubled since 2020, showing how quickly the technology is scaling.
Fossil Fuels Decline as Clean Energy Expands
As renewables grow, fossil fuels are losing ground. Their share in EU electricity generation fell below 30% in 2024, dropping below the combined contribution of solar and wind for the first time.
However, integrating more renewables brings new challenges. Ember highlights that battery storage, stronger grids, and flexible demand systems will be key. These solutions can help balance supply and demand, improve energy security, and keep electricity prices stable.
Residential Solar Still Growing Strong
The residential segment also plays an important role. Data from Statista shows that home solar systems account for about 24% of total EU solar capacity.
Installations have grown quickly, rising from 4 GW in 2019 to 18 GW in 2023. While utility-scale projects now dominate new additions, residential solar is still expanding. Annual installations are expected to reach 23–28 GW between 2025 and 2028.
Overall, Europe’s clean energy transition is accelerating. Solar is leading the way, supported by policy, investment, and rising demand for energy independence.
- FOR MORE INFORMATION: MENA Energy Outlook 2026: Solar, Storage and AI Reshape Power Demand
Global Solar Market Growth Forecast
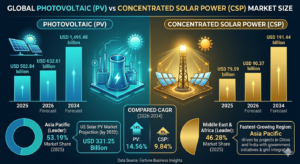
According to Precedence Research, the global solar energy market has shown strong growth and is expected to expand even faster in the coming years. It was valued at $137.02 billion in 2025 and is projected to grow to $153.91 billion in 2026. By 2034, it may reach nearly $389.86 billion, rising at a steady 12.32% annual growth rate.

PV Systems and Polycrystalline Panels Lead
Photovoltaic (PV) systems dominated the solar market in 2024, accounting for more than half of the total share. Their strong adoption came from their flexibility and ease of use across different settings.
These systems were widely installed on the rooftops of homes and commercial buildings, and they also powered large-scale solar farms.
In addition, PV technology was integrated into modern building designs such as solar windows and facades. It also played a key role in off-grid areas, providing reliable electricity for essential needs like lighting and communication.
One of the biggest advantages of PV systems is their scalability, as they can be deployed in small residential setups or expanded into large utility-scale projects. This made them suitable for both urban and rural applications.
- In terms of solar modules, polycrystalline panels held the largest share of the market in 2024.
Asia-Pacific Stays Ahead
The Asia-Pacific region dominated the global solar market, accounting for more than one-third of the total share in 2024. It was valued at USD 49.33 billion in 2025 and could hit around USD 142.3 billion by 2034.
China plays a key role in this dominance, holding the largest share of global installed solar capacity and producing around 80–90% of solar components worldwide. This strong manufacturing and deployment base has positioned the region as a central hub for the global solar industry.
- MORE DETAILS: China’s One Month Lithium Battery Energy Storage Installations Beat America’s One Whole Year
- ALSO READ: MENA Energy Outlook 2026: Solar, Storage and AI Reshape Power Demand
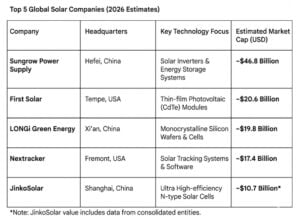
Top 5 Global Solar Companies: 2026 Estimates
What’s Driving Solar Growth?
Rising Energy Demand
Global energy needs are increasing due to population growth and rapid urbanization. More people and expanding cities mean higher demand for electricity across homes, businesses, and industries. This is pushing countries to adopt sustainable energy sources like solar and reduce fossil fuel dependence.
Data Center and AI
Rising electricity demand from data centers and AI models is driving the solar boom. Gartner analysts project that global data center electricity use will increase from 448 terawatt-hours (TWh) in 2025 to 980 TWh by 2030.
Solar will need to replace fossil fuels and scale fast, combining with storage, wind, or gas for reliable zero-emission power.
Big tech players like Microsoft, Google, Meta, and Amazon are investing heavily, and solar companies capable of multi-GW projects are likely to thrive, possibly leading to market consolidation.
Strong Climate Goals
Countries are setting ambitious targets to reduce emissions and limit global warming. Clean energy adoption is critical, as energy-related emissions make up a large share of greenhouse gases. Government policies, incentives, and renewable energy targets are boosting solar adoption worldwide.
Battery Energy Storage System (BESS) in Solar
Battery Energy Storage Systems (BESS) allow solar energy to be stored and used when needed, making solar power more reliable. These systems use batteries, including lithium-ion technology, to capture electricity from solar panels, wind, or other sources. The stored energy can then be used during cloudy periods, at night, or when electricity demand is high, ensuring a steady power supply.
Benefits of Solar Battery Storage
- Maximizes Solar Usage – Stores excess energy for use when sunlight is unavailable.
- Reduces Electricity Costs – Helps avoid high energy prices during peak hours.
- Supports Grid Stability – Balances supply and demand, preventing grid overload.
- Provides Backup Power – Ensures energy availability during power outages.
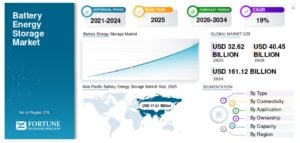
Fortune Business Insights reported that the global BESS market was worth $32.62 billion in 2025. It is set to grow to $40.45 billion this year and reach $161.12 billion by 2034, with a steady rise at 18.86% per year.
Growing Adoption Drives Market Growth
- The Asia-Pacific region led the global BESS market, generating USD 17.31 billion in 2025 and expected to reach USD 21.32 billion in 2026.
Increased electrification in remote areas and major grid upgrades in countries like Japan, Australia, South Korea, India, and China are driving demand. Rising energy needs across residential, commercial, and industrial sectors are also boosting adoption of reliable backup and peak power solutions.
- In North America, the market reached USD 11.18 billion in 2025 and is projected to grow to USD 14.23 billion in 2026.
Growth is supported by rising adoption in the U.S., alongside efforts to develop alternatives to lithium-based batteries, as China controls much of the global lithium-ion supply.
Top Players in the BESS Market
- The global BESS market in 2026 is led by Contemporary Battery Technology Co. Ltd (CATL) with nearly 40% market share, followed by BYD at 16%.
Other major companies include EVE Energy, LG Energy Solution, Hithium, CALB, Engie, Gotion High-Tech, REPT Battero, Samsung SDI, and Tesla. These companies are expanding production and scaling innovative energy storage solutions to meet growing global demand.
Advantages of Solar Energy: Why Solar Energy is a Smart Choice
Solar power is endless and renewable. It provides practical benefits for homes and businesses, including:
- Cuts Energy Bills –Solar panels produce free electricity, cutting monthly costs. Installation requires an initial investment, but long-term savings make it worthwhile. Financing options help reduce upfront expenses.
- Reliable and Versatile – Solar works in many climates, even on cloudy days. Battery storage and net metering let homeowners use extra energy later. It suits both urban and rural areas.
- Eco-Friendly Power – Solar energy produces no emissions. It reduces pollution and fights climate change. Rooftop panels utilize existing space, avoiding land disruptions.
- Increases Property Value – Homes with solar panels sell for more. Many states offer tax exemptions, so solar is a smart financial choice.
- Durable and Long-Lasting – Solar panels can last over 25 years with minimal maintenance. Warranties support long-term performance, ensuring reliable energy for decades.
Challenges in Adopting Solar Technology
Solar power has great potential, but several obstacles slow its adoption. Here are five major challenges:
- High Initial Costs – Installation remains expensive, even with falling panel prices.
- Intermittent Power Supply – Solar needs sunlight, so it can’t work at night or on cloudy days.
- Land and Space Issues – Big solar farms require a lot of land. This can clash with farming.
- Supply Chain Challenges: Solar panels require key materials, such as silicon and lithium. These materials may face shortages.
- Grid Integration Issues – Traditional power grids weren’t built for intermittent, decentralized energy.
However, solving these challenges will boost solar adoption. For example, incentives cut costs, batteries store energy, and smart grids ensure reliability. Rooftop panels and floating farms save space, while recycling secures supply. Grid upgrades and microgrids improve stability, making solar more dependable.
Investment Trends: Top Solar Energy Stocks to Watch in 2026
The solar energy sector remains one of the most attractive investment themes in 2026. Solar leaders and infrastructure giants are benefiting from rising clean power demand, especially from AI-driven data centers.
After a volatile phase, the sector rebounded strongly in 2025 and continues to offer long-term growth opportunities. Analysts and industry pundits have revealed the most actively watched and high-potential solar stocks this month:
- First Solar (FSLR) – A dominant solar manufacturer with a massive ~64 GW backlog stretching toward 2030. Strong demand visibility and capacity expansion continue to support long-term growth.
- Nextracker (NXT) – A global leader in solar tracking systems. The company is scaling fast with strong revenue visibility, solid backlog, and consistent institutional inflows.
- Clearway Energy (CWEN) – Operates over 13 GW of renewable and storage assets. Long-term PPAs, including deals with big tech, provide stable earnings and predictable cash flow.
- NextEra Energy (NEE) – One of the largest clean energy producers globally. Its expanding wind, solar, and battery portfolio is benefiting from rising electricity demand driven by AI and cloud growth.
- Brookfield Renewable Partners (BEP) – Offers scale and stability with most cash flows locked in long-term contracts. Strong investment pipeline and partnerships with tech firms support steady growth.
Solar and renewable stocks for this year combine growth and stability. Manufacturing leaders like FSLR and NXT offer expansion upside, while CWEN, NEE, and BEP provide steady returns backed by long-term contracts. The AI-energy link is emerging as a major catalyst for the sector.
SEE MORE: Meta and NextEra Partner for a Big Solar and Storage Energy Deal
Solar’s Big Drop Is Over—Now Prices Are Steady
Solar panel prices have fallen sharply over time. In the 1970s, they cost more than $100 per watt. By 2023–2024, prices dropped to about $0.25 per watt.
- The International Renewable Energy Agency (IRENA) reported that solar power costs dropped to about $0.043 per kWh in 2024, making it one of the cheapest energy sources today.
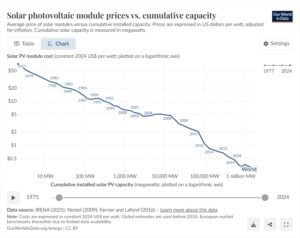
However, the steep decline has now slowed. Prices are no longer falling fast. Instead, they are stabilizing, with slight increases in some regions.
- In 2026, they mostly sit between $0.18 and $0.25 per watt.
One major reason is China’s policy shift. The country removed export tax rebates on solar modules in 2026, pushing global prices up by around 10–15%. At the same time, demand remains strong and supply chains are more balanced, which keeps prices steady rather than falling.
Utility Solar Stays Cheap, But Home Systems Cost More
Large solar projects still get the lowest prices because they buy in bulk. In many leading markets like India and parts of Europe, solar electricity costs are now often below $50 per MWh.
Residential systems, however, are more expensive. According to the National Renewable Energy Laboratory, home solar systems cost about $2.5 to $3.5 per watt before incentives. This is because the total cost includes installation, inverters, mounting, and permits. Panels themselves only account for a portion of the total cost.
Regional Snapshot: China, US, and India Prices
Solar prices vary by region due to policy, manufacturing, and trade factors.
- China remains the cheapest producer, with module prices around $0.10–$0.12 per watt in 2026, due to large-scale manufacturing and oversupply.
- United States sees higher prices due to tariffs and trade restrictions, which can add $0.10–$0.15 per watt on imported modules.
- India typically falls in the middle, with module prices roughly around ₹70–80 per watt (~$0.20–$0.25 per watt) depending on type and scale.
This gap shows how local policies and supply chains directly impact solar costs.
The Shift: From Cheaper Panels to Better Performance
As per analysts the market is now moving from rapid price drops to steady improvement.
Modern solar panels are more efficient and last longer than before. They also lose performance more slowly over time. So even if upfront prices are not falling much, the overall value of solar energy continues to improve.
At the same time, further cost reductions are getting harder. Manufacturing is already highly efficient, and savings in materials are smaller. Costs also depend on factors like polysilicon prices, energy use in factories, and global trade conditions.
Solar is no longer getting dramatically cheaper each year, but it remains one of the most affordable energy sources worldwide. The trend has shifted from fast price drops to stable pricing, with better technology driving long-term value.
Solar Energy and Carbon Credits
Solar power not only cuts carbon emissions but also creates extra income through Solar Renewable Energy Credits (SRECs). Each SREC equals one megawatt-hour (MWh) of clean electricity. Solar owners can sell these credits to utilities in states with Renewable Portfolio Standards (RPS). New Jersey and California are the largest SREC markets, offering strong demand and steady opportunities for solar investors.
How SRECs Work
Every 1 MWh of solar electricity earns one SREC, tracked through official state systems—PJM-GATS in New Jersey and California’s registry. Utilities buy these credits to meet renewable energy targets. Prices vary depending on supply and demand.
For instance,
- New Jersey: SREC prices are relatively stable, favoring long-term contracts.
- California: High volumes from large projects drive activity, but prices can be more volatile.
SRECs provide an additional revenue stream beyond electricity sales, making solar investments more profitable.
Federal Tax Incentives in 2026
The Residential Solar Investment Tax Credit (30%) expired after December 31, 2025, so new residential solar installations in 2026 cannot claim this credit. However, commercial and utility-scale projects may still qualify for reduced federal incentives under Section 48E.
These can range from 26–40% if projects meet eligibility rules. Battery storage paired with solar may also qualify for limited incentives, especially when installed with pre-2026 systems.
Selling SRECs
Solar owners register their systems with the state tracking authority. Smart meters verify electricity production, and SRECs are issued monthly or quarterly. Owners can sell credits via:
- Long-term contracts: Offer stable pricing, usually between $50–$150 per MWh.
- Spot markets: Can offer higher returns but are less predictable.
Careful planning and monitoring of SREC markets help maximize returns. Additionally, combining solar with BESS increases revenue potential.
Residential vs Utility-Scale Solar
- Residential systems: Focus on stable SREC contracts, local rebates, and battery storage for self-consumption.
- Utility-scale projects: Benefit from federal incentives, bulk SREC sales, and corporate power purchase agreements (PPAs), making them attractive for investors.
Investing in solar isn’t just good for the environment—it’s a smart financial move. With the right strategy, solar owners can lower costs, earn revenue, and contribute to a greener future. In the broader context, major tech companies like Amazon, Google, Meta, and Microsoft are investing heavily in solar energy and credits to reach net-zero emissions.
Smarter Solar: Community, Microgrids, and AI Power the Future
Community Solar Projects
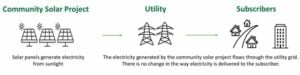
Community solar is transforming access to renewable energy by letting multiple people share a single solar installation. Instead of installing panels on their own rooftops, participants join an off-site solar farm and receive credits on their electricity bills for the energy produced.
According to the US DOE, these projects feed electricity into the utility grid, making solar energy affordable and accessible. Community solar benefits homeowners, renters, and businesses who cannot install rooftop panels, particularly low- and moderate-income households, while supporting national sustainability goals and reducing electricity costs.
Microgrids and Decentralized Energy
Traditional grids are becoming less reliable and more expensive, driving a shift toward decentralized energy systems. Microgrids are small, independent networks that operate alone or alongside the main grid, using local energy sources such as solar panels, wind, hydrogen, and battery storage.
They offer energy independence, resilience during outages, greater efficiency by reducing transmission losses, and cleaner power through renewable integration. Companies are increasingly adopting on-site solar and storage to cut costs and reduce reliance on the grid.
- Precedence Research data revealed that the global microgrid market was valued at USD 51.40 billion in 2025 and is projected to reach USD 236.18 billion by 2034, growing at a CAGR of 18.52%.
AI Integration in Solar Systems
Artificial intelligence is boosting solar energy efficiency, reliability, and cost-effectiveness. AI predicts energy demand, balances supply, reduces waste, and enhances grid stability. It enables predictive maintenance, early fault detection, and better energy forecasting. AI also optimizes solar panel placement, manages battery storage, and improves customer experience with real-time insights.
Additionally, AI accelerates solar research and innovation, helping panels become more efficient and durable. These technologies are shaping the future of renewable energy, making clean, reliable power increasingly accessible worldwide.
- INTERESTING READ: Elon Musk’s SpaceX Eyes Solar Data Centers in Space to Power the AI Boom
From Panels to Powerhouses: 2026’s Solar Efficiency Boom
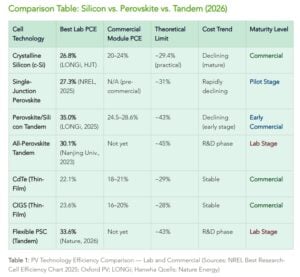
Solar cell efficiency shows how much sunlight a panel can turn into electricity. Higher efficiency means more power from the same space. In 2026, commercial solar panels are surpassing 25% efficiency, while new materials like perovskites push lab records above 30%, making solar cheaper and more effective, especially in countries like India.
Perovskite Solar Cells
Perovskite cells can capture a wider range of sunlight, especially when stacked with silicon in tandem designs. Tandem panels layer perovskite on silicon to catch more sunlight. Labs now report efficiencies over 30%.
In November 2023, LONGi’s crystalline silicon-perovskite tandem solar cell was certified by NREL at 33.9% efficiency, beating standard silicon panels. Recent improvements make them more durable outdoors and closer to commercial use.
Bifacial and n-Type Panels
Bifacial panels collect sunlight from both sides, boosting output by 5–20%, making them great for ground-mounted farms. n-Type panels like TOPCon and HJT offer 22–24% efficiency, resist degradation, and perform well in hot climates.
Conclusion
Solar energy has moved past its early growth phase. It is now entering a mature, high-impact era where innovation, storage, and digital intelligence define its value.
While challenges like intermittency, land use, and supply chains remain, solutions are scaling just as fast. Most importantly, AI and electrification will accelerate demand. Tech giants such as Microsoft, Google, Amazon, and Meta are already fueling solar expansion to power data centers and AI infrastructure.
As electricity demand nearly doubles in some sectors, solar paired with storage will play a critical role in replacing fossil fuels.
In short, the transition is clear: from cheaper panels to smarter power systems—and from rapid growth to global energy transformation.
LATEST: Texas Solar Market Heats Up with Meta and Google Investments