Ecosystem Marketplace (EM) releases the 2023 State of the Voluntary Carbon Market (SOVCM) report, thoroughly analyzing global voluntary carbon credit supply and demand. The report combines interviews and disclosures from key market players with registry data from major carbon credit standards. While retrospective, the report also provides insights into future market trends.
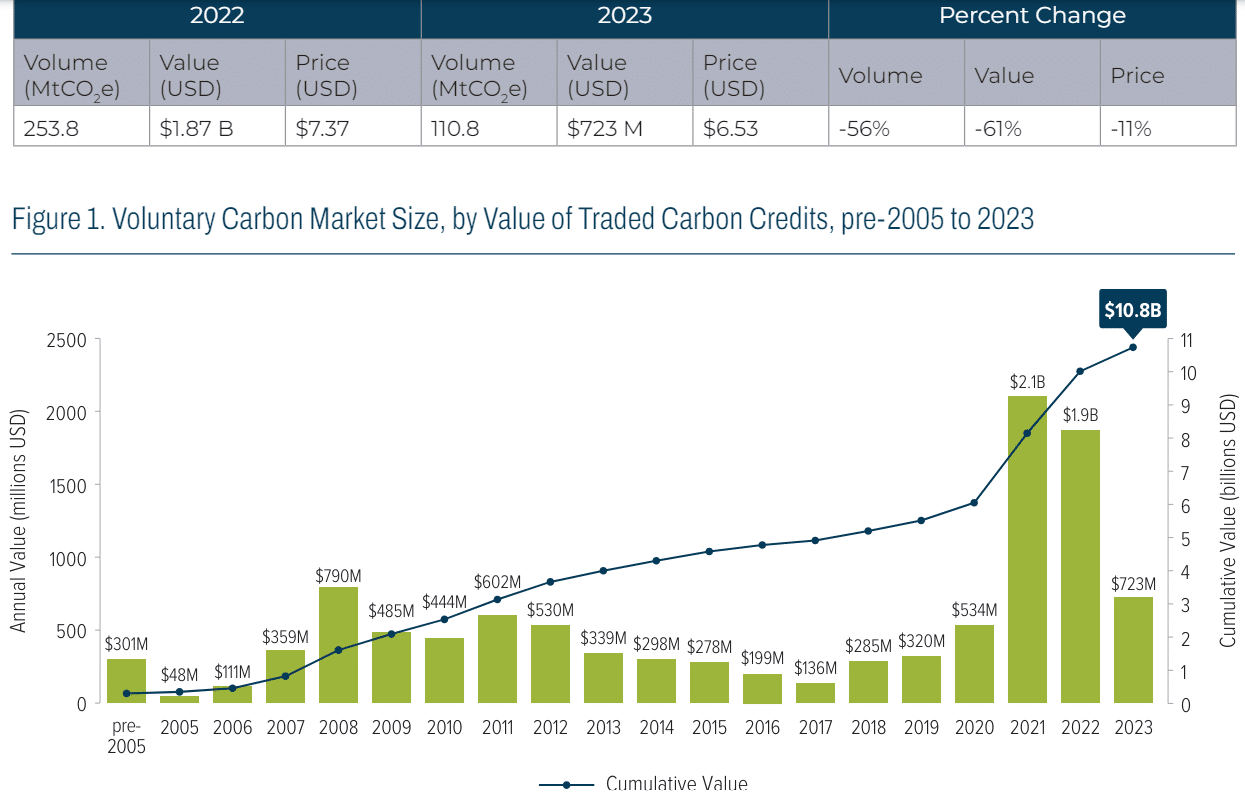
2023 marked a significant year for the market, characterized by more scrutiny due to media coverage of unethical carbon projects. Despite this, the market’s value rose for the fourth consecutive year since 2020, reaching $723 million in 2023. This trend, which began in 2020 and peaked in 2021 with over $2 billion in carbon credits traded, has partially offset declining transaction volumes.
Overall, 49% of the total VCM value reported to EM since 2005 occurred between 2020 and 2023, signaling significant market growth and resilience. We crunch the EM report, with the following highlights.
The Big Picture: Volume, Value, and Price Dynamics
In 2023, the voluntary carbon market (VCM) experienced a significant downturn, with total transactions plummeting by 56% to 111 million tons CO2e compared to the previous year. Despite this steep decline in volume, the average price per ton of CO2e only saw a moderate decrease of 11%, reaching $6.53.

Consequently, the total market value also took a hit, dropping by 61% year-over-year to $723 million. This decline in market activity was primarily attributed to both a reduction in volume and a retreat from the peak carbon prices observed in 2022.
The decrease in the number of market respondents further contributed to the downturn, with some entities merging and others temporarily halting credit sales as they awaited the establishment of stronger integrity and quality norms within the VCM. As a result, the number of respondents providing transaction data decreased from the previous year.
Qualitative feedback from market participants revealed divergent trends among different segments of the market. Remarkably, there was a notable preference among buyers for credits sourced from nature-based and community-focused projects, which offer additional environmental and social co-benefits alongside emissions reductions.
This shift in preference away from carbon removal projects contributed to the decline in overall market volume. However, the impact on market value was less pronounced.
Buyer Behavior: Premiums and Preferences
The EM report further highlighted notable variations in credit prices depending on the buyer type. End users, who directly use carbon credits for emission reduction purposes, paid a premium of 33% over intermediaries, consistent with the previous year. This premium reflects the value end users place on credits for achieving their sustainability goals.
Notably, transactions involving Energy Efficiency/Fuel Switching and Renewable Energy credits saw the largest premium for end users. This indicates a reliance on intermediaries for project quality assessment.
Among different credit standards, Gold Standard credits commanded the highest premium for end-user sales, amounting to 140%, up from 83% in 2022. This suggests a growing preference among buyers for trusted intermediaries to vet project quality.
Similarly, Clean Development Mechanism (CDM) and Verified Carbon Standard (VCS) credits also saw substantial increases in premiums for end-user sales. The shift towards intermediaries for project quality assessment is particularly pronounced in CDM transactions, with 73% of sales going to intermediaries in 2023.
These trends may reflect market uncertainty surrounding the transition of CDM projects to future mechanisms under the Paris Agreement. This prompted buyers to rely more on intermediaries for quality assurance.
Registry Round-Up: Project Registrations and Trends
Analysis of registry data from credit standard registries provides insights into the dynamics of project registrations, issuances, and retirements in the VCM.
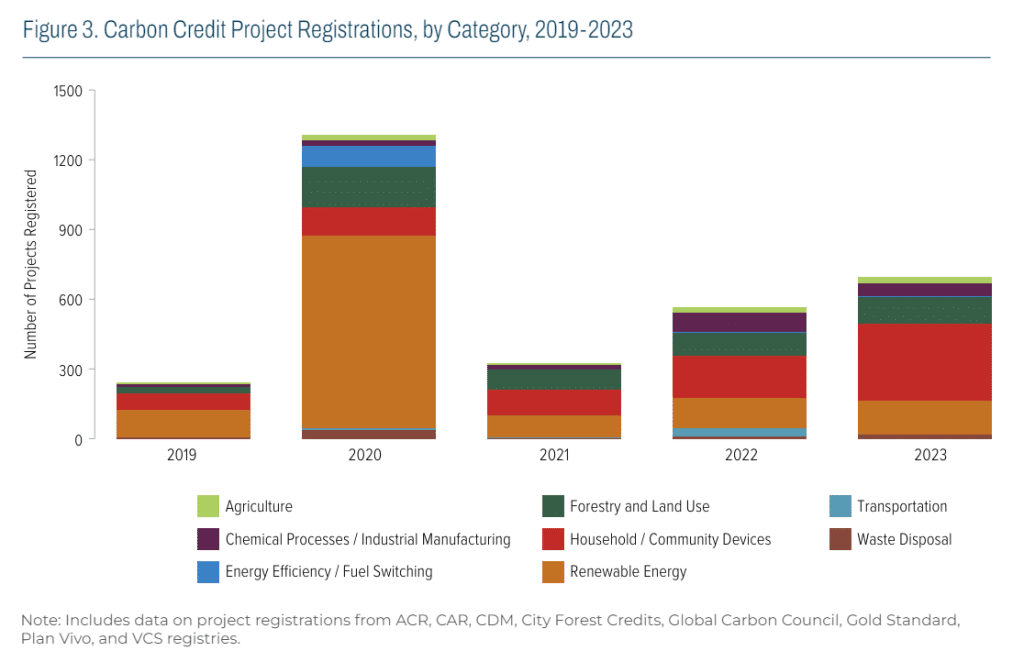
Despite challenges, the total number of newly registered projects increased to 694 in 2023, with Household/Community Devices projects leading the growth. Registrations in Forestry and Land Use, Renewable Energy, Agriculture, and Waste Disposal categories also saw year-on-year increases.
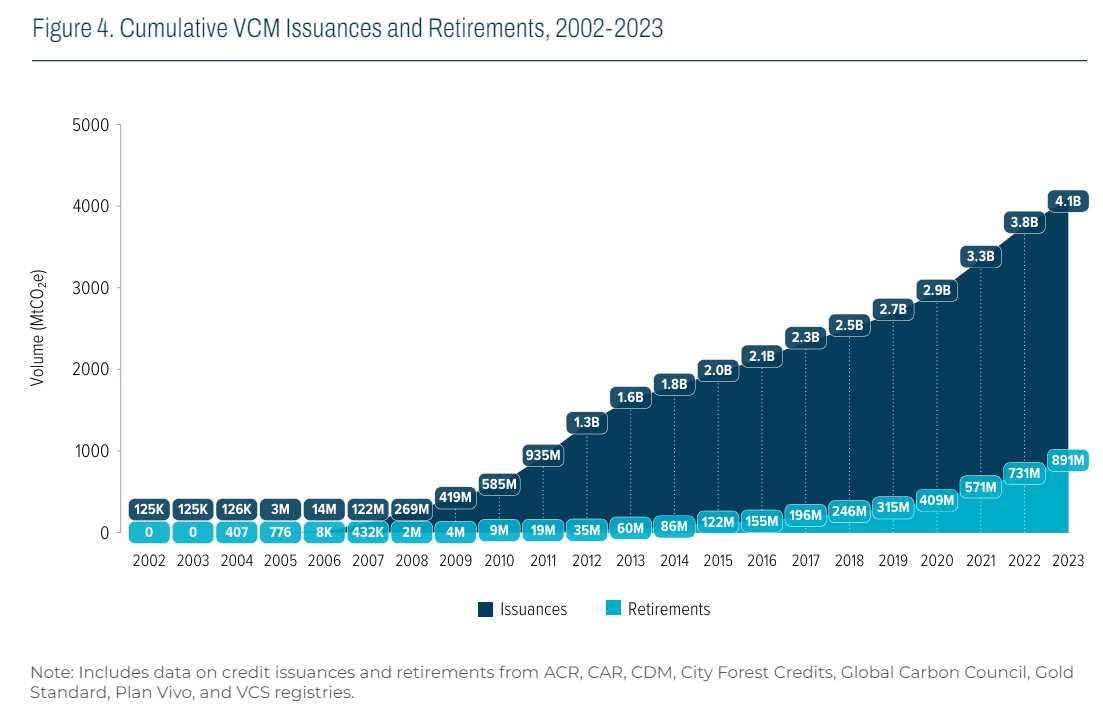
In terms of credit issuances, it decreased by 93 MtCO2 e in 2023 compared to 2022. Meanwhile, retirements increased by 2.6 MtCO2 e, indicating a tightening surplus supply of carbon credits.

Forestry and Land Use, and Chemical Processes/Industrial Manufacturing categories saw the greatest growth in retirements, suggesting a preference for projects with clear carbon removals and emissions reductions. Conversely, retirements of Renewable Energy, Waste Disposal, and Transportation credits decreased.
Total annual credit retirements have remained around 170 MtCO2 e for the past three years, indicating steady fundamental demand. However, there’s potential for increased retirements if corporate buyers can claim credits as offsets against their Scope 3 emissions targets. These trends reflect shifting preferences towards projects with stronger additionality and clear carbon impact within the VCM.
Evolving Project Preferences
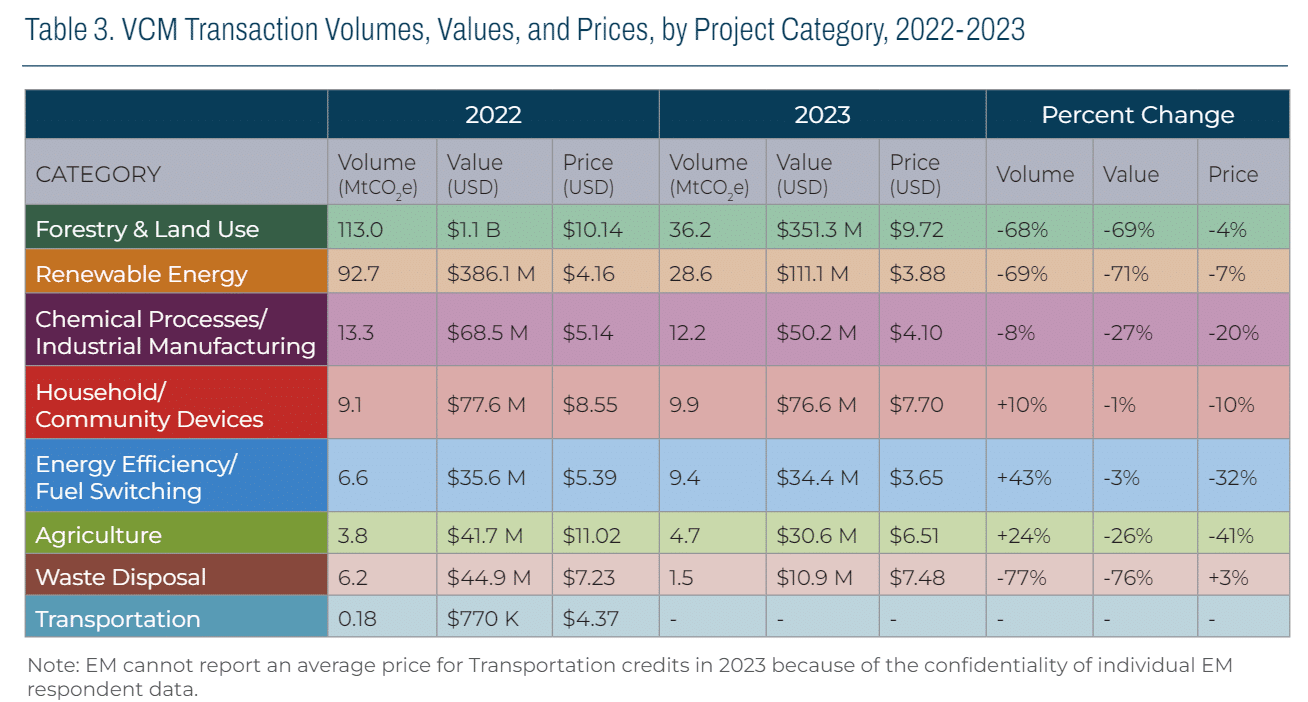
The decline in total market value for all categories of VCM credits in 2023 was accompanied by various factors affecting each category. While some categories experienced increases in volume and/or average transaction price, others faced declines.
Energy Efficiency/Fuel Switching, Agriculture, and Household/Community Devices categories saw volume growth, indicating increased activity. However, Forestry and Land Use and Renewable Energy credits witnessed the largest declines in volume, despite being popular project types.
However, Blue Carbon credit volume plummeted, with prices driven down, particularly for Wetland Restoration/Management projects without ARR activities.
Notably, North American industrial process efficiency credits were transacted at lower prices, contributing to the price decline in the Chemical Processes/Industrial Manufacturing category. These trends illustrate shifting dynamics within different segments of the VCM, reflecting evolving market preferences and supply factors.
Access full copy of the report here.


