
Climate action starts with measurement. Before companies can reduce greenhouse gas emissions, achieve net-zero goals, or show sustainability progress to investors, they first need to understand where their emissions come from and how much they produce. This process is known as carbon accounting.
Once seen as a niche sustainability activity, carbon accounting has become a core business function.
The change has been significant. In 2024, more than 24,800 companies disclosed environmental data through CDP, representing over two-thirds of global market capitalization.
The number of reporting organizations has grown nearly fivefold over the past decade. This reflects the growing importance of climate transparency in business decisions.
Investors use emissions data to assess climate risks. Regulators increasingly require climate disclosures. Customers and stakeholders expect transparency. Companies also rely on carbon data to find opportunities to improve efficiency and reduce emissions.
In many ways, carbon accounting is becoming as important as financial accounting.
This guide explains what carbon accounting is, how it works, and why it matters. It also explores how new technologies like artificial intelligence (AI) are transforming how organizations track and manage their carbon footprints.
What Is Carbon Accounting?
Carbon accounting is the process of measuring, tracking, and reporting greenhouse gas (GHG) emissions produced by a company, product, service, or activity.
The goal is to create a complete emissions inventory and convert it into a common unit called carbon dioxide equivalent (CO2e). This standard measurement allows organizations to compare the climate impact of different greenhouse gases, including:
- Carbon dioxide (CO2),
- Methane (CH4),
- Nitrous oxide (N2O),
- Hydrofluorocarbons (HFCs),
- Perfluorocarbons (PFCs), and
- Sulfur hexafluoride (SF6).
By measuring emissions in CO2e, businesses can assess their environmental impact, set reduction targets, and track progress over time.
Think of carbon accounting as the environmental version of financial accounting. Just as companies track revenue, expenses, and assets, they now track emissions as an important business metric.
Why Carbon Accounting Has Become a Business Priority
Over the past decade, climate reporting has shifted from a voluntary sustainability effort to a business requirement. Several factors are driving this change.
Why Investors Are Following the Carbon Trail
Climate risk is increasingly viewed as financial risk.
Asset managers, pension funds, banks, and institutional investors rely on emissions data. They use it to evaluate companies’ risks from regulatory changes, carbon pricing, and supply chain issues. This data also helps them understand the challenges of transitioning to a low-carbon economy.
Environmental performance has also become an important part of Environmental, Social, and Governance (ESG) investing.
Investor interest in sustainability continues to grow. According to the Global Sustainable Investment Alliance, sustainable investment assets reached more than $30 trillion across major global markets in 2023. But under stricter tracking rules, that figure sits at $16.7 trillion in 2025.
Broader industry assessments by Fortune Business Insights valued the total global ESG investing market at $39.08 trillion in 2025. This makes climate performance an increasingly important factor in capital allocation decisions.
Organizations that provide transparent emissions data often gain greater credibility with investors and stakeholders.
Climate Disclosure Is Becoming the New Normal
Many governments worldwide are now enforcing climate disclosure regulations. These rules ask companies to report their greenhouse gas emissions and related climate risks.
The European Union’s Corporate Sustainability Reporting Directive (CSRD), the International Sustainability Standards Board (ISSB) framework, California’s climate disclosure laws, and similar initiatives across Asia-Pacific are boosting the need for reliable carbon accounting systems.
And so many companies, emissions reporting is no longer optional. This is especially true in the case of large corporations.
The Supply Chain Transparency Revolution
Large companies now require suppliers to disclose emissions data as part of their procurement and sustainability programs. For example, Marks & Spencer and Schneider Electric partner to enable suppliers to directly report and track emissions data through their initiative RE:Spark.
The platform combines digital reporting with actionable, aggregated renewable energy procurement to convert Scope 3 data into verifiable, actionable reductions.
As a result, even small and medium-sized businesses are finding carbon accounting to be a must-have to stay competitive.
You Can’t Cut What You Don’t Measure
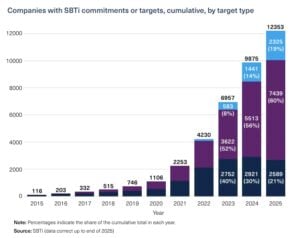
Thousands of companies around the world have announced emissions reduction targets or net-zero goals. More than 12,000 companies have committed to science-based climate targets through the Science-Based Targets initiative (SBTi).
Thousands more have announced net-zero ambitions. However, organizations cannot manage what they do not measure.
Carbon accounting provides the baseline needed to identify opportunities for reduction and track progress toward climate targets.
The Three Emissions Categories Every Business Must Know
Most companies follow the Greenhouse Gas Protocol, the world’s most widely used emissions accounting framework. The protocol divides emissions into three categories. Here they are in detail.
Scope 1: Direct Emissions
Scope 1 emissions come directly from sources owned or controlled by a company. Examples include:
- Fuel burned in company-owned vehicles,
- Natural gas used in manufacturing facilities,
- Industrial production processes, and
- Company-operated equipment.
These emissions come directly from business operations.
Scope 2: Purchased Energy Emissions
Scope 2 emissions come from purchased electricity, steam, heating, or cooling. Although the emissions occur at the power plant, the organization using the energy is responsible for reporting them.
Examples of these emissions are:
- Office electricity consumption,
- Factory power use, and
- Purchased district heating.
For many service-based businesses, electricity use is the largest source of Scope 2 emissions.
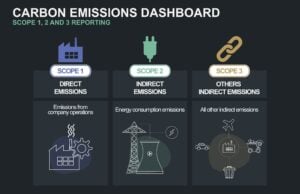
Scope 3: Value Chain Emissions
Scope 3 emissions occur throughout a company’s value chain and are often the hardest to measure. These emissions often come from two types of sources.
Upstream activities:
- Purchased goods and services
- Transportation and distribution
- Employee commuting
- Business travel
- Waste generated by operations
Downstream activities:
- Product transportation
- Product use
- Product disposal
- Franchises
- Investments
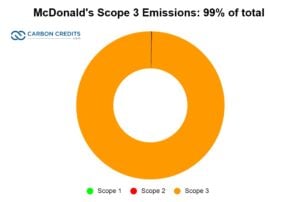
For many industries, Scope 3 emissions account for more than 70% of total emissions. In sectors such as retail, consumer goods, and financial services, they can even exceed 90%.
For the food chain giant, McDonald’s, this source accounts for a massive 99% of its total emissions.
According to CDP, Scope 3 emissions are, on average, more than 26 times greater than operational emissions (Scope 1 and Scope 2 combined). This shows why value-chain emissions have become a key focus of corporate climate strategies.
Because of their scale, Scope 3 emissions have become a major focus of corporate sustainability programs.
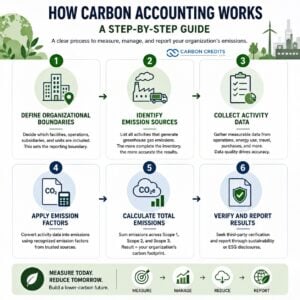
How Carbon Accounting Works: A Step-by-Step Guide
While approaches vary between organizations, most carbon accounting follows a similar process. Here are the ways you can use to compute your company’s emissions.
Step 1: Define Organizational Boundaries
The first step is deciding which facilities, operations, subsidiaries, and business units will be included in the emissions inventory.
This sets the reporting boundary.
Step 2: Identify Emission Sources
Next, organizations identify all activities that generate greenhouse gas emissions. Common sources include electricity consumption, fuel use, manufacturing processes, transportation, business travel, purchased goods, and waste management.
The more complete the inventory, the more accurate the final emissions calculations.
Step 3: Collect Activity Data
Companies gather measurable data linked to emission-generating activities. Examples include:
- Kilowatt-hours (kWh) of electricity consumed,
- Liters of diesel fuel purchased,
- Miles traveled by aircraft,
- Tons of raw materials purchased, and
- Freight transportation distances.
This step is often the most time-consuming part of carbon accounting.
For large multinational companies, collecting emissions data can involve thousands of suppliers, facilities, and business processes across multiple countries. This makes data collection one of the biggest challenges in climate reporting.
Step 4: Apply Emission Factors
Emission factors convert activity data into greenhouse gas emissions.
For example, if a company uses 10,000 liters of diesel fuel each year, a recognized emission factor can be used to calculate the related CO2e emissions.
Government agencies, scientific institutions, and international organizations typically publish these emission factors.
Step 5: Calculate Total Emissions
All emissions are converted into CO2e and combined across Scope 1, Scope 2, and Scope 3 categories.
The result is the organization’s carbon footprint.
Step 6: Verify and Report Results
Many organizations seek third-party verification to improve transparency and credibility. Verified emissions data is often included in sustainability reports, ESG disclosures, and annual reports. They can also be part of regulatory filings and net-zero progress updates.
A Real-World Look at Carbon Accounting in Action
To see how carbon accounting works in practice, let’s walk through a simplified example for a manufacturing company. Assume the company reports the following annual activity data:
- Electricity consumption: 500,000 kWh
- Diesel fuel use: 100,000 liters
- Employee air travel: 500,000 miles
To calculate emissions, the company multiplies each activity by the appropriate emissions factor. The basic formula is:
- Activity Data × Emission Factor = CO2e Emissions
Step 1: Calculate Electricity Emissions (Scope 2)
The company purchased 500,000 kilowatt-hours (kWh) of electricity during the year. Electricity emissions depend on the local power grid. For this example, let’s use a commonly cited grid emissions factor of 0.4 kg CO2e per kWh.
The calculation for this is: 500,000 kWh × 0.4 kg CO2e/kWh = 200,000 kg CO2e.
Then convert kilograms to metric tons: 200,000 ÷ 1,000 = 200 tCO2e.
So, electricity emissions = 200 metric tons CO2e.
Step 2: Calculate Diesel Fuel Emissions (Scope 1)
The company consumed 100,000 liters of diesel fuel in company-owned vehicles and equipment. According to widely used emissions factors from government and GHG reporting programs, diesel combustion produces approximately 2.68 kg CO2e per liter.
The calculation is: 100,000 liters × 2.68 kg CO2e/liter = 268,000 kg CO2e.
Then convert to metric tons: 268,000 ÷ 1,000 = 268 tCO2e.
So, diesel emissions = 268 metric tons CO2e.
Step 3: Calculate Business Travel Emissions (Scope 3)
Employees traveled 500,000 miles by air during the reporting year. Air travel emissions vary depending on aircraft type, travel class, and flight distance. For this example, assume an average emissions factor of 0.24 kg CO2e per passenger mile.
The calculation is: 500,000 miles × 0.24 kg CO2e/mile = 120,000 kg CO2e.
Then convert to metric tons: 120,000 ÷ 1,000 = 120 tCO2e.
So, business travel emissions = 120 metric tons CO2e.
Step 4: Calculate Total Corporate Emissions
Now add all emissions sources together like this:
| Emissions Source | Emissions (tCO2e) |
|---|---|
| Electricity (Scope 2) | 200 |
| Diesel Fuel (Scope 1) | 268 |
| Air Travel (Scope 3) | 120 |
| Total | 588 tCO2e |
The company’s annual carbon footprint is therefore 588 metric tons of CO2e.
What Do These Numbers Tell Us?
The emissions inventory reveals where the company’s biggest climate impacts occur:
- Diesel fuel accounts for about 46% of total emissions.
- Electricity represents roughly 34%.
- Business travel contributes about 20%.
This information helps management identify the most effective opportunities for reduction. For example, the company could switch diesel vehicles to electric alternatives. They can also purchase renewable electricity, improve energy efficiency, reduce unnecessary air travel, and use virtual meetings when possible.
Establishing a Baseline for Future Reductions
The first year of carbon accounting serves as a baseline.
Suppose the company reduces diesel consumption by 25% and purchases renewable electricity the following year. It can then compare its new emissions inventory against the baseline of 588 tCO2e to measure progress.
This is why carbon accounting is so valuable. It transforms sustainability goals into measurable data that companies can track, report, and improve over time.
While actual corporate inventories often include hundreds or even thousands of emissions sources, the underlying process remains the same:
- Measure activity → Apply emissions factors → Calculate emissions → Identify reduction opportunities → Track progress year after year.
How AI is Transforming Carbon Accounting
Carbon accounting has traditionally relied on spreadsheets, invoices, utility bills, and manual calculations. Today, artificial intelligence is changing that process.
AI-powered sustainability platforms help companies automate emissions measurement, improve reporting accuracy, and analyze large amounts of environmental data.
The opportunity is significant. Research from McKinsey estimates that AI could help speed up climate mitigation efforts by improving monitoring, forecasting, and resource optimization across high-emitting sectors.
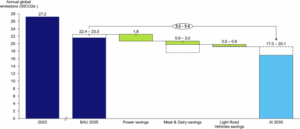
Meanwhile, a joint study by the Grantham Research Institute on Climate Change and the Environment and Systemiq estimates that AI could help reduce global greenhouse gas emissions by 3.2 billion to 5.4 billion metric tons of CO₂e per year by 2035 across the power, transport, and food sectors.
Here’s how AI can help in carbon accounting:
Automating Data Collection
One of the biggest challenges in carbon accounting is collecting information from multiple business systems. AI can automatically gather and organize data from:
- Enterprise resource planning systems,
- Procurement platforms,
- Utility invoices,
- Travel management systems,
- Manufacturing equipment, and
- Supply chain databases.
This reduces manual work and improves consistency.
Improving Scope 3 Reporting
Scope 3 emissions often involve thousands of suppliers across global supply chains. When supplier-specific emissions data is not available, AI can help estimate emissions using industry benchmarks, purchasing data, economic activity information, and supplier characteristics.
This helps companies build more complete emissions inventories while encouraging suppliers to improve reporting over time.
Identifying Emissions Hotspots
Machine learning algorithms can analyze large datasets and identify the activities that produce the most emissions.
For example, AI may show that a small group of suppliers is responsible for a large share of a company’s carbon footprint. Organizations can then focus their decarbonization efforts where they can have the greatest impact.
Supporting Climate Forecasting
Companies are increasingly using AI to model future emissions pathways and evaluate different climate strategies.
These tools can help them assess net-zero roadmaps, renewable energy investments, carbon reduction opportunities, supply chain risks, and future carbon costs
Major Companies Are Embracing AI
Technology leaders such as Microsoft, Google, IBM, SAP, Salesforce, and Oracle have added AI capabilities to their sustainability and ESG management platforms. These include:
- Microsoft Sustainability Manager,
- SAP Sustainability Control Tower,
- IBM Envizi, and
- Salesforce Net Zero Cloud.
These systems help organizations automate emissions calculations, improve reporting accuracy, and generate climate-related insights.
As climate disclosure requirements continue to expand, AI is expected to play an even bigger role in corporate carbon management.
The Carbon Data Investors Want to See
For investors, carbon accounting provides valuable insight into a company’s environmental performance and long-term resilience. Emissions data helps investors assess:
- Climate-related risks,
- Regulatory exposure,
- Transition preparedness,
- Operational efficiency, and
- Long-term sustainability strategies.
Companies with transparent carbon accounting systems often give investors greater confidence in their climate commitments. This is one reason emissions disclosures have become an important part of ESG analysis.
Key Market Trends Shaping Carbon Accounting
Carbon accounting is no longer a niche market. It is becoming a major part of corporate reporting and sustainability management.
Climate Disclosure Is Going Mainstream
More than 24,800 companies disclosed environmental information through CDP in 2024. This reflects the growing importance of climate transparency across global markets.
Those disclosures were requested by more than 700 financial institutions representing over $140 trillion in assets. This highlights growing investor demand for climate-related information.
The number of reporting companies has increased sharply over the past decade and continues to rise as investor expectations evolve.
Scope 3 Emissions Are Taking Center Stage
Companies now see that much of their carbon footprint comes from activities beyond their direct operations. Thus, organizations are investing more in supplier engagement, collecting value-chain data, and improving Scope 3 reporting.
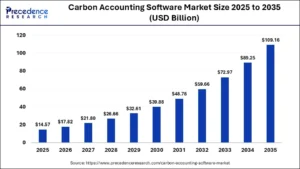
Carbon Management Software Is Growing Rapidly
The market for carbon accounting and sustainability management software will grow significantly through the end of the decade.
The global carbon management software market is projected to expand strongly through 2035, reaching over $100 billion. This growth is being driven by organizations looking for automated solutions to simplify data collection, emissions calculations, compliance reporting, and climate disclosures.
Carbon Data Is Becoming a Strategic Asset
Executives increasingly see emissions data as a business metric, not just a sustainability metric. Carbon information now influences:
- Capital allocation,
- Procurement decisions,
- Risk management,
- Supply chain strategies, and
- Corporate valuations.
Companies that manage carbon data effectively may gain a competitive advantage in a rapidly changing business environment.
Carbon data is no longer used only for sustainability reporting. It also affects procurement decisions, lending practices, supply-chain partnerships, and investment evaluations.
The Obstacles to Accurate Carbon Reporting
Despite significant progress, carbon accounting remains complex. Common challenges include:
- Data quality issues,
- Incomplete supplier information,
- Scope 3 measurement difficulties,
- Evolving reporting requirements, and
- Resource constraints.
Many organizations are still developing the systems and expertise necessary for efficient emissions reporting. Fortunately, advances in technology, verification standards, and reporting frameworks are helping improve consistency and reliability.
Where Carbon Reporting Goes Next
The future of carbon accounting will likely follow a path similar to financial accounting.
Organizations will need to measure, disclose, and verify emissions data just like they do with financial information. This shift reflects a broader trend of bringing climate performance into mainstream business reporting and corporate governance.
Ultimately, carbon accounting is quickly becoming a core business capability rather than a standalone sustainability initiative. It is the starting point for effective climate action.
It helps organizations understand their environmental impact, identify emissions hotspots, develop reduction strategies, and communicate progress to investors and stakeholders.
In the years ahead, carbon data may become just as important to business decisions as financial data. So for organizations navigating the transition to a more sustainable future, carbon accounting is no longer optional. It is essential.