
The World Bank’s 2026 carbon pricing report shows that carbon pricing continues to expand across countries and sectors. Governments are increasingly using carbon taxes and emissions trading systems (ETSs) to manage greenhouse gas emissions. However, the system is still uneven in coverage and design across regions.
Here are our key takeaways from the report.
Carbon Pricing Quietly Becomes a Global Policy Mainstay
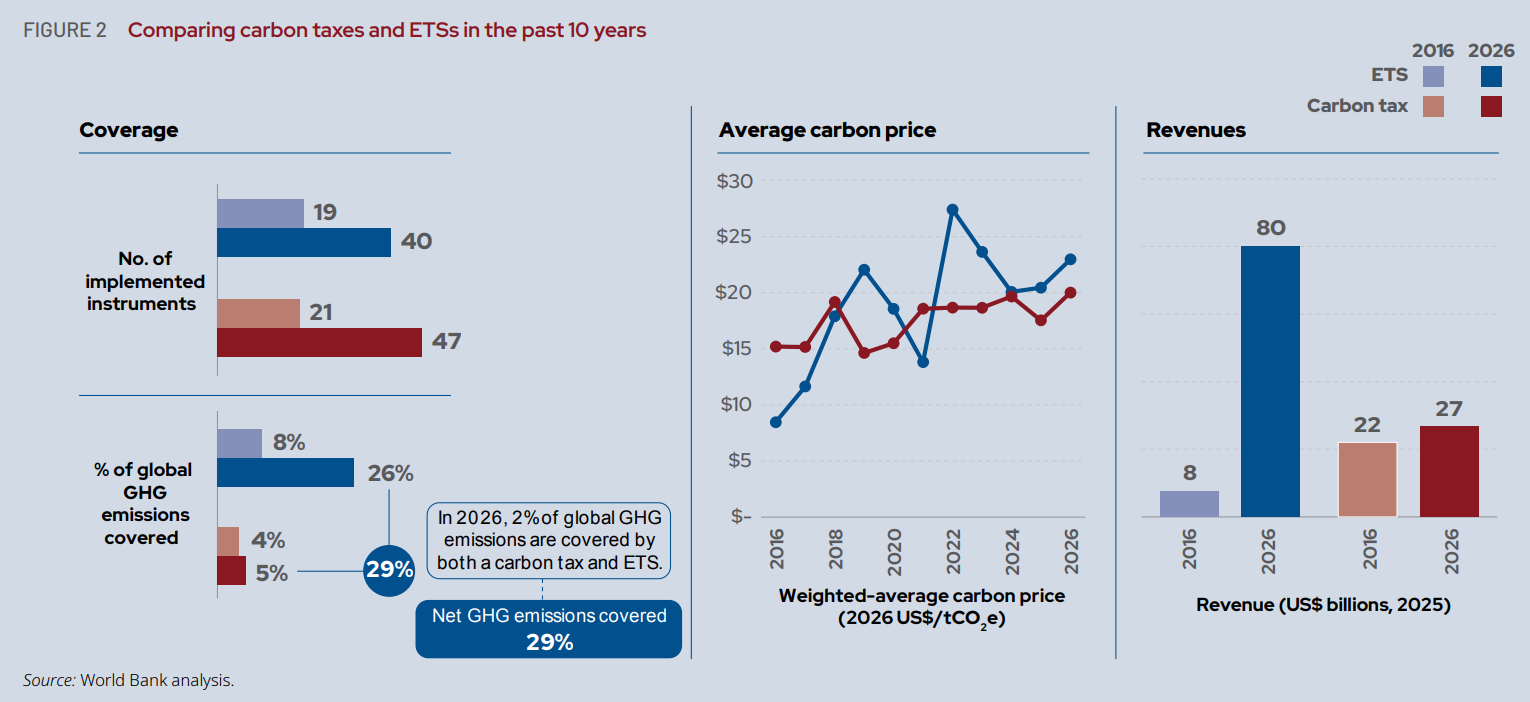
Direct carbon pricing now covers 29% of global greenhouse gas (GHG) emissions as of April 1, 2026. This coverage comes from 87 implemented policies worldwide. These policies include both carbon taxes and emissions trading systems, which are the two main tools used in carbon pricing today.
The report states that there are:
- 47 carbon taxes
- 40 emissions trading systems (ETSs)
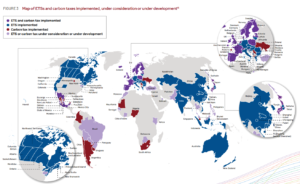
In the past 12 months, five new national-level instruments were introduced. These include India’s CCTS, Japan’s GX-ETS, Viet Nam’s ETS, and carbon taxes in Mauritania and Serbia. These additions show that carbon pricing is spreading beyond advanced economies into emerging and developing regions.
The report says that if current policies are fully put in place, global coverage might reach almost one-third of global emissions by 2030. This shows ongoing growth, but progress relies on national policies and how quickly they’re put into action.
Carbon Prices Rise, but Policy Direction Differs Across Countries
Carbon prices have increased steadily over the past decade. The report reveals that the average carbon price has doubled. It went from $10 per ton of CO₂e in 2016 to almost $21 per ton in 2026. This long-term increase reflects broader adoption and gradual tightening of climate policy frameworks.
In the most recent year, prices also moved upward. The average carbon price increased by more than 7% since April 2025, showing continued momentum in several jurisdictions.
However, price changes are not uniform. Different countries have taken different policy paths. Some have raised prices significantly, while others have reduced or paused them.
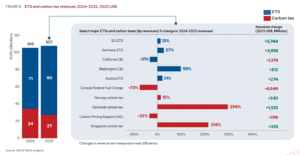
- Singapore increased its carbon tax by 80% in 2026
- South Africa increased its carbon tax by 31%
- Canada reduced its federal fuel charge to zero from April 1, 2025
These contrasting movements highlight that carbon pricing is still politically sensitive. While some governments are strengthening pricing signals, others are adjusting policies based on economic or political considerations. As a result, global carbon price levels remain highly uneven.
Carbon Pricing Revenues Remain Strong and Above US$100 Billion
Carbon pricing continues to generate large-scale public revenue. In 2025, total global revenues from ETSs and carbon taxes reached over $107 billion, marking an increase of about 2% from 2024.
These revenues come from two main sources:
- ETSs generated over $80 billion, and
- Carbon taxes generated about $27 billion.
Importantly, the report confirms that carbon pricing revenues have remained above $100 billion every year in real terms since 2021. This indicates that carbon pricing is now a stable fiscal instrument, not only a climate policy tool.
The use of these revenues varies by country. Some governments recycle funds into households or businesses. Others direct revenues toward climate investment, clean energy development, or general budgets. The report does not assign a single global pattern but shows that revenue use is becoming a key feature of carbon pricing systems.
Major National Systems Continue to Anchor Global Market
Large national and regional systems continue to play a central role in global carbon pricing. India’s CCTS now covers:
- 7 sectors,
- 490 industries, and
- Approximately 477 million tCO₂e.
Meanwhile, Japan’s GX-ETS includes:
- Over 700 companies,
- More than 50 percent of national emissions, and
- Around 524 million tCO₂e.
The report also notes that larger systems such as China’s national ETS, the EU ETS, and the Republic of Korea ETS still cover more emissions in absolute terms than India’s or Japan’s systems. These systems remain the largest anchors of global carbon pricing coverage due to their scale and maturity.
Together, these systems show how carbon pricing is becoming common in major industrial economies, while newer systems are expanding coverage in emerging markets.
Carbon Credit Markets Expand, but Fragmentation Deepens
Carbon credit markets continued to expand in 2025, but trends were mixed across different segments, per the World Bank’s report.
Overall carbon credit issuances increased by 8% from 2024 to 2025, amounting to 432 million credits. Over the past decade, the number of governmental crediting mechanisms rose from 24 to 34, showing long-term institutional growth.
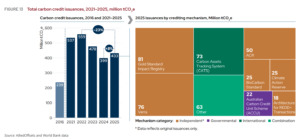
Independent crediting mechanisms still dominate the market and make up around 70% of total issuance. However, their issuance volumes dropped by about 4% over the past year.
Retirements of carbon credits also declined. They fell by more than 10% from 2024 to 2025, suggesting slower demand in some parts of the market. Despite this, voluntary retirements still made up of 82% of total retirements in 2025, showing continued activity in voluntary climate action.
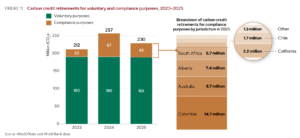
A key development is the growth in forward-looking market activity. Offtake agreements for future carbon credits reached $12 billion in 2025, which is about three times the 2024 level. This suggests stronger expectations for future supply and demand, even as current retirements slowed.
Prices and Quality Differences Define a Fragmented Market
Carbon credit prices vary widely depending on type, eligibility, and quality.
From September 2025 onward, CORSIA-eligible credits traded between $15 and $22 per ton of CO₂e, making them one of the highest-priced categories in the market. In contrast, most other credit types traded between $1 and $14 per ton.
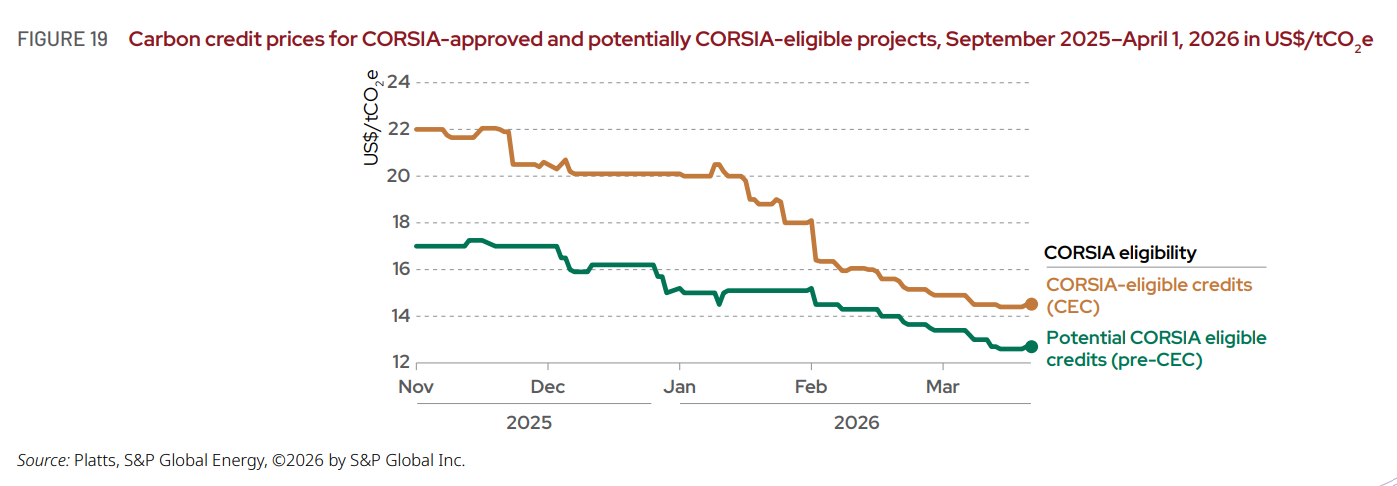
This gap reflects big differences in perceived quality and compliance value. The report shows that credits with better ratings and integrity labels often get price premiums. This means buyers are ready to pay more for higher-quality units.
These differences show that the carbon credit market is not unified. Instead, it is segmented into multiple price tiers, depending on credibility, usage rules, and demand conditions. This fragmentation remains one of the key structural features of the market in 2026.
Expansion Continues, but Uneven Systems Persist
The World Bank’s 2026 report shows that carbon pricing is steadily expanding in scope, revenue, and market participation. Nearly one-third of global emissions are now covered by direct pricing systems, and annual revenues remain above $100 billion.
At the same time, the system remains uneven. Prices differ widely across countries, and policy directions are not fully aligned. Carbon credit markets also remain fragmented, with clear gaps between higher-quality and lower-quality segments.
Overall, carbon pricing continues to grow as a key climate policy tool. However, the report highlights that consistency, broader coverage, and improved market alignment are still ongoing challenges for global systems.