Carbon capture and storage (CCS) is gaining momentum as an important solution for reducing global carbon emissions. With significant projects like Gevo’s $1.46 billion Net-Zero 1 plant in South Dakota and a surge in CCS developments worldwide, the industry is expanding rapidly.
Gevo’s Groundbreaking SAF Plant
Gevo Inc., a Colorado-based alternative fuels company, has been offered a $1.46 billion loan by the U.S. Department of Energy (DOE) to build a “clean” fuels plant in eastern South Dakota that captures carbon emissions.
The facility, named Net-Zero 1, aims to produce sustainable aviation fuel (SAF), renewable diesel, and renewable naphtha using corn feedstock in Lake Preston. The plant aims to produce SAF while incorporating carbon-negative production processes to offset tailpipe emissions.
SAF refers to a broad category of biofuels and synthetic fuels intended to replace conventional jet fuel. These fuels still produce tailpipe emissions, but they are counterbalanced by a carbon-negative production process.
Gevo has taken a significant step towards expanding its carbon capture and storage capabilities by acquiring Red Trail Energy LLC’s ethanol plant and associated carbon capture and storage (CCS) assets in North Dakota last month. Valued at $210 million, this acquisition supports Gevo’s ambitious plans to establish Net Zero-1.
The Richardton, North Dakota facility, brings critical assets to Gevo’s strategy, especially its permitted CO2 storage infrastructure. This site is capable of storing up to 1 million metric tons of CO2 annually, though Red Trail has only used less than 20% of this capacity so far.
Net-Zero 1 would be the first SAF facility of its kind in the U.S., as noted by the DOE. The conditional loan was one of two announced on the same day; the other, worth $1.44 billion, was offered to Montana Renewables for expanding a renewable fuels plant in Great Falls.
Gevo expects to close the deal in 2025, with third-party project equity making up most of the project’s funding.
The company has partnered with Summit Carbon Solutions, which is developing a pipeline to transport the captured CO2 to a storage site in North Dakota, to manage its carbon emissions.
With capitalized interest during construction, the loan guarantee could provide Gevo with a borrowing capacity of $1.63 billion. The said financing is subject to specific conditions and an environmental review by the DOE.
Global Growth and Trends in Carbon Capture Projects
Globally, the CCS landscape is seeing a significant expansion, according to the Global CCS Institute report. The think tank’s 2024 annual status update highlights a notable increase in projects worldwide, with 291 CCS projects in advanced development or under construction as of mid-2024.
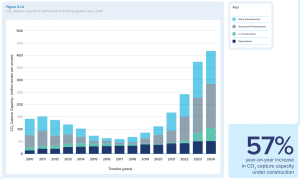
This figure represents a substantial growth from 147 projects in mid-2023. It shows the rising momentum of CCS technology as governments across the globe implement policies to combat climate change. There are now 50 operational CCS projects worldwide, but the majority remain in the design and permitting stages.
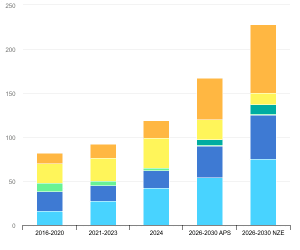
The total CO2 capture capacity of these projects has also increased, growing from 177 million metric tons annually in 2023 to 231 million metric tons by mid-2024. However, this growth comes despite setbacks, including several high-profile cancellations.
For instance, Navigator CO2 Ventures recently scrapped plans for a 1,300-mile CO2 pipeline in the U.S. Midwest. The reason for this is the challenges faced in securing state permits.
Still, government incentives, such as federal tax credits for CCS, have been instrumental in driving new projects in the US. Currently, 13 CCS projects are under construction, primarily associated with hydrogen, ammonia, and ethanol production facilities, which are often easier to retrofit with CCS technology.
Moreover, a growing number of direct air capture (DAC) projects are in development, catering to the increasing demand for carbon credits. These credits are seen as more easily verifiable than those from traditional carbon capture methods.
Government subsidies and supportive regulations have played a crucial role in boosting CCS deployment.
The Global CCS Institute’s report emphasizes the need for continued public funding. Without a price on CO2 or mandatory capture regulations, many CCS projects may struggle to remain financially viable. The case of Alcoa Corporation is an example of this.
A Push for CO2 Compensation
Alcoa Corporation is pursuing $80 million in CO2 compensation from the Spanish government, seeking reimbursement for carbon-related costs incurred between 2018 and 2021 at its San Ciprian aluminum and alumina production complex.
The compensation is critical for Alcoa as it faces increasing competitive pressure in the European market. Its neighboring countries like France offer significant carbon credits and subsidies to support smelters. These subsidies make French operations more viable compared to those in Spain.
CEO William Oplinger echoed the need for equal support to ensure the competitiveness of Alcoa’s operations in Spain.
The Pittsburgh-based company’s challenges in Spain extend beyond the lack of CO2 compensation. It is also working on a strategic cooperation agreement with Ignis Equity Holdings to secure the future of the San Ciprian complex. Under this agreement, Ignis will invest €25 million for a 25% stake in the facility, while Alcoa commits €75 million to ongoing operations.
Additionally, Alcoa seeks access to around $85 million in restricted cash controlled by unions at the site to help cover operating expenses.
These ongoing developments in carbon capture across companies and countries underscore both the opportunities and challenges facing the sector. As more projects move from planning to execution, the potential of CCS to play a critical role in achieving climate targets becomes increasingly clear.


 Source: IEA


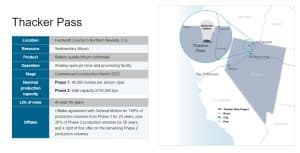 Source: Lithium Americas