Elon Musk’s SpaceX Eyes Solar Data Centers in Space to Power the AI Boom

SpaceX has asked US regulators to approve a new satellite system that would act like a large, space-based computing network. Several outlets report that SpaceX filed a request with the US Federal Communications Commission (FCC) for an โ€œorbital data centerโ€ constellation. This could include up to one million satellites in low Earth orbit, powered mainly by solar energy and connected using laser links.

The idea is simple. Instead of building more data centers on land, SpaceX would place computing hardware in orbit and run it on sunlight. The system would then handle heavy computing tasks, including AI workloads, without drawing electricity from local grids on Earth.

AI Is Pushing Power Systems to the Edge

The scale is what makes the proposal unusual. Today, there are roughly 15,000 satellites in orbit, and reports say more than 9,600 are active Starlink satellites. A one-million-satellite โ€œdata centerโ€ network would be far larger than anything proposed so far.

However, the โ€œone millionโ€ figure appears in reporting tied to the FCC filing, but regulators have not yet approved the plan. Several analysts and engineers quoted in coverage also treat the number as a maximum request, not a final build plan.

The FCC filing stated:

“By directly harnessing near constant solar power with little operating or maintenance costs, these satellites will achieve transformative cost and energy efficiency while significantly reducing the environmental impact associated with terrestrial data centers.”

SpaceXโ€™s proposal arrives during a period of fast growth in computing demand. The International Energy Agency (IEA) estimates that data centers consumed about 415 terawatt-hours (TWh) of electricity in 2024. This is roughly 1.5% of global electricity use. Demand has grown by around 12% each year for the last five years.

Older IEA work also highlighted how quickly demand can rise. One IEA scenario noted that data centers consumed 460 TWh in 2022. In a worst-case situation, this could exceed 1,000 TWh by 2026. The increase depends on trends in AI, crypto, and efficiency.
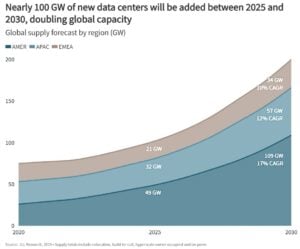
AI data center energy GW 2030

This demand growth has significant effects on power systems. Utilities, cities, and local communities often push back when new large data centers arrive. The concerns include higher power demand, water use for cooling, and land use. Thus, SpaceX and Elon Musk have framed space-based computing as a way to reduce pressure on Earthโ€™s power grids.

That is where renewables enter the story. Globally, clean energy investment is already rising fast. The IEA said total global energy investment exceeded US$ 3 trillion in 2024, with around US$ 2 trillion going to clean energy technologies and infrastructure. BloombergNEF reported that clean energy investment reached $2.3 trillion in 2025.

Why Space Looks Tempting for Energy-Hungry AI

Space has one obvious advantage: sunlight is steady above the clouds. Solar panels in orbit can receive strong sunlight for long periods, depending on their orbit and design.

SpaceXโ€™s pitch, as described in reporting, leans on that idea: a solar-powered platform in orbit could run without fuel deliveries and without drawing power from Earthโ€™s grid.

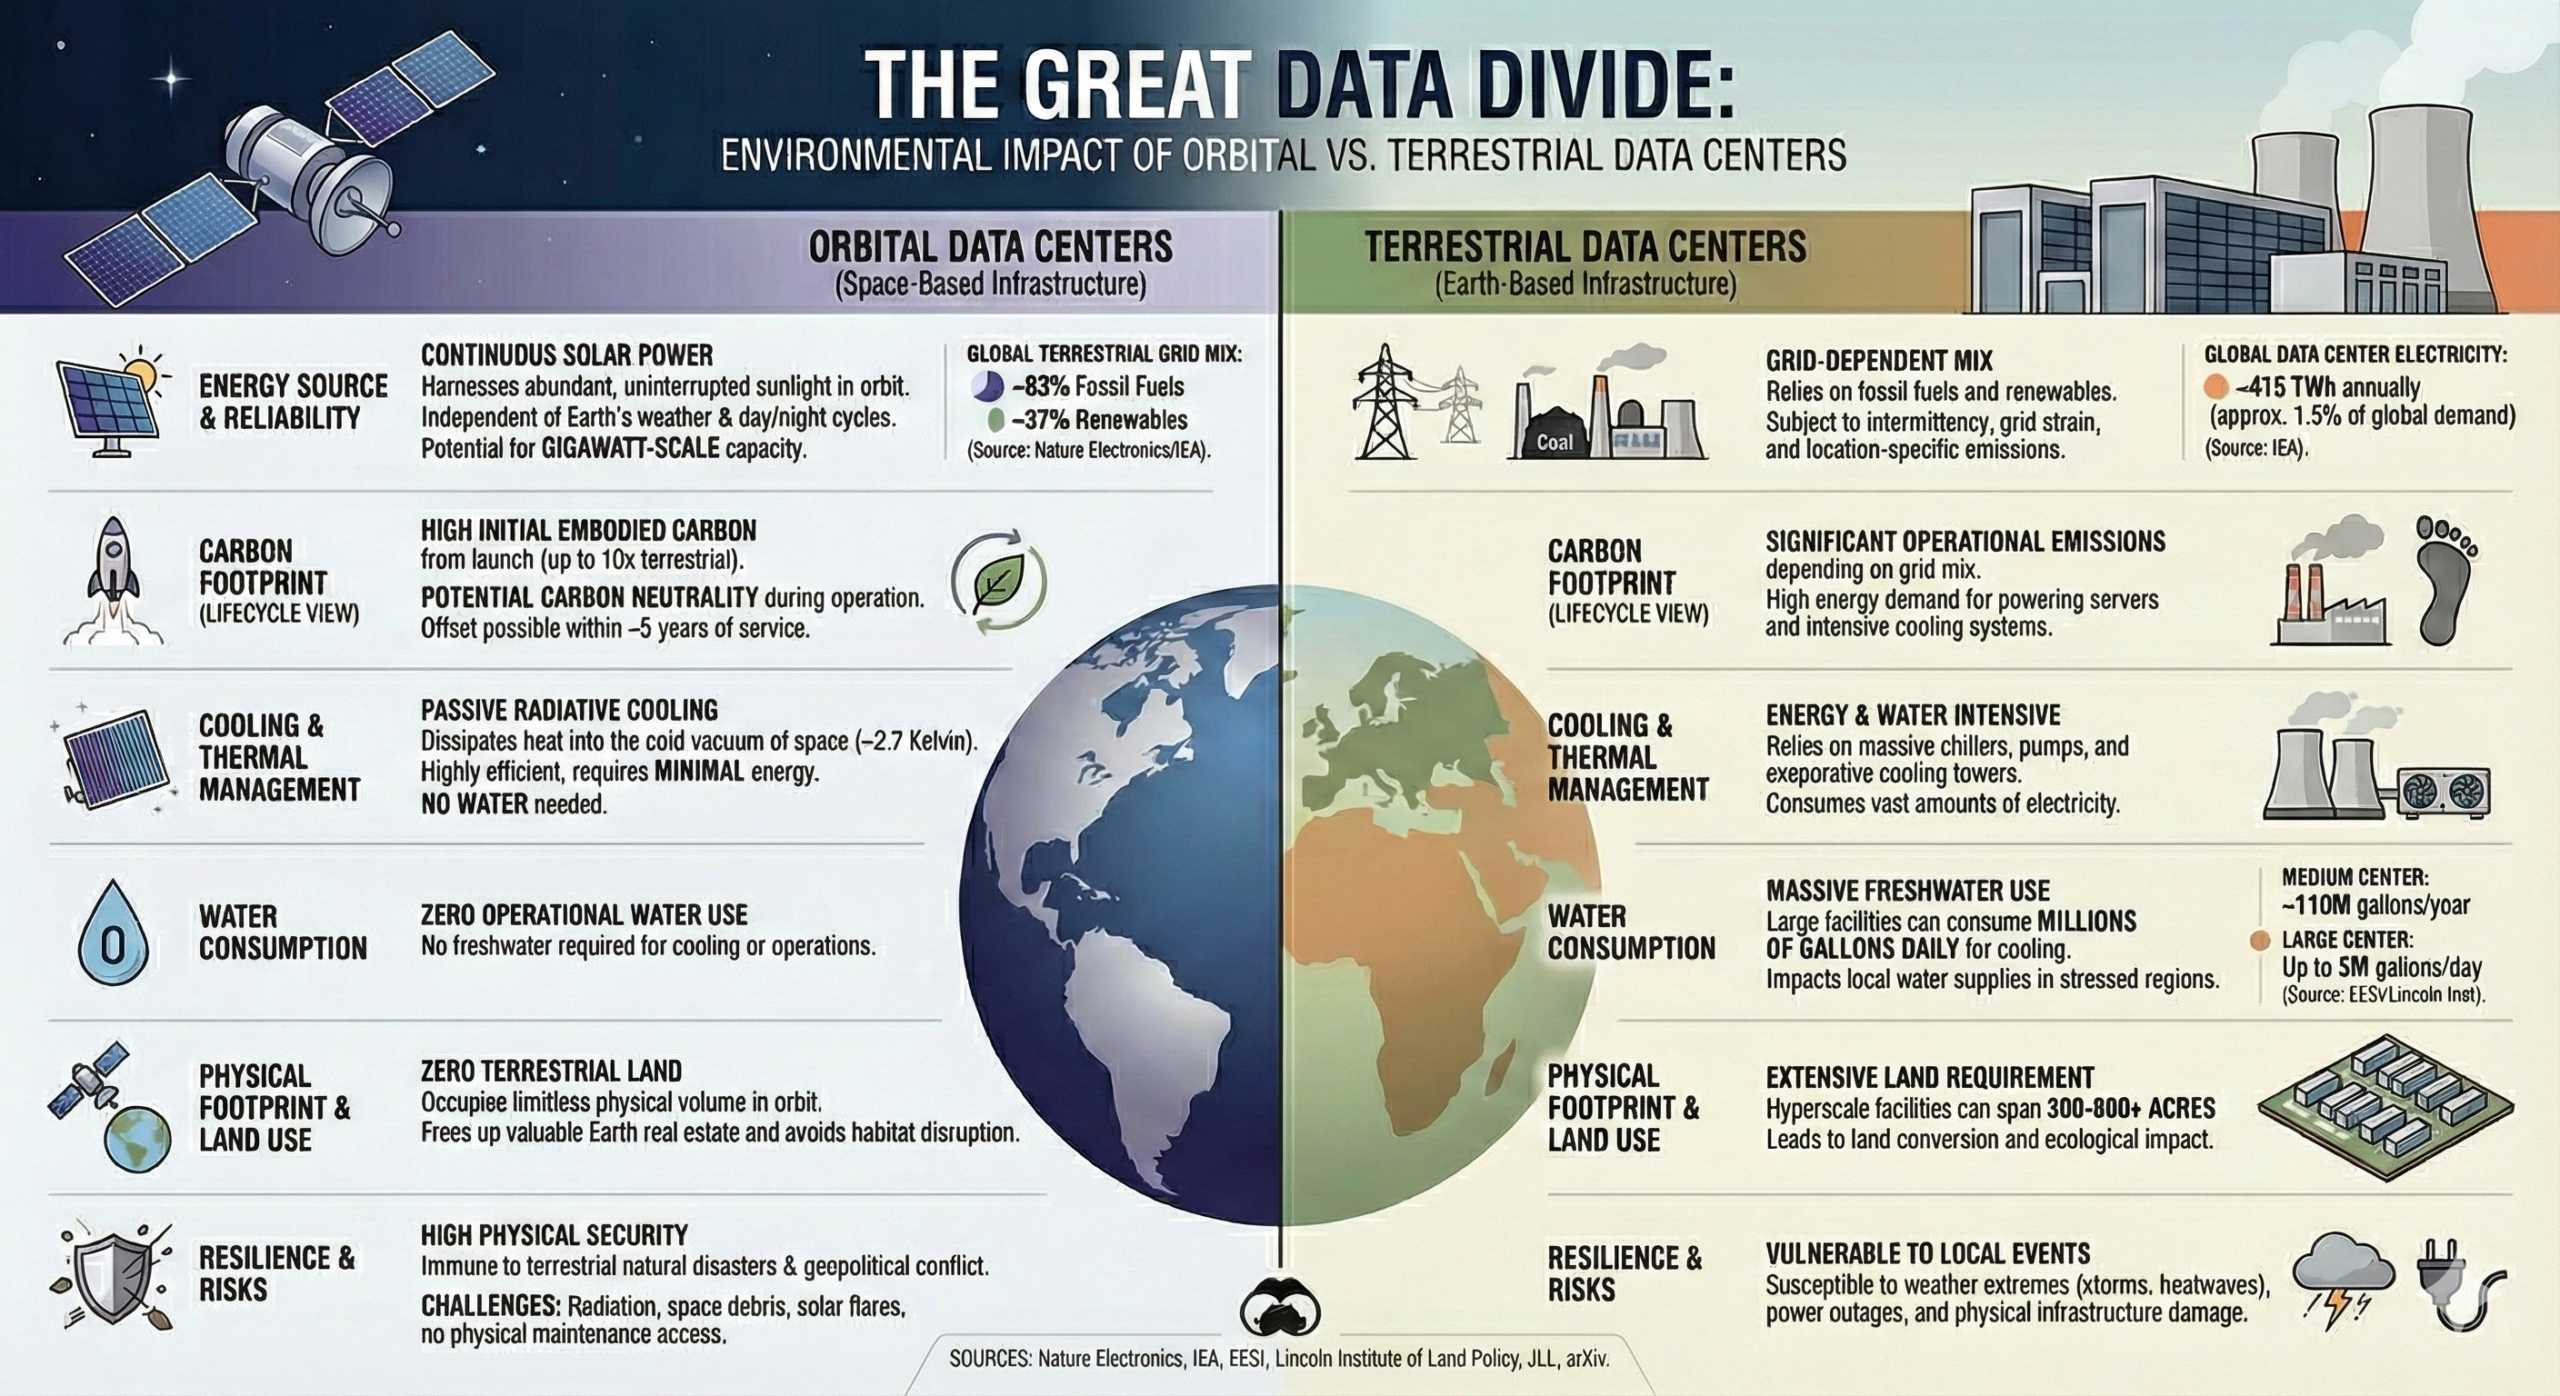
Orbital data center infographic. Environmental impact of orbital and terrestrial data centers

Orbital compute could also reduce โ€œlatencyโ€ for some tasks in theory. If a user needs fast responses across large regions, satellites can route data without depending on ground networks in certain cases. SpaceX already uses laser links across Starlink satellites for routing. That experience may be part of the logic for a computing-focused network.

Space also avoids some land-based constraints. On Earth, data centers need large sites, grid connections, and cooling systems. SpaceX and supporters argue that orbit may reduce some land and water issues, at least in principle.

Recent market analysis shows the orbital data center market is set for quick growth. This is due to the rising demand for AI computing and energy limits on Earth. Analysts expect the orbital data center market to rise from around US$ 1.77 billion in 2029 to nearly US$ 39.1 billion by 2035, a compound annual growth rate of about 67.4%.
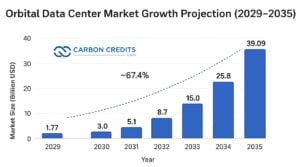
orbital data center market growth 2035

The surge comes from several factors. These include prototype satellite launches, solar-powered compute ideas, and interest from companies like Google, Nvidia, and SpaceX.

However, the advantages offered by space do not remove the biggest engineering problems.

The Hard Parts: Physics, Maintenance, and the Messy Reality of Orbit

A major challenge for computers in space is waste heat. Computer chips turn much of their electricity into heat. On Earth, air and water systems carry heat away. In space, there is no air. Objects mainly lose heat through radiation, which can require large radiator surfaces.

That is why experts have raised doubts and concerns, including:

  • Heat management: Space is a vacuum, not a cooling system. Hardware can trap heat, so large radiator systems are needed to release waste heat at scale.
  • Maintenance limits: Data center hardware fails often. In orbit, repairs are difficult and costly, and sending crews is not yet practical today.
  • Orbital congestion: A very large satellite network would raise collision risks and space debris concerns, including the risk of cascading failures known as Kessler syndrome.
  • Cost and launches: Building and deploying systems at this scale would require massive launch capacity and very high upfront costs, even with low-cost rockets.

These constraints do not mean orbital data centers are impossible. But they explain why most experts treat this as an early-stage concept rather than a near-term build plan.

A Signal of Stress in the AIโ€“Energy Equation

Even if SpaceX never launches a million satellites, the proposal highlights a key issue. The AI boom is driving up electricity demand. Energy planners are now looking for new ways to supply and use energy more efficiently.

The IEAโ€™s data shows the scale of the challenge. With data centers already at about 415 TWh in 2024, even modest growth adds large new loads to power systems.

On the supply side, the global investment trend favors clean energy. The IEA expects clean energy technologies and infrastructure to take over US$ 2 trillion of global investment in 2025, larger than total spending on oil, gas, and coal.

global clean energy investment 2025 by IEA

This sets up two parallel paths:

  • First, most near-term data center growth will stay on Earth. That means grids, renewables procurement, storage, and efficiency standards will do the bulk of the work.
  • Second, a smaller group of companies may test space-based power or computing systems.

Beyond SpaceX, several other firms are exploring solar-powered orbital computing. Starcloud has already launched a satellite with an NVIDIA GPU to test high-performance computing in orbit, backed by seed funding and solar panel grids to power large data loads.

Axiom Space plans to send orbital data center modules to the ISS by 2027, while Googleโ€™s Project Suncatcher aims to power AI workloads via solar satellites. Chinaโ€™s ADA Space is developing a constellation of thousands of AI-enabled satellites.

SpaceXโ€™s filing has also drawn attention to other efforts and interest in space-based energy and computing concepts, even if the timelines remain uncertain.

For now, its proposal highlights how quickly the search for new computing and energy models is expanding beyond Earth. Orbital data centers remain early in development, but they reflect growing interest in pairing constant solar power with high-density computing at scale.

As launch costs drop and space technology improves, orbital systems may become a good alternative to ground-based data centers. This is especially true for energy-heavy tasks. The idea signals a longer-term shift in how and where digital infrastructure may be built.

EU Sets Global Benchmark for Permanent Carbon Removals and Carbon Farming

The European Union (EU) has taken a major step toward climate neutrality. The European Commission adopted the first certification methodologies under the Carbon Removals and Carbon Farming (CRCF) Regulation. These rules define how projects that permanently remove carbon dioxide from the atmosphere can be verified and certified across Europe.

Wopke Hoekstra, European Commissioner for Climate, Net-Zero and Clean Growth, stated,

โ€œThe European Union is taking decisive action to lead the global effort in carbon removals. By establishing clear, robust voluntary standards, we are not only fostering responsible and climate action within Europe but also setting a global benchmark for others to follow. This is a vital step toward achieving our climate neutrality targets and ensuring a sustainable future.โ€

Why Certification Is Critical for Carbon Markets

Carbon removals are key to meeting climate goals. Even with big emission cuts, some sectors will still release greenhouse gases, and removals can offset them.

Trust is crucial. Without clear rules, companies could overstate their climate claims, investors may hesitate, and policymakers risk losing confidence. The CRCF methodologies solve this by defining how to measure removals, ensure permanence, and manage risks. This builds credibility and reduces greenwashing.

The CRCF Regulation creates the EUโ€™s first voluntary system to certify carbon removals, carbon farming, and carbon storage in bio-based products. It sets clear rules for what counts as a verified tonne, how to keep it permanent, and how to handle risks.

By turning carbon removals into a structured market, the framework supports innovation, attracts investment, and strengthens the EUโ€™s path to net zero by 2050.

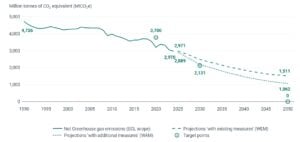
Progress towards achieving climate targets in the EU-27

Europe emissions
Source: EU

Three Carbon Removal Technologies Covered

The news release revealed that the Commission selected three carbon removal pathways for the first certification methodologies. These technologies are mature and can scale in the near term.

  1. Direct Air Capture with Carbon Storage (DACCS)

DACCS removes COโ‚‚ directly from ambient air. Machines capture COโ‚‚ and store it underground in geological formations. This approach is highly permanent because the COโ‚‚ stays locked away for thousands of years.

DACCS is expensive today, but it has strong long-term potential. Clear certification rules could accelerate private investment and government support.
  1. Biogenic Carbon Capture and Storage (BioCCS)
BioCCS captures COโ‚‚ from biomass-based processes, such as bioenergy plants. Since plants absorb COโ‚‚ as they grow, capturing and storing emissions can result in net negative emissions.

This pathway could help industries decarbonize while producing energy or materials.

  1. Biochar Carbon Removal (BCR)

Biochar is a stable form of carbon produced by heating biomass in low-oxygen conditions. When applied to soil, biochar can store carbon for centuries and improve soil health.

This method links climate mitigation with agriculture and soil restoration.

From Policy Design to Real Project Deployment

With the certification framework in place, carbon removal projects can now apply for EU certification. This marks a shift from rule-setting to real-world implementation.

Certification schemes must apply for recognition by the European Commission. The Commission will assess them using a standardized protocol that checks compliance with EU climate rules and audit standards.

Once certified, projects can issue verified carbon removal credits. These credits could attract corporate buyers, governments, and financial institutions that want high-quality climate offsets.

Upcoming Rules for Carbon Farming and Bio-Based Construction

The Commission plans two additional delegated regulations by 2026. These will expand the CRCF framework beyond industrial carbon removals.

One regulation will cover carbon farming practices such as improved agricultural methods, agroforestry, peatland rewetting, and afforestation. These rules could allow farmers and foresters to earn payments for storing carbon, helping them diversify income and adopt resilient practices.

Another regulation will cover carbon storage in bio-based construction materials. This will help building owners prove the carbon storage performance of buildings and encourage the use of circular bioeconomy materials in construction.

EU Buyersโ€™ Club and Funding Support

To jumpstart the voluntary carbon removal market, the Commission announced an EU Buyersโ€™ Club. This initiative will connect buyers with certified carbon removal projects and help create early demand.

The EU is also exploring ways to mobilize public and private finance. Existing funding tools such as the European Innovation Council and the Innovation Fund already support innovative carbon removal technologies.

Together, policy support and financing could accelerate the deployment of carbon removal solutions across Europe.

Governance, Audits, and Transparency

The CRCF framework builds on earlier EU rules that define certification bodies, audit procedures, and governance structures. Certification schemes must meet strict requirements for quantification, permanence, and sustainability.

The methodologies were developed with input from the Carbon Removal Expert Group. All preparation documents and meeting recordings are publicly available, which improves transparency and trust.

This governance structure aims to ensure environmental integrity while keeping administrative complexity manageable.

Carbon Removals and the EUโ€™s Net Zero Strategy

The EUโ€™s goal of climate neutrality by 2050 is legally binding under the European Climate Law. Carbon removals play a critical role in reaching this target because some emissions are hard to eliminate.

The CRCF framework aligns with the European Green Deal and the EUโ€™s commitments under the Paris Agreement. It also supports the EUโ€™s long-term climate strategy submitted to the United Nations.

Emissions Trends Highlight the Challenge Ahead

Recent data shows the difficulty of balancing economic growth and emissions reduction. EU greenhouse gas emissions reached about 900 million tonnes of COโ‚‚-equivalent in the first quarter of 2025, up 3.4 percent from the previous year. During the same period, GDP grew by 1.2 percent.

EU emissions
Source: EU

This shows that economic activity can still drive emissions upward, even with climate policies in place. The EU Emissions Trading System has helped reduce emissions from power and industry by 51 percent since 2005. However, aviation emissions have rebounded close to pre-pandemic levels.

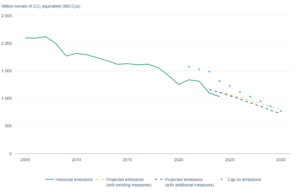
The EU aims to cut ETS-covered emissions by 62 percent by 2030 compared to 2005. Carbon removals will complement these policies and help close the remaining gap to net zero.

Fig: Historical and projected emissions from stationary installations covered by the EU Emissions Trading System in the European Economic Area

EU EMISSIONS EU net zero
Source: EU

What This Means for Industry and Investors

The CRCF methodologies create a structured market for carbon removals. This could attract startups, large companies, and institutional investors. To summarize:

  • Certified carbon removals provide high-quality offsets for net-zero strategies and reduce reputational risk for companies.
  • Clear rules reduce uncertainty and improve project evaluation for investors.
  • The framework provides a scalable tool for responsibly managing negative emissions for policymakers.

Despite progress, challenges remain. Carbon removal technologies are still expensive and require large infrastructure investments. Long-term liability for stored COโ‚‚ remains complex and requires legal clarity. Demand for carbon removals is still uncertain, especially outside voluntary markets.

However, the CRCF framework provides a strong foundation for addressing these issues and building a credible market.

Final Take: A Global Benchmark for Carbon Removals

The EUโ€™s move positions it as a global leader in carbon removal governance. Only a few regions have such detailed certification rules. Other countries may adopt similar frameworks, and global standards could emerge.

TotalEnergies Inks Deal with SWM for 10-Year, 800 GWh Renewable Energy Deal

TotalEnergies signed a 10-year deal to supply 800 GWh of renewable electricity to SWM International. SWM is a big paper maker in France. The contract began in January 2026 and will cover electricity for three industrial sites over a decade. This deal marks another step in TotalEnergiesโ€™ push to expand its clean power business and help heavy industries reduce carbon emissions.

Under the agreement, TotalEnergies will deliver renewable electricity with a stable output profile, also known as clean firm power. This means SWM will receive low-carbon electricity that meets its energy needs around the clock. The supply will come from around 50 megawatts (MW) of renewable energy assets that TotalEnergies already has in France.

SWM says the deal will provide about half of its electricity needs in France and strengthen its plan to cut Scope 1 and Scope 2 emissions by 2033. The long-term contract also gives SWM better cost predictability and support for its decarbonization goals.

Giuliano Scilio, SWMโ€™s Vice President and Chief Information Officer, stated in the release:

“For an energy-intensive industry like ours, this isnโ€™t just an environmental milestone; itโ€™s a strategic investment that gives us cost predictability and strengthens our ability to offer customers genuinely sustainable solutions.”

TotalEnergiesโ€™ Clean Energy Strategy

TotalEnergies has been expanding its renewable power business in recent years. The company blends renewable sources, like solar and wind, with flexible assets. These include gas turbines and storage.

This way, the oil giant provides customized clean energy solutions for industrial and corporate clients. These solutions are known as โ€œClean Firm Power.โ€ They provide stable, low-carbon electricity that meets demand all day long.

As of late October 2025, TotalEnergies had more than 32 gigawatts (GW) of installed gross renewable electricity capacity. The company plans to hit 35 GW by the end of 2025. By 2030, it aims to generate over 100 terawatt-hours (TWh) of net electricity. This will include renewable and flexible power sources.

This clean power offering is part of a broader shift within TotalEnergies. The company is moving beyond its traditional oil and gas business to build a diverse portfolio of energy solutions. These include renewables, low-carbon hydrogen, biofuels, and electricity contracts. They help industrial clients meet climate goals while keeping operations reliable.

Big Deals, Big Impact

The SWM deal adds to the clean power contracts TotalEnergies has signed with big companies.

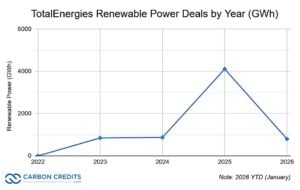
TotalEnergies Renewable Power Deals by Year

The chart shows TotalEnergiesโ€™ clean power deals from 2020 to 2026. Between 2020 and 2022, no large renewable contracts were publicly announced. Deals started increasing in 2023 with 850โ€ฏGWh, then grew sharply in 2024 and 2025. Data for 2026 includes only this SWM deal.

In November 2025, TotalEnergies signed a 10-year deal to provide 610 GWh of renewable electricity to Data4. This contract begins in January 2026 and supports a European data center operator in Spain. This energy comes from wind and solar farms in Spain. It shows the rising need for clean power in digital infrastructure.

The oil major also signed a renewable electricity deal with Saint-Gobain. This agreement covers 875 GWh over five years, starting in 2026. It supports industrial decarbonization in France.

In December 2025, the company made a 21-year renewable power deal with Google. This agreement will provide 1 terawatt-hour (1 TWh) of certified renewable energy from a solar plant in Malaysia. This deal supports Googleโ€™s data-centre energy needs and renewable targets in Southeast Asia.

Taken together, these contracts show TotalEnergiesโ€™ growing role as a supplier of long-term clean energy to major corporate and industrial customers.

Why This Deal Matters for Industry Decarbonization

Long-term renewable power contracts like the SWM deal are important for several reasons:

  • Emission reductions:ย 

Renewable power deals help companies reduce their Scopeโ€ฏ1 and Scopeโ€ฏ2 greenhouse gas emissions. Scopeโ€ฏ1 covers direct emissions from operations. Scopeโ€ฏ2 includes emissions from purchased electricity.

By securing renewable electricity, SWM expects to cut these emissions significantly on its way to netโ€‘zero goals. In the SWM case, the clean power deal covers about half of its electricity needs and supports its target to reduce emissions by 2033.

  • Growing corporate demand:

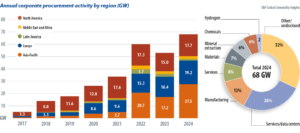
Global corporate demand for clean energy continues to rise. In 2024, companies worldwide signed record volumes of renewable power purchase agreements (PPAs), with around 68โ€ฏGW of deals announced. This was about 29% growth from the year before. Data centers, manufacturers, and heavy industries are some of the largest buyers of renewable energy.

  • Stable costs:

Longโ€‘term contracts provide predictable power costs. They help companies plan budgets and capital spending. This is important where electricity prices change quickly or where energy costs are a large part of total expenses.

  • Clean energy growth:

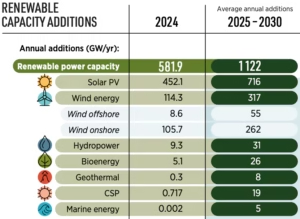
Such power deals support more solar, wind, and lowโ€‘carbon energy on the grid. Across the world, renewable capacity is growing fast. In 2024, renewables accounted for nearly all new power installed, with solar and wind making up about 96% of new capacity. This expansion helps reduce reliance on fossil fuels.

renewable capacity additions 2024
Source: World Economic Forum
  • Reliable power:

Clean firm power mixes renewable generation with flexible resources. This approach helps keep the electricity supply steady even when the sun isnโ€™t shining or the wind isnโ€™t blowing. TotalEnergies designs its contracts this way so heavy industrial users can run without interruptions.

The Growing Market for Clean Power

The market for renewable energy and long-term power contracts continues to grow worldwide. Corporate procurement of renewable energy via power purchase agreements (PPAs) hit record highs recently. The surge came from strong corporate climate commitments. It also rose due to higher electricity demand from data centers and industry.

In 2024, global corporate renewable power purchase agreements reached 68 GW of capacity. Big energy users, such as tech firms, manufacturers, and utilities, want to match their electricity use with clean energy. This growth reflects that demand.

corporate PPAs S&P Global
Source: S&P Global Commodity Insights

By 2030, analysts expect renewable generation capacity to top 5,000 GW globally. Thatโ€™s more than double the levels seen in 2024. Countries and companies are investing in clean energy to hit climate targets and boost energy security.

In this climate landscape, energy companies such as TotalEnergies are becoming integrated power suppliers. Their business model seeks to meet the growing corporate demand for stable, low-carbon electricity. Long-term clean power deals boost investment in new renewable projects. They also provide steady revenue for energy producers.

Providing Clean, Reliable Power to Users Globally

TotalEnergiesโ€™ 10-year, 800 GWh renewable electricity deal with SWM shows the companyโ€™s growing role in clean energy. The deal will help SWM cover half of its electricity needs with low-carbon sources. This supports its decarbonization goals through 2033.

TotalEnergiesโ€™ strategy mixes renewable energy with flexible assets. This approach provides clean, reliable power to industrial users globally. As renewable capacity grows and corporate demand increases, such long-term supply agreements will likely play a larger role in the global energy transition.

China Adds Power 8x More Than the US in 2025, with $500B Energy Build-Out in a Single Year

China closed 2025 with its largest annual expansion of the energy system on record. Investment surged past a symbolic threshold. Power capacity grew at a pace rarely seen in any major economy. Together, the numbers point to a system still in rapid build-out, with renewables at the center and grids struggling to keep up.

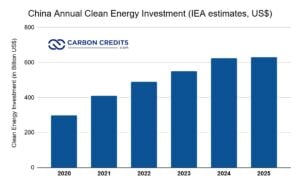
By the end of January 2026, the National Energy Administration (NEA) announced that China’s investment in major energy projects topped 3.5 trillion yuan in 2025, or nearly US$500 billion. This marks an almost 11% rise from the previous year and is the first time Chinaโ€™s annual energy investment has hit that level.

This spending surge coincided with another milestone. By the end of 2025, Chinaโ€™s total installed power generation capacity reached 3.89 terawatts (TW), up 16.1% year on year. No other country added capacity at a comparable scale during the year.

$500B Flows Across the Energy System: Power, Grids, and Security

The NEA described 2025 as a year of broad-based energy investment. Spending increased not only in clean energy but also in grids, coal, and energy security projects.

Renewables absorbed a large share of new capital. China added more than 430 gigawatts (GW) of new wind and solar capacity during the year. This pushed combined installed wind and solar capacity beyond 1.8 TW for the first time. Solar and wind now account for nearly half of Chinaโ€™s total installed power capacity.

Investment in onshore wind rose especially fast. The NEA said spending on key onshore wind projects jumped by almost 50% compared with 2024. Developers focused on large inland bases and projects tied to long-distance transmission lines.

China Annual Clean Energy Investment IEA estimates

Solar continued to expand at an even faster pace. By the end of 2025, Chinaโ€™s installed solar capacity reached 1.20 TW, up 35.4% from a year earlier. This followed another strong year in 2024 and confirmed Chinaโ€™s position as the worldโ€™s largest solar market by a wide margin.

Wind capacity also grew quickly. Total installed wind power reached 640 GW, a 22.9% increase from 2024. Growth came from both onshore projects and steady additions offshore.

At the same time, investment did not shift entirely away from conventional energy. The NEA said spending also increased in coal power, hydropower, and coal mining, reflecting ongoing concerns about power reliability and supply security.

Grid construction remained a priority, particularly projects designed to move electricity from resource-rich western regions to demand centers in the east. Private companies played a larger role in this expansion.

The NEA reported that private-sector investment in major energy projects rose to almost 13% year-on-year. Much of that capital flowed into solar manufacturing, wind development, and coal-related infrastructure.

China’s Capacity Additions in Gigawatt Chunks

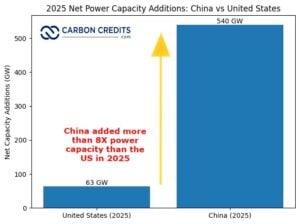
Chinaโ€™s investment surge translated into record growth in installed capacity. At the end of 2024, total power capacity stood at about 3.35 TW. One year later, it had risen to 3.89 TW. This implies net additions of roughly 540 GW in a single year.

That figure reflects capacity from all sources, including renewables, coal, gas, nuclear, and hydropower. While the NEA does not publish a single โ€œnet additionsโ€ number, the difference between year-end totals shows the scale of expansion.

Solar alone accounted for a large share of this growth. Industry data based on official statistics indicate that China added roughly 315 GW of new solar capacity in 2025. Wind additions added another large block, pushing combined wind and solar growth above 430 GW.

This pace of construction is historically unusual. Even during earlier phases of Chinaโ€™s renewable boom, annual additions were far smaller. The 2025 figures show that China is now building new power capacity at a speed measured in hundreds of gigawatts per year, not tens.

By contrast, capacity growth in many other major economies has slowed due to permitting delays, grid constraints, and financing challenges. Chinaโ€™s ability to add large volumes of capacity in a short time reflects its centralized planning, domestic manufacturing base, and strong state-backed financing.

China vs. the United States: A Scale Gap That Keeps Widening

The scale of Chinaโ€™s 2025 build-out becomes clearer when placed in an international context.

In the United States, the Energy Information Administration (EIA) projected about 63 GW of new utility-scale generating capacity additions for 2025 across all technologies. This includes solar, wind, gas, battery storage, and other sources.

Chinaโ€™s wind and solar additions alone, at more than 430 GW, were roughly six to seven times larger than total expected US utility-scale additions for the year. If total net capacity growth is used instead, Chinaโ€™s increase of about 540 GW would be more than eight times the US figure.

China vs United States power capacity additions 2025
Sources: China NEA, US EIA

These comparisons depend on definitions and data sources. Chinaโ€™s numbers are based on year-end installed capacity totals, while the US figure is a forward-looking projection of new builds. Even so, the gap in scale remains large under most reasonable comparisons.

What stands out is not only the size of Chinaโ€™s additions, but their composition. Renewables drove most of the growth. Solar capacity in China alone now exceeds the total installed power capacity of many advanced economies.

When Building Faster Than the Grid Can Absorb

Rapid capacity growth has consequences. One clear signal appeared in power plant utilization data.

In 2025, power plants with a capacity of 6,000 kilowatts and above recorded an average utilization of 3,119 hours. This was 312 hours lower than in 2024. Lower utilization suggests that capacity is growing faster than electricity demand or grid flexibility.

Several factors explain this trend. Wind and solar output vary by weather and time of day. Coal and hydropower plants remain in the system to provide stability, even when renewables generate strongly. In addition, grid bottlenecks can prevent power from reaching where it is needed.

The NEA has repeatedly pointed to grid expansion as a priority. In 2025, major investments went into ultra-high-voltage transmission lines, regional interconnections, and grid digitalization. These projects aim to reduce curtailment and improve the systemโ€™s ability to absorb renewable power.

Still, the utilization figures show the challenge ahead. As capacity continues to rise, grid management and market reform will play a larger role in determining how efficiently new assets are used.

Growth First, Optimization Next

Chinaโ€™s 2025 energy data tell a consistent story. Investment reached a new high. Capacity expanded at a historic pace. Renewables dominated new additions, but conventional power and grids remained part of the strategy.

The numbers also show a system in transition rather than completion. Record build-out has brought new pressures, especially on utilization and grid integration. These issues are likely to shape energy policy decisions in the years ahead.

For now, what stands out most is scale. With energy investment approaching $500 billion and annual capacity additions measured in hundreds of gigawatts, China continues to expand its power system faster than any other country. The 2025 data confirm that this expansion is no longer an exception, but an established pattern.

Amazon, eBay & Etsy Back Tesla Semis: A New Playbook for Zero-Emission Freight

A new initiative involving Amazon, eBay and Etsy is helping bring Tesla electric trucks into real freight operations. The Center for Green Market Activation (GMA), a nonprofit group, is planning a pilot program. This project aims to put about 40 all-electric Tesla Semi trucks on the road between Dallas and Houston. The goal is to reduce emissions from freight transport by using cleaner heavy-duty vehicles.

Under the plan, companies pay for โ€œenvironmental attribute certificatesโ€ (EACs). These certificates represent the emissions savings from electric trucks.

Buyers can use the certificates to reduce their reported Scope 3 emissions. This applies even if they donโ€™t directly use the trucks. All charging for the electric trucks is planned to be covered by renewable energy certificates to support clean power use.

Let’s explore why major online companies are taking part in this system, how Teslaโ€™s Semi vehicles fit in, and what this could mean for decarbonizing freight transport in the United States and even beyond.

Why Freight Is the Next Big Climate Battleground

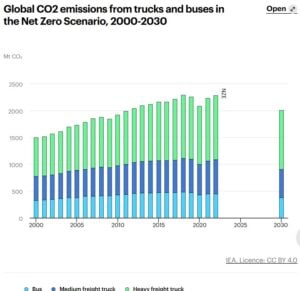
Heavy-duty freight trucks, especially long-haul Class 8 trucks, are a major source of carbon emissions. Traditional diesel trucks burn fossil fuels and produce large amounts of greenhouse gases (GHGs) and air pollutants. They accounted for about 25% of all transport-related CO2ย emissions.

Road freight accounts for a sizeable share of transportation sector emissions worldwide. Recent studies show that decarbonizing road freight is tough. Electric options are few, charging stations are still growing, and initial costs are high.

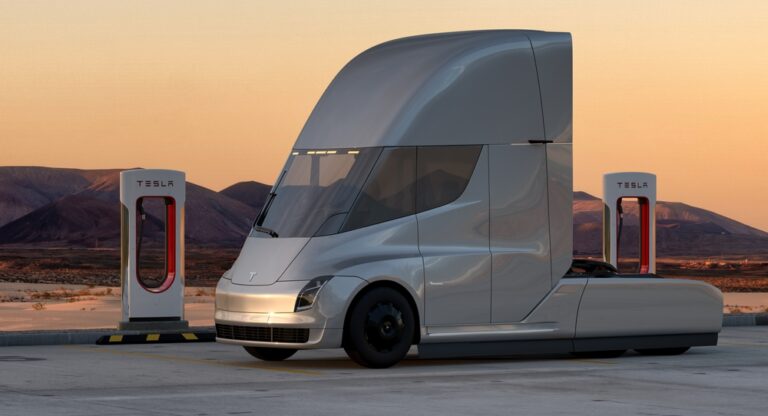
Electric heavy trucks such as the Tesla Semi offer a zero-tailpipe emissions alternative. The Tesla Semi is a battery-electric Class 8 truck designed for freight hauling. It features a battery pack of around 850โ€“900 kWh and an estimated range of about 500 miles (~800 km) per charge on a single route.

The truck uses three electric motors and can operate at around 1.7โ€“2 kWh per mile, making it competitive with diesel trucks over long distances. Planned volume production is expected to begin in 2026.

Tesla Semi specs
Source: Tesla

Using electric trucks like the Semi can cut carbon emissions from freight transport. They may also lower operating costs in the long run. Electricity can cost less per mile than diesel fuel. Also, electric drivetrains have fewer moving mechanical parts, which can cut maintenance costs.

This is crucial as the transport sector needs to adopt zero-emission vehicles much faster to cut emissions by 15% by 2030, per the International Energy Agency Net Zero scenario. This includes electric and hydrogen fuel-cell heavy-duty trucks. To make this happen, more countries must set strong fuel-efficiency rules for heavy trucks and align these standards across regions.

heavy duty truck emissions net zero iEA
Source: IEA

However, electric freight truck adoption faces barriers. Electric heavy trucks are still new, and less than 1% of new heavy-duty trucks in the U.S. are electric. The charging infrastructure for heavy trucks is limited. Also, electric vehicles cost more than regular diesel ones.

What Is Book and Claim? Decarbonizing Freight Without Owning a Truck

The pilot program with Amazon, eBay, and Etsy uses a book-and-claim system. A book-and-claim system divides the environmental benefits of a low-emission product from its physical delivery. It lets companies support decarbonization, even if they can’t use low-emission vehicles directly.

In this case, the environmental attribute certificates represent the emissions savings from operating electric trucks instead of diesel trucks. Participating companies purchase these EACs. They then โ€œretireโ€ them, meaning no one can use the certificate again. This reduction counts toward their climate goals or Scope 3 emissions targets.

This approach is similar to how renewable energy certificates work for electricity. A company can buy certificates for renewable energy generation. This is true even if the actual electricity it uses comes from the grid. The certificates allow buyers to claim the environmental benefits.

Book-and-claim can help scale decarbonization efforts by aggregating demand from many buyers. This pooled demand helps both truck makers and service providers. They have a better reason to invest in electric fleets and charging stations, even if single buyers canโ€™t use trucks on their own routes.

Experts say a clear book-and-claim system with strict rules can help decarbonize transportation. It ensures that emissions savings aren’t double-counted.

How the Pilot Program Works: Miles, Megawatts, and COโ‚‚ Savings

The pilot program is run by the Center for Green Market Activation. This nonprofit aims to speed up climate solutions in supply chains. Under the program:

  • Roughly 40 all-electric trucks are expected to operate on the Dallas-Houston freight route.
  • The trucks will collectively travel up to 7 million miles per year.
  • The trucks save about 60,000 metric tonnes of COโ‚‚ equivalent compared to diesel fleets. This is over the multi-year contracts with buyers.

Amazon, eBay, and Etsy have joined the initiative by purchasing EACs. They will retire the certificates to support their own climate goals and reduce their reported Scope 3 logistics emissions.

All charging for the electric trucks is backed by renewable energy certificates. This means the electricity for powering the truck comes from clean energy, which reduces the carbon footprint of truck operation.

Groups in similar schemes often use book-and-claim. This helps decarbonize sectors with few low-emission options. For instance, sustainable aviation fuel certificates gather demand from airlines and corporate buyers. This helps scale the use of clean fuel.

Why Big Brands Are Buying Clean Freight

Big firms more often set climate goals for their whole value chain, which includes transport emissions. Many emissions are Scope 3. This includes indirect emissions from things like freight transport, business travel, and product use.

Reducing Scope 3 emissions is hard. Companies usually don’t control the sources that create these emissions directly.

Book-and-claim allows companies to access low-emission transport options even if they canโ€™t run them. When companies pool demand, they send a stronger message to manufacturers and carriers. It shows there’s a real market need for clean freight solutions.

Electric trucks, like the Tesla Semi, draw attention because they provide a cleaner option than diesel trucks. They also keep the same freight capacity and range.

Moreover, companies aiming for net-zero and science-based targets are growing. So, the demand for low-emission freight services is likely to increase.

In addition, broader sales of electric heavy vehicles, not just Teslaโ€™s Semi, are rising globally. In China alone, for example, registrations for hybrid and electric trucks reached over 231,000 units in 2025. This was a large increase from the previous year. This trend reflects growing production and adoption of electric freight vehicles worldwide.

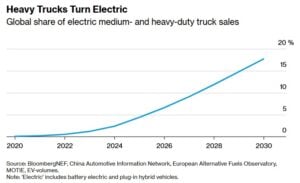
Electric heavy trucks need to become as affordable as diesel trucks to scale widely, according to Bloomberg. Even so, the electric truck market is expected to grow fast, accounting for about 18% of truck sales.

heavy duty electric truck market share 2030

Stronger emissions rules, rising demand for clean freight, and more truck models are driving this growth. In China, electric trucks could make up around 50% of new truck sales by 2028. This shows how quickly the market is changing as costs fall and charging networks expand.

A Blueprint for Scaling Zero-Emission Freight

The new pilot connects Amazon, eBay, Etsy, and Tesla Semi trucks, offering an innovative way to reduce carbon in freight transport.ย Electric heavy-duty trucks, like the Tesla Semi, are nearing mass production, while global sales of electric freight trucks are also rising. Thus, solutions that mix corporate demand, smart accounting, and clean tech could help cut transportation emissions.

This pilot could provide a model for how large buyers and logistics providers work together to accelerate the shift to low-carbon freight systems.

ExxonMobil (XOM) Earnings Dip in 2025, Yet Cash Flow, Dividends, and Low Carbon Strategy Remain Robust

ExxonMobil closed 2025 with strong profits, robust cash generation, and massive shareholder payouts. However, weaker crude prices and soft chemical margins weighed on earnings. The company still reinforced its narrative of being a leaner, more technology-driven oil major with growing exposure to lower-carbon opportunities.

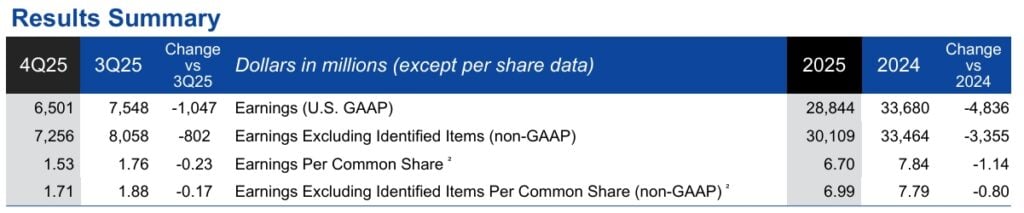
For the full year, ExxonMobil reported $28.8 billion in earnings, down from $33.7 billion in 2024. Despite the decline, the company distributed $37.2 billion to shareholders, highlighting its commitment to capital returns. The results underline Exxonโ€™s strategy: maximize cash from advantaged assets while gradually scaling low-carbon investments.

CEO Darren Woods said the company is structurally stronger than a few years ago, with disciplined capital allocation and resilient earnings power. He also emphasized a long runway of profitable growth through 2030 and beyond.

Exxonโ€™s Financial Performance: Lower Earnings, Strong Cash Flow

ExxonMobil delivered fourth-quarter 2025 earnings of $6.5 billion, or $1.53 per share. Excluding special items, earnings rose to $7.3 billion, or $1.71 per share. The company generated $12.7 billion in operating cash flow and $5.6 billion in free cash flow during the quarter.

For the full year, cash flow from operations reached $52.0 billion, while free cash flow totaled $26.1 billion. ExxonMobil said its operating cash flow has grown at roughly 10% annually since 2019, outperforming many peers.

However, earnings declined due to weaker oil prices, softer chemical margins, higher depreciation, and rising growth-related expenses. Lower interest income also affected results. These headwinds were partly offset by higher production, structural cost savings, and strong refining margins.

exxon xom
Source: Exxon

Capital Efficiency Drive Competitive Edge

Cash capital expenditures reached $29.0 billion in 2025, including acquisitions. Exxon expects to spend $27โ€“$29 billion in 2026, signaling continued investment in upstream growth and energy infrastructure.

As per analysts, Exxon Mobil (XOM) is a strong dividend stock with steady cash flow and high oil production. The company returned billions to shareholders through dividends and buybacks, making it attractive to income investors.

However, XOM stock depends heavily on oil prices and faces long-term risks from climate policies and weaker chemical margins. Overall, Exxon is a stable value stock, but not a high-growth play.

Upstream: Record Production and Advantaged Assets

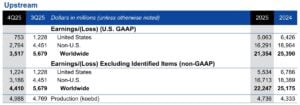
ExxonMobilโ€™s upstream segment generated $21.4 billion in earnings in 2025, down from $25.4 billion in 2024. Lower oil prices and reduced volumes from divestments weighed on performance. Higher depreciation also impacted earnings.

However, the company achieved its highest production in more than 40 years, reaching 4.7 million oil-equivalent barrels per day.ย Production surged to 5.0 million oil-equivalent barrels per day, with the Permian reaching 1.8 million and Guyana nearing 875,000 barrels per day.

Additionally, it also advanced several major projects.

  • The Yellowtail project in Guyana started early and under budget.
  • The Bacalhau offshore Brazil project launched in the fourth quarter.
  • Golden Pass LNG completed mechanical work, with first cargoes expected in early 2026.
exxon upstream
Source: Exxon

Energy Products: Refining Margins Boost Profits

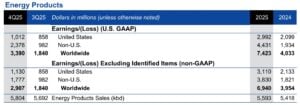
The Energy Products segment earned $7.4 billion in 2025, up $3.4 billion from 2024. Higher refining margins, cost savings, and asset sales drove the growth. However, the refining business remained resilient.

exxon xom
Source: Exxon

Chemicals: Weak Margins and Impairments

The Chemical Products segment struggled, with earnings falling to $800 million, down $1.8 billion from 2024. Weak margins, impairment charges, and higher spending weighed on results.

The China Chemical Complex ramp-up added costs, though high-value product sales hit records. Q4 saw a $281 million loss. Despite challenges, Exxon expanded chemical capacity and launched two advanced recycling facilities, processing over 250 million pounds of plastic waste annually.

$30 Billion Low-Carbon Strategy: CCS, Hydrogen, and New Materials

ExxonMobil continues to position itself as a major player in carbon capture, hydrogen, and lower-emission fuels. The company plans to invest up to $30 billion in lower-emission technologies between 2025 and 2030.

exxon
Source: Exxon

Management said rising carbon prices would make these investments more attractive and could significantly boost cash flow in the Low Carbon Solutions business. Exxon aims to scale projects in hydrogen, COโ‚‚ storage, and industrial clusters to become a partner of choice for large emitters.

The company also emphasized its core strengths in subsurface engineering, large-scale project execution, and existing infrastructure as competitive advantages in the energy transition.

exxon xom emissions
Source: Exxon

Methane and Air Emissions: Progress with Economic Logic

ExxonMobil reported significant progress on methane and air emissions. The company has reduced methane intensity by more than 60% since 2016 and targets 70โ€“80% reductions by 2030.

Management framed methane reduction as both an environmental and economic opportunity. Keeping methane in the system increases gas sales and reduces losses. Exxon also noted methaneโ€™s high warming potential compared to COโ‚‚, reinforcing the need for tighter controls.

Total reportable air emissions (VOCs, SOx, NOx) dropped about 25% from 2016 to 2024, even as throughput increased to record levels.

exxon emissions
Source: Exxon

Long-Term Outlook: Oil Cash Funds the Transition

ExxonMobil believes demand for decarbonization solutions will rise significantly through 2050. The company expects carbon pricing and net-zero policies to drive capital toward carbon capture and hydrogen over time.

However, Exxonโ€™s strategy remains pragmatic. The company will continue to maximize returns from oil, gas, and refining while gradually scaling low-carbon businesses. Management argues that each update to global net-zero scenarios increases the importance of lower-carbon solutions but does not change its core assessment of energy demand.

All in all, ExxonMobilโ€™s 2025 results show a company balancing two worlds. On one hand, it remains a cash-generating oil and gas powerhouse with record production and industry-leading shareholder returns. On the other hand, it is cautiously expanding into low-carbon technologies without sacrificing profitability.

Colgate-Palmoliveโ€™s 2025 Earnings: Solid Profits and Clear Path to Net Zero by 2040

Colgate-Palmoliveโ€™s latest earnings show that it is delivering steady financial performance while adapting to a changing global economy. Beyond the numbers, the results also point to how the company is preparing for a lower-carbon future. This opens the door for a closer look at its net-zero goals, emissions cuts, and long-term climate strategy.

Earnings Snapshot: What the Numbers Say

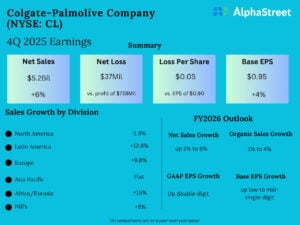
Colgateโ€‘Palmolive reported its fourth quarter and full-year 2025 results on January 30, 2026. Q4 adjusted earnings were $0.95 per share, above the $0.91 expected. Net sales reached $5.23 billion, up 5.8% from last year. Organic sales rose 2.2%, showing steady growth in oral care and pet nutrition.

For the full year, net sales were about $20.38 billion, up 1.4% from 2024. GAAP diluted EPS was $2.63, while base business EPS grew 3% to $3.69. Gross profit margins stayed above 60%. Operating cash flow hit $4.2 billion, and free cash flow before dividends was about $3.6 billion. The company returned roughly $2.9 billion to shareholders through dividends and share buybacks.

Colgate-Palmolive-Q4-FY25-earnings

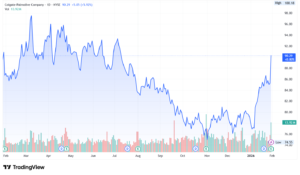
Management expects 2โ€“6% net sales growth in 2026, despite consumer spending pressures. These results show Colgateโ€™s core businesses remain strong while supporting its long-term climate strategy. Following the results, Colgateโ€™s stock price rose sharply, reflecting positive investor reaction.

Colgate-Palmolive stock price

These financial results are a great way to see how Colgate balances its business performance with its long-term climate strategy.

The Road to Net Zero: Colgateโ€™s Climate Blueprint

Colgate-Palmolive has a detailed climate strategy that guides how it plans to reduce emissions and reach net zero. The companyโ€™s climate plan follows the Science Based Targets initiative (SBTi) Net Zero Carbon Standard. This ensures that its emissions targets align with limiting global warming to 1.5 ยฐC above pre-industrial levels.

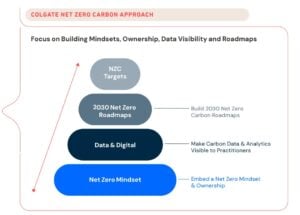
Colgateโ€™s long-term goal is to achieve net-zero carbon emissions across its full value chain by 2040. This means the company aims to reduce emissions as much as possible and balance any remaining emissions with removals by that year.

colgate net zero approach
Source: Colgate-Palmolive

The companyโ€™s climate commitment covers a broad range of emission sources, including:

  • Scope 1: Direct emissions from fuels and combustion sources under the companyโ€™s control.
  • Scope 2: Indirect emissions from purchased electricity for operations.
  • Scope 3: Upstream emissions such as purchased goods and services, capital goods, logistics, business travel, employee commuting, and leased assets. The strategy excludes only certain optional Scope 3 categories per the SBTi Net Zero Standard.

Targets That Matter: From 2025 to 2040

Colgate aims to reduce emissions with targets for both the near term (2025 and 2030) and a long-term net-zero plan.

  • By 2025:

    • Reduce Scope 1 and 2 GHG emissions in operations by 20% versus a 2020 baseline.
    • Reduce Scope 3 emissions from purchased goods and services by 20% versus a 2020 baseline.
    • Reduce GHG emissions from consumer use of products by 20% versus a 2016 baseline.
    • Reduce manufacturing energy intensity by 25% versus a 2010 baseline.
  • By 2030:

    • Reach 100% renewable electricity across global operations.
    • Reduce Scope 1 and 2 emissions by 42% versus 2020 levels.
    • Reduce Scope 3 emissions from purchased goods and services by 42% versus 2020 levels.
  • By 2040:

    • Achieve Net Zero carbon emissions across Scope 1, Scope 2, and most Scope 3 categories.
    • Reduce Scope 1, Scope 2, and Scope 3 emissions* by 90% from a 2020 baseline (*excludes certain Scope 3 categories per SBTi Net Zero Standard).

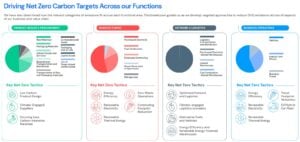
Colgate’s climate plan breaks down the net-zero effort into key areas: product design, manufacturing, logistics, and business operations. This way, responsibility is shared among teams.

colgate-palmolive emission reductions targets
Source: Colgate-Palmolive

In addition to targets, the plan highlights the distribution of Colgateโ€™s carbon footprint based on its 2024 Scope 1, Scope 2, and Scope 3 data. Most of the footprint comes from using and disposing of products, followed by supplier sourcing. This shows how important it is to involve suppliers and customers in cutting emissions.

These numbers and goals show that Colgate has set measurable, science-based climate targets and continues to develop strategies to reach them. The consumer giant aligns its climate strategy with well-known frameworks like the Task Force on Climate-related Financial Disclosures (TCFD). This adds transparency to how it evaluates climate risks and opportunities.

Where Emissions Come From, and Why It Matters

Colgate has taken steps toward achieving its emissions goals. The company is focusing on all areas, operations, factories, warehouses, and offices, to cut energy use and lower supply chain emissions.

Renewable Electricity and Energy Projects

Colgate plans to reach 100% renewable electricity by 2030. It has started investing in renewable energy projects, including virtual power purchase agreements for wind energy in Europe. These agreements are expected to meet a large part of the region’s electricity needs. This change helps lower emissions from power used at factory sites and main offices.

Supply Chain Engagement

Colgate recognizes that most of its emissions come from its supply chain and purchased goods. The company engages with suppliers to reduce emissions, improve energy efficiency, and support the use of low-carbon materials and processes. This includes encouraging suppliers to set their own science-based climate targets.

Operational Reductions

The consumer product firm aims to reduce energy use and emissions by 2025 and 2030. It seeks to cut energy intensity at factories and lower emissions from purchased goods. The company also reports progress against these goals in annual sustainability reports.

So far, the consumer giant has achieved the following milestones in tackling its climate footprint:

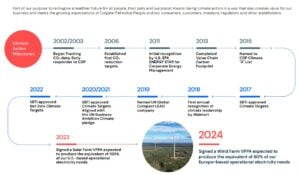
colgate-palmolive climate action 2024 net zero
Source: Colgate-Palmolive

Beyond Carbon: Packaging, Plastics, and Water

Colgate also addresses environmental impacts beyond carbon emissions. The company has clear goals for packaging and resource use:

  • Transition all plastic packaging to recyclable, reusable, or compostable materials by 2025.
  • Improve water stewardship and reduce waste in operations.
  • Achieve zero-waste operations at all manufacturing sites.
  • Target net zero water impact at water-stressed sites by 2025 and across all sites by 2030.

By the end of 2024, about 93% of Colgateโ€™s packaging was recyclable, reusable, or compostable. The company now uses recyclable toothpaste tubes in over 70 countries. It has also boosted the share of sustainable tubes in key markets.

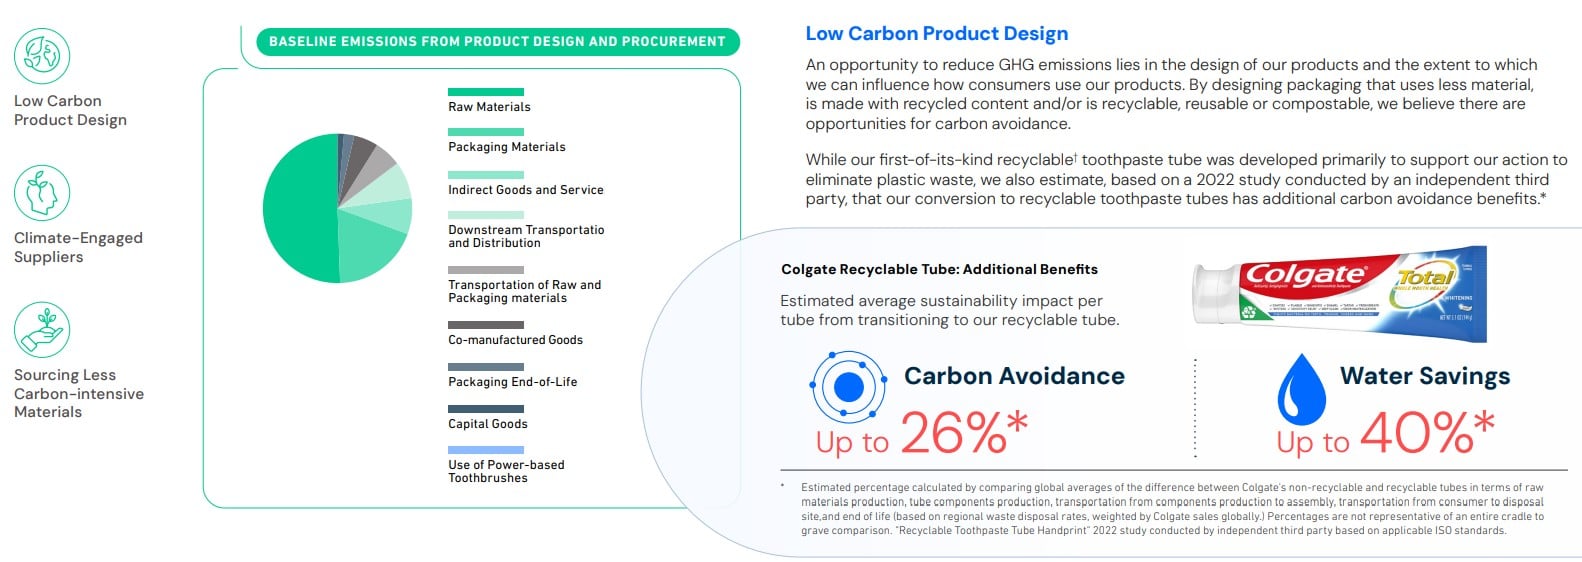
For instance, Colgateโ€™s recyclable toothpaste tubes help reduce carbon emissions by lowering the need for new raw materials and cutting manufacturing energy use. The company estimates that each tubeโ€™s carbon footprint is reduced by up to 26% compared with traditional multi-layer tubes. colgate low carbon product design

Source: Colgate-Palmolive

This change decreases emissions from production and also supports Colgateโ€™s broader goal of reducing Scopeโ€ฏ3 emissions from product use and end-of-life disposal. These steps aim to reduce environmental impact not just from carbon, but from waste and resource use throughout the product life cycle.

Colgateโ€™s Climate Actions Going Forward

Colgateโ€™s climate goals are part of a broader strategy that links environmental sustainability with business performance. The companyโ€™s net-zero by 2040 goal shows a long-term focus on reducing emissions across its entire value chain.

Progress follows science-based benchmarks. The company updates its targets to align with changing climate science standards. Colgate faces challenges with indirect emissions from suppliers and products. Still, its targets and actions show a clear path for future reductions.

The sustainability strategy also helps with other goals. These include waste reduction, water conservation, and better packaging. In these areas, measurable progress boosts Colgateโ€™s environmental profile. For example, high recyclable packaging rates play a key role.

Investors, customers, and community partners are increasingly watching how companies like Colgate balance growth with climate action. Colgateโ€™s earnings and environmental efforts show how it stays competitive and supports its long-term climate goals.

From Ambition to Execution: How Europeโ€™s Decarbonisation Agenda Performs on the Project Level

0

Europe positions itself as the global driver of the decarbonization agenda. Ambitious targets, regulatory reform and large-scale public funding define the direction. Yet behind the strategy, project pipelines narrow, execution slows down and many initiatives struggle to progress beyond early development. The gap between ambition and delivery continues to widen, making execution-level insight increasingly relevant.

At DECARBON 2026, this perspective takes center stage through insights shared by Marek Drywa, Senior Director Business Development at Worley. His presentation, โ€œDecarbonisation agenda in Europe: market and project observations from the engineering contractorโ€™s perspective,โ€ examines how Europeโ€™s decarbonization efforts perform when viewed from inside active projects.

Drawing on recent European project experience, Worley observes a slowdown since spring 2024 in both the volume and progression of decarbonization projects entering execution. While regulatory frameworks and public funding remain in place, fewer initiatives advance beyond planning into sustained implementation.

At the execution stage, delivery is increasingly shaped by technical complexity, operational constraints and coordination across stakeholders. Engineering timelines, asset readiness and integration challenges now play a more decisive role than strategic intent in determining project outcomes.

Practical perspectives from DECARBON 2026 build on hands-on experience across hydrogen, CCUS, energy storage, pipeline safety and low-carbon fuels. Speakers from LiveEO, SLB, Gasunie and ORLEN reflect on concrete challenges encountered across different segments of the value chain.

Taken together, these contributions highlight recurring structural constraints as well as effective approaches already being applied in practice. The discussion offers a realistic view of what currently supports progress in European decarbonization projects and where delivery continues to stall.

Join the discussion to gain practical insight into Europeโ€™s decarbonization agenda and the realities of turning commitments into executed projects: https://sh.bgs.group/3py

Can Apple Balance Explosive Q1 2026 Growth with Its Net-Zero Promise?

Apple started fiscal 2026 with a powerful performance. The company reported record revenue, strong earnings growth, and accelerating demand across major regions. At the same time, Apple doubled down on its climate roadmap, highlighting renewable energy use, carbon credits, and ambitious emissions reduction targets. Together, these results show how Apple is balancing profit growth with sustainability leadership.

This analysis breaks down Appleโ€™s Q1 2026 financial performance, regional growth drivers, market reaction, and its climate strategy in simple, easy-to-read language.

In Tim Cook’s words.

โ€œiPhone had its best-ever quarter driven by unprecedented demand, with all-time records across every geographic segment, and Services also achieved an all-time revenue record, up 14 percent from a year ago. We are also excited to announce that our installed base now has more than 2.5 billion active devices, which is a testament to incredible customer satisfaction for the very best products and services in the world.โ€

Appleโ€™s Q1 2026 Financial Results Show Strong Momentum

Apple reported $143.8 billion in revenue for its fiscal first quarter ended December 27, 2025. That was up 16% year over year, showing strong demand for its products and services.

The company also reported earnings per share (EPS) of $2.84, up 19% from last year. Net income reached $42.1 billion, up from $36.33 billion a year earlier. Theย board also approved a $0.26 per share dividend, reinforcing its commitment to returning cash to shareholders.

Overall, it beat market expectations on both revenue and profits, signaling strong execution across hardware and services.

Apple
Source: Apple

Greater China and India Drive Regional Growth

Apple saw broad growth across regions, but Greater China stood out as the top performer. Revenue from the region surged 38% year over year to $25.5 billion. Record iPhone sales and strong store traffic drove the jump.

Other regions also posted solid gains:

  • Americas: Revenue grew 11%
  • Europe: Up 13%
  • Rest of Asia Pacific: Up 18%
  • Japan: Up 5%

India was another highlight. Apple achieved quarterly records for iPhone, Mac, iPad, and Services in India. The installed base also grew at a double-digit pace, showing rising brand loyalty and expanding market penetration.

Tim Cook said iPhone demand was strong across all geographies, helping ease earlier concerns about slowing sales in China.

Apple Appl
Source: Apple

AAPL Stock Positive but Measured

Appleโ€™s stock (AAPL) reacted positively after the earnings release on January 29. Shares rose about 1โ€“2% in after-hours trading, reflecting investor confidence in Appleโ€™s performance.

At the time of reporting, Apple stock traded around $259.48, up slightly during the day. Investors seemed encouraged by strong execution but remained cautious about rising AI-related spending and broader tech market uncertainties.

AAPL Apple Stock
Source: Yahoo Finance

Appleโ€™s Climate Strategy: A Core Part of Its Business Model

Apple continues to position sustainability as a strategic priority. The company said it supports climate policies and works with policymakers and businesses to align with the Paris Agreement goal of net zero emissions by 2050.

Appleโ€™s long-term goal is to become carbon neutral across its entire global footprint by 2030. The plan focuses on renewable energy, recycled materials, and low-carbon transportation.

It aims to:

  • Reduce emissions by 75% compared with its 2015 baseline
  • Address the remaining 25% through high-quality carbon removal projects
  • Use 100% renewable energy across its supply chain
  • Increase recycled materials in products, including 99% recycled rare earth elements in magnets

Significantly, Apple already achieved carbon neutrality for corporate operations in 2020, making it one of the first major tech firms to reach that milestone.

The company also promotes science-based targets, transparent emissions reporting, and high-quality carbon removal standards. Apple supports strict ESG criteria for carbon credits to ensure real environmental and community benefits.

Renewable Energy and Supplier Decarbonization

Apple reported that renewable energy procured by suppliers avoided about 21.8 million metric tons of greenhouse gas emissions in 2024.

Many semiconductor and display suppliers pledged to cut fluorinated greenhouse gas emissions by at least 90% by 2030. These gases are extremely potent, so reducing them can significantly lower the tech sectorโ€™s climate impact.

Apple also supports policies to expand renewable electricity globally, improve grid infrastructure, and invest in energy storage and transmission. The company encourages life cycle emissions assessments and high-integrity mitigation standards.

Use of Carbon Credits and Nature-Based Projects

Apple has used carbon credits to maintain carbon neutrality for its corporate emissions. The company retired credits from multiple certified projects, including: Chyulu Hills project (Kenya), Guinan afforestation project (China), Alto Mayo project (Peru), Cispatรก Mangrove project (Colombia), and REDD+ forest conservation project (Guatemala)

These projects follow VCS and CCB standards, which aim to ensure environmental integrity and social benefits. Apple said it regularly updates its life cycle assessment models to improve transparency and accuracy.

apple emissions carbon credits
Source: Apple

Why Appleโ€™s Financial and Climate Performance Matters

Appleโ€™s strong Q1 2026 results highlight how sustainability and profitability can move together. The companyโ€™s revenue growth in China and India shows expanding global demand, while its climate strategy positions it as a leader in corporate decarbonization.

However, Appleโ€™s reliance on carbon credits may attract scrutiny as regulators and investors push for deeper emissions cuts rather than offsets. The tech giant will need to show real reductions across manufacturing, logistics, and product life cycles to maintain credibility.

In conclusion, Appleโ€™s fiscal Q1 2026 marked a powerful start to the year. Revenue and profits surged, driven by strong global demand and regional growth in China and India. Investors responded positively, though cautiously.

At the same time, Apple reinforced its climate ambitions with renewable energy investments, supplier decarbonization efforts, and carbon credit programs. With Apple 2030 approaching, the company faces a critical test: can it continue delivering record financial growth while cutting emissions at scale?

If Apple succeeds, it could set a blueprint for how Big Tech aligns growth with climate leadership in the coming decade.

Visa vs Mastercard: Strong Earnings Meet Rising Climate Pressure

Visa and Mastercard are two of the largest payment companies in the world. They process trillions of dollars in transactions each year. Their networks connect banks, merchants, and consumers across more than 200 countries.

Full year 2025 earnings show that both companies continue to grow, even as economic conditions remain uncertain. At the same time, investors and regulators are paying closer attention to sustainability and climate commitments. This article compares Visa and Mastercard with their latest earnings data, growth trends, and environmental strategies.

Earnings Show Strong Financial Performance

  • Earnings Check: Visaโ€™s Momentum Continues

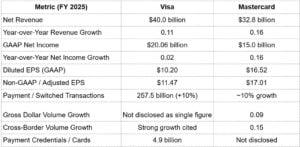
Visa reported strong financial results for its full fiscal year 2025. Net revenue reached $40.0 billion, an 11% increase from 2024. This growth was driven by higher payment volumes, stronger cross-border activity, and more transactions processed on its network.

Visaโ€™s GAAP net income was about $20.06 billion, up from $19.74 billion in the prior year. Diluted earnings per share (EPS) grew to $10.20, compared with $9.73 a year earlier.

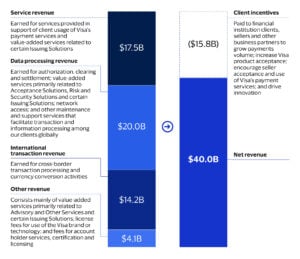
visa 2025 financial results
Source: Visa

On a non-GAAP basis, net income was roughly $22.54 billion, and non-GAAP diluted EPS reached $11.47, both showing double-digit growth year over year. Total payments volume processed on Visaโ€™s network was 257.5 billion transactions, up 10% from the prior year. Visaโ€™s payment credentials also grew, reaching 4.9 billion by year-end.

  • Mastercard Delivers: Solid Results and Strategic Shifts

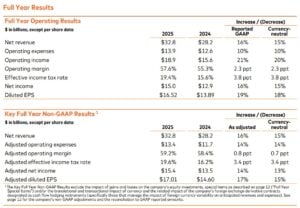
Mastercard also reported strong results for the full year 2025. GAAP net revenue increased to $32.8 billion, up 16% from 2024. On a currency-neutral basis, revenue also grew close to 15%.

The companyโ€™s GAAP net income was about $15.0 billion, a 16% increase from the previous year. Mastercardโ€™s diluted EPS rose to $16.52, up from $13.89 in 2024.

mastercard full year 2025 financial results
Source: Mastercard

On a non-GAAP basis, adjusted net income was $15.4 billion, and adjusted diluted EPS reached $17.01, reflecting 14โ€“17% growth. Transaction activity stayed strong. Gross dollar volume rose by about 9%. Cross-border volume increased by 15%, and switched transactions were up by 10%.

Comparing Growth Drivers and Market Position

Visa and Mastercard share many growth drivers. Both benefit from rising digital payments, increased travel, and global e-commerce expansion. Cross-border transactions are especially important for revenue growth, as they generate higher fees.

Visa reported cross-border growth of about 13%, while Mastercard posted 15% growth in the same area. These figures show that international spending remains a key strength for both companies.

VISA vs MASTERCARD financials 2025

Visaโ€™s larger network gives it higher total revenue. Mastercard, however, often reports higher EPS due to differences in cost structure and share count. Both companies continue to invest in technology, security, and new payment services.

Analysts expect Visa to maintain double-digit revenue growth, while Mastercard is expected to grow at high single-digit to low double-digit rates. These forecasts reflect confidence in long-term payment trends.

Why Emissions Matter for Payment Giants

Financial strength is only one part of the comparison. Sustainability has become a growing focus for payment companies, especially as investors demand clearer climate action.

Breaking Down the Carbon Numbers: 2024 Emissions

Both Visa and Mastercard publish actual greenhouse gas (GHG) emission numbers each year. These figures help show how much carbon each company produces from operations and its value chains.

  • Visaโ€™s 2024 Emissions

In 2024, Visa shared detailed GHG emissions data. They used the GHG Protocol, which divides emissions into direct and indirect categories. Visa’s sustainability report shows its total operational emissions.

Scope 1 emissions were about 13,510 metric tonnes of COโ‚‚e. For Scope 2, location-based emissions reached 73,448 metric tonnes of COโ‚‚e.

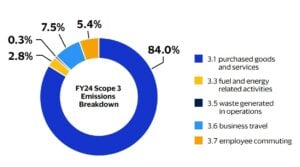
Visa also reported 613,162 metric tonnes of Scope 3 emissions. These are indirect emissions from its value chain. They come from things like purchased goods, services, business travel, and employee commuting. This brings Visaโ€™s total GHG emissions across Scope 1, 2, and 3 to roughly 700,120 metric tonnes of COโ‚‚e in 2024. Scope 3 made up the largest share of these emissions, around 87.6% of the total footprint.

visa scope 3 emissions
Source: Visa

Visa continues to work toward decoupling its business growth from emissions, even as its operations expand. It measures its footprint each year and includes renewable energy and carbon offsets as part of its strategy to manage impact.

  • Mastercardโ€™s 2024 Emissions

Mastercard also publishes verified GHG data. In 2024, the companyโ€™s total Scope 1, 2, and 3 emissions were 515,981 metric tonnes of COโ‚‚e. This represents a 7% drop from 2023 and a 46% cut from the 2016 baseline.

Mastercard 2024 GHG emissions
Source: Mastercard

Mastercardโ€™s Scope 1 and Scope 2 emissions made up about 10% of the total. The other 90% came from Scope 3 indirect emissions throughout its value chain. The company has cut emissions in several categories. It is also on track to meet interim targets approved by the Science-Based Targets initiative.

Mastercardโ€™s environmental strategy focuses on cutting operational emissions. It also aims for 100% renewable energy in its offices and data centers. The company also uses tools and programs to help partners and consumers understand and reduce their own emissions.

These emissions figures help illustrate each companyโ€™s current footprint and progress. They provide concrete benchmarks as Visa and Mastercard work toward their long-term climate goals.

visa vs mastercard 2024 GHG emissions
Data from companies’ 2024 sustainability reports

Visaโ€™s Path to Net Zero

Visa has committed to reaching net-zero emissions by 2040. This target aligns with the Science-Based Targets initiative (SBTi) and a 1.5ยฐC climate pathway.

Visa achieved operational carbon neutrality in 2020. It maintains this status by using 100% renewable electricity across its global offices and data centers. This covers Scope 1 and Scope 2 emissions, as well as parts of Scope 3, such as business travel and employee commuting.

Visa also works to include sustainability in its products. It offers tools that help partners track the carbon footprint of transactions. The company supports initiatives related to greener transport and digital efficiency.

Visaโ€™s approach focuses on reducing its own operational impact while enabling partners and customers to make more informed choices.

Mastercardโ€™s Climate Playbook

Mastercard has also committed to net-zero emissions by 2040. Its target covers the entire value chain, including Scope 1, Scope 2, and Scope 3 emissions.

As of 2024, Mastercard reported a 46% reduction in greenhouse gas emissions from its 2016 baseline. Like Visa, Mastercard uses 100% renewable electricity for its operations.

One of Mastercardโ€™s most visible initiatives is the Priceless Planet Coalition. The program aims to restore 100 million trees by 2025. As of 2024, the coalition had supported the planting of about 26 million trees.

Mastercard also provides tools that help consumers understand the carbon impact of their purchases. The company integrates sustainability standards into its supplier and partner programs.

Side-by-Side: How Their Climate Strategies Compare

Both companies share several similarities in their climate strategies. Each uses renewable electricity and has committed to long-term net-zero targets. Both also work with partners to extend sustainability beyond their own operations.

There are also differences in focus. Visa emphasizes operational neutrality and payment-based tools that support sustainable choices. Mastercard places more emphasis on measurable emissions reductions and large-scale environmental programs, such as reforestation.

Mastercardโ€™s 46% emissions reduction since 2016 provides a clear progress metric. Visaโ€™s early move to carbon neutrality in 2020 shows leadership in operational emissions.

Neither company directly controls most consumer emissions linked to card use. However, both aim to influence behavior through data, tools, and partnerships.

Looking Ahead: Profits, Payments, and Climate Pressure

Visa and Mastercard remain financially strong. Rising digital payments, global travel, and cross-border commerce continue to support earnings growth. Recent results show that both companies are well-positioned for the years ahead.

At the same time, sustainability expectations continue to rise. Regulators, investors, and consumers want clearer climate action from large financial companies. Both Visa and Mastercard have responded with net-zero commitments and measurable steps.

Challenges remain. Most emissions linked to payments sit outside direct operations. Reducing value-chain emissions will require broader collaboration with banks, merchants, and consumers.

Still, both companies have made climate strategy a core part of their long-term plans. Their progress shows how financial performance and sustainability goals are increasingly linked in the global payments industry.