Volkswagen Overtakes Tesla in Europe’s EV Market: A Turning Point for Clean Mobility

According to market researcher Dataforce (via Automotive News), Volkswagen reclaimed the top spot in Europe’s electric vehicle (EV) market in 2025, overtaking Tesla after a sharp rebound in battery-electric vehicle sales. The shift marks a major turning point in the region’s EV race and reflects bigger changes in competition, policy, and the role of carbon credits in the auto industry.

Europe remains one of the world’s most aggressive regions for electrification. Stricter emissions rules, rising fuel costs, and government incentives continue to push buyers toward electric cars. But the latest sales data shows that leadership in the EV market is no longer guaranteed for early pioneers.

Volkswagen’s EV Comeback Was Built on Scale and Choice

Volkswagen sold around 274,000 battery-electric vehicles in Europe in 2025, up 56% from the previous year. Tesla, by contrast, delivered roughly 239,000 units, a 27% decline year over year.

The reversal is striking. In 2024, Tesla outsold Volkswagen by nearly two-to-one. One year later, Volkswagen regained the crown by expanding its lineup and appealing to a wider group of buyers.

Several models drove the surge:

  • The ID.4 electric SUV sold more than 80,000 units, rising nearly 24%.
  • The ID.3 hatchback climbed over 44% to almost 79,000 units.
  • The ID.7 sedan and wagon saw explosive growth of more than 137%, with over 76,000 units sold.

These results show the power of a broad portfolio. Volkswagen offered vehicles across different price points and body styles, from compact hatchbacks to family SUVs and premium sedans. That breadth helped it capture buyers who might not have considered Tesla’s narrower lineup.

Globally, Volkswagen Group said its battery-electric deliveries rose 32% to nearly 983,000 vehicles, even as total vehicle sales dipped slightly. Europe remained its core EV market and a key driver of its decarbonization strategy.

Volkswagen tesla

Tesla’s European Slowdown Signals a Competitive Shift

Tesla still led in individual models. The Model Y remained Europe’s best-selling single EV, with more than 151,000 registrations in 2025, although sales dropped sharply from the prior year. The Model 3 ranked among the top sellers but lost ground to new competitors like Skoda’s Elroq.

The company struggled across most major European markets. Germany, once Tesla’s strongest growth engine in Europe, saw registrations fall nearly 48% to around 19,000 units. Other large markets also reported declines, reflecting intense competition and shifting consumer preferences.

Norway was a rare bright spot. Tesla sales rose there as buyers rushed to secure incentives before policy changes expected in 2026.

The broader trend suggests that Tesla’s first-mover advantage is fading in Europe. Legacy automakers are catching up with competitive models, local manufacturing, and strong dealer networks.

tesla ev sales
Source: Electrek

Europe’s EV Boom Continues Despite Market Shakeups

Jato Dynamics data shows that Europe’s battery-electric vehicle market grew by about 30% in 2025, reaching roughly 2.6 million units sold. That growth came despite economic uncertainty, high interest rates, and uneven government subsidies.

Several factors drove adoption:

  • Stricter EU emissions rules and fleet-average CO₂ targets
  • Expanding charging infrastructure across major cities and highways
  • Lower battery costs and improving vehicle range
  • A wave of new models across mainstream and premium brands

Analysts say consumers now have more choice than ever. That diversity is accelerating the transition away from internal combustion engines.

EV sales Source: Jato

The Global Competition Is Intensifying

Europe is only one battleground. Globally, competition is heating up even faster.

China’s BYD delivered more than 2.2 million battery-electric vehicles in 2025, surpassing Tesla’s roughly 1.6 million units. The Chinese automaker has rapidly expanded its lineup and global footprint, positioning itself as a serious rival in both emerging and developed markets.

In Europe, BYD still trails established brands like Volkswagen, BMW, Hyundai, and Kia. But its rapid growth signals that the global EV market is becoming more fragmented and competitive.

This competition could benefit consumers by lowering prices and accelerating innovation. It could also put pressure on margins across the industry, making carbon credit revenue and government incentives even more important to profitability.

Volkswagen-Tesla Shift Highlights Scale vs. Innovation

For investors, the Volkswagen-Tesla shift highlights two competing EV strategies.

Tesla (TSLA stock) represents innovation-driven growth. It leads in software, autonomous driving, and charging infrastructure. Its carbon credit revenue and energy business provide additional income streams.

Volkswagen represents a scale-driven transition. It has massive manufacturing capacity, strong brand recognition, and deep relationships with European consumers and regulators. Its ability to rapidly expand EV production shows how legacy automakers can pivot when policy and market conditions align.

The broader trend suggests that the EV market will not be winner-takes-all. Instead, it will be shaped by multiple players with different strengths, from Chinese manufacturers to European incumbents and U.S. tech-driven automakers.

Sustainability Strategies Are Becoming a Core Battleground

Volkswagen’s comeback is not just about sales numbers. It reflects a broader sustainability strategy. The company has committed to net-zero emissions across its operations and supply chain, with heavy investments in renewable energy, battery recycling, and low-carbon manufacturing.

The company is expanding battery production in Europe, using renewable electricity at several facilities. It is also working to reduce lifecycle emissions, including raw material sourcing and end-of-life recycling.

Tesla remains a leader in vertical integration, software, and battery efficiency. Its vehicles often have lower lifetime emissions compared to internal combustion cars, especially in regions with clean electricity grids. Tesla also invests in energy storage, solar, and charging infrastructure, reinforcing its clean energy ecosystem.

However, Europe’s focus is shifting toward lifecycle emissions, not just tailpipe emissions. That includes mining, manufacturing, logistics, and recycling. Automakers that can decarbonize their entire value chain may gain a competitive advantage in future regulations and carbon markets.

What This Means for Europe’s Climate Goals

Europe aims to cut transport emissions sharply by 2030 and reach net zero by 2050. Road transport remains one of the largest sources of emissions, making EV adoption critical.

Volkswagen’s surge in EV sales supports these goals by displacing internal combustion vehicles at scale. Tesla’s presence continues to push technology and infrastructure forward. Competition among brands accelerates innovation and lowers costs, thereby increasing adoption.

Carbon markets add another layer of accountability. Automakers that fail to reduce emissions face financial penalties or must buy credits, creating a strong incentive to electrify fleets.

ICCT findings reveal the critical impact of policies adopted in the past 3 years. Road transport emissions in the European Union were projected to peak at nearly 800 million tonnes of CO2 in 2025 and decline thereafter by around one-quarter by 2035. This accelerated decline reflects the impact of the transition from conventional cars to zero-emission vehicles.

Europe Road Emissions 

Europe EV
Source: ICCT

Tesla still leads in technology and brand recognition. But Volkswagen’s scale, product range, and regulatory alignment are proving powerful in Europe’s policy-driven environment.

As global competition intensifies and carbon markets evolve, the EV industry will increasingly be shaped by sustainability strategies, regulatory compliance, and lifecycle emissions performance.

Volkswagen’s rise past Tesla in Europe is more than a sales milestone. It is a sign that the clean mobility transition is entering a diverse and competitive phase. Automakers that combine scale, innovation, and carbon strategy will shape the future of transportation—and the future of carbon markets.

Clean Energy Investment Hits Record $2.3T in 2025 Says BloombergNEF: What Leads the Surge?

Global investment in clean energy reached a new high of $2.3 trillion in 2025, according to a major industry report. This total was 8% higher than in 2024, showing that investment in low-carbon technologies continued to grow despite economic uncertainty. Researchers say this shows the global interest in cutting greenhouse gas emissions and creating cleaner energy systems.

The figures come from the BloombergNEF Energy Transition Investment Trends 2026 report. BloombergNEF is a leading research provider that tracks investments in clean energy technologies and infrastructure.

The clean energy transition includes technologies such as renewable power, electric vehicles (EVs), grid improvements, energy storage, and climate-related tech companies. Together, these areas attracted record funding.

Breakdown of the $2.3 Trillion Investment

The global total of $2.3 trillion in 2025 covered several key clean energy sectors:

  • Electric transport: The largest category, with $893 billion invested. This includes electric vehicles and charging infrastructure, which are expanding rapidly around the world.
  • Renewable energy: About $690 billion went into renewable power such as wind, solar, and other clean sources. This was slightly lower than the previous year due to changing regulations in China’s power markets.
  • Power grids: Investment in grid systems reached $483 billion in 2025. This spending supports the transmission and distribution of clean energy.
  • Emerging sectors: Hydrogen received $7.3 billion, and nuclear energy received $36 billion.

Bloomberg Energy Transition Investment Trends 2025

Although total investment grew, renewable energy funding itself was down nearly 9.5% compared with 2024. This decline was mainly due to new regulatory rules in China, the world’s largest clean energy market.

Overall, clean energy spending has outpaced fossil fuel investment for a second year in a row. Fossil fuel supply investment fell by $9 billion in 2025, mainly due to reduced spending on oil and gas production and fossil power plants.

Global-energy-transition-investment-by-sector-BNEF

Regional Power Plays: Who’s Investing Where

Investment levels differ greatly by region. This shows the impact of policy, industry structure, and economic growth.

In the Asia Pacific, investment accounted for nearly 47% of the global total in 2025. China stayed the top market, investing around $800 billion in clean tech. This was despite some drops in its renewable sector.

India saw investment grow by 15%, reaching around $68 billion in 2025. The increase was driven by renewables, grid upgrades, and electrification projects.

The European Union grew its investment by 18% to about $455 billion, making it a major contributor to the global increase.

In the United States, investment increased by 3.5% to about $378 billion. This rise happened even though some federal policies slowed support for certain clean energy programs.

Global energy transition investment, by economy or region
Source: BloombergNEF

These patterns show that all regions invest in clean energy. However, the pace and focus vary based on local strategies and market conditions.

Trends Driving Clean Energy Investment

  • Electrified Transport Leads

Investment in electric transport, like EVs and charging stations, is now a key player in clean energy spending. In 2025, this area alone attracted $893 billion, making it the top category of global investment.

Electric vehicles are growing fast as battery costs fall and more models become available. Many countries and companies have set targets to phase out fossil fuel vehicles, which boosts demand for EV infrastructure.

EV sales share by region 2030 IEA

  • Renewable Power and Grids

Even though renewable investment dipped slightly, it still remained a large portion of the total. The $690 billion invested in renewables in 2025 supports new solar, wind, and other clean power plants.

Investment in power grids also grew, reaching $483 billion. Upgrading grids is essential to connect more clean energy to the places that need it. These upgrades include transmission lines, smart grid technologies, and energy storage systems.

  • Clean Tech Supply Chains and Finance

Investment in factories and supply chains for clean tech also expanded. In 2025, spending on clean energy supply chains reached $127 billion, a 6% increase from 2024. These funds went to battery factories, solar equipment production, and mining for battery metals.

Equity funding in climate-tech companies also rebounded strongly, rising to $77.3 billion — a 53% increase from the previous year. This was the first year of growth in equity funding after several years of decline.

In addition, energy transition debt issuance, loans, and bonds to finance clean energy projects reached $1.2 trillion, up 17% from 2024. This reflects strong interest from both public and private financiers.

Historical Context and Recent Growth

Clean energy investment has been growing steadily over the past decade.

In 2024, global energy transition investment reached about $2.1 trillion, surpassing the $2 trillion mark for the first time. This total was driven by electrified transport, renewable power, and grid investment.

In 2023, investment in clean energy surged to around $1.77 trillion, reflecting rising spending despite geopolitical challenges and market pressures. Electrified transport and renewables both hit new highs that year.

The jump to $2.3 trillion in 2025 continues this long-term growth trend, even though the rate of growth has slowed compared with earlier years. The annual increase dropped from more than 20% several years ago to 8% in 2025 as markets matured and conditions shifted.

Looking Ahead: The Road to $2.9 Trillion

Analysts expect clean energy investment to keep rising in the near term, though uncertainties remain.

BloombergNEF’s base-case scenario shows that global energy transition investment might hit about $2.9 trillion annually over the next five years. This will be above 2025 levels. It shows ongoing interest from both governments and companies.

The International Energy Agency (IEA) offers a broader forecast for total energy investment in 2025. Overall energy investment could reach around $3.3 trillion. This includes spending on both clean and fossil fuels. Clean technologies are expected to get over $2.2 trillion of that total. This would mean clean energy investment continues to outpace fossil fuel spending.

global clean energy investment 2025 by IEA
Source: IEA

Experts see these future figures as good signs. However, they say annual investment must grow a lot to reach long-term climate goals, like those in the Paris Agreement. To meet net-zero by 2050, analysts say the world may need to invest over $5 trillion each year by the end of this decade.

What The Record Spend Means for the Energy Transition

The $2.3 trillion clean energy investment in 2025 shows that countries, companies, and investors around the world continue to fund the energy transition. These funds support low-carbon technologies that reduce emissions and improve energy security.

Investment in electric transport helps shift away from fossil fuel vehicles. Renewable energy funding builds new wind and solar capacity. Grid and storage investment enables that power to reach homes, businesses, and industries.

Regional investment patterns show strong gains in the Asia Pacific, Europe, India, and the United States. However, China saw a slight drop in renewable energy funding.

The clean energy transition remains robust, though overall growth rates have slowed compared with earlier years. The trend also shows that climate goals are now a key part of economic and infrastructure strategies. Forecasts indicate a continued expansion of clean energy investment soon. However, meeting long‑term climate targets will need even greater flows of capital across all regions.

Top Carbon Credit Companies to Watch in 2026

Carbon credits are becoming a major part of how the world fights climate change. A carbon credit represents the removal or reduction of one ton of carbon dioxide or equivalent greenhouse gas. Companies use these credits to meet emissions targets or to help reach climate goals.

By 2026, analysts predict that carbon markets will be growing quickly. More firms are integrating carbon credit strategies into their business models. Some generate credits directly. Others build markets or invest in credits. This article highlights the top public companies that stand out in the carbon credit space.

Carbon Credit Market: Key Facts and Stats

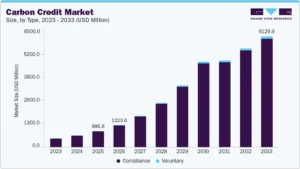
The global carbon credit market is already large, and it is expected to grow quickly in the coming years. In 2025, the total carbon credit market was estimated at around $887 billion.

By 2026, it is projected to reach about $1.22 trillion, driven by stricter rules and corporate demand for offsets. This growth reflects rising demand from companies and governments that want to meet climate targets and comply with emissions rules.

The market includes credits created for reducing emissions and credits created for removing carbon from the atmosphere. Markets fall into two main types: compliance markets and voluntary markets.
  • In compliance markets, companies buy credits to meet legal limits.
  • In voluntary markets, firms purchase credits to enhance their sustainability and climate goals, but are not required to do so.

Compliance markets currently account for most of the market’s size. Voluntary markets are much smaller, amounting to about ~$2 billion only. 

carbon credit market projection

Many countries have set up carbon pricing systems or cap‑and‑trade programs to limit greenhouse gases. Over 70 countries now use some form of carbon pricing or carbon trading, which helps drive demand and creates a large pool of buyers and sellers.

These statistics show that carbon credits are no longer a niche environmental tool. They have become a major global market linked to climate policy and corporate emission reduction strategies.

Here are the top carbon credit innovators to put on your radar this 2026 and even beyond.

Tesla: Leading Carbon Credit Revenue

Tesla is known for electric vehicles, but it is also a major player in carbon credit markets. The company earns money by selling regulatory carbon credits to other automakers. These credits help other companies comply with emissions rules in the U.S., Europe, and China.
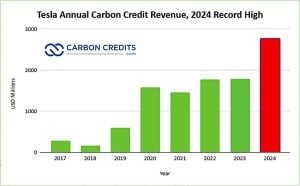
In 2024, Tesla earned about $2.76 billion from carbon credit sales, up from $1.79 billion in 2023. This marked a 54 % increase in one year and showed strong demand for emissions credits from legacy automakers.

Since 2017, Tesla has earned more than $10.4 billion from selling carbon credits. That revenue stream is crucial for the company’s finances. It matters more as competition in the EV market grows and profit margins shrink.

Tesla annual carbon credit revenue in 2024

Tesla’s credits come from producing zero‑emission vehicles that exceed regulatory targets. Companies that cannot meet those targets buy the credits. This dynamic makes Tesla both a leader in EVs and an innovator in carbon compliance markets.
Carbon Streaming Corporation: A New Model for Credits

Carbon Streaming Corporation is a different kind of public company focused on future carbon credits. Rather than building carbon projects itself, it finances project developers around the world and receives rights to future carbon credits in return.

This model works like a royalty or streaming deal. Carbon Streaming pays upfront to help projects get built. In exchange, it receives credits over time. This gives investors exposure to carbon credits without the complexities of running a project.

Carbon Streaming is listed on Canadian and U.S. markets under tickers such as NETZ and OFSTF. As carbon markets grow, the model could expand. More credits might come from forest protection, clean energy, or carbon capture programs. These would then boost its balance sheet.

carbon streaming corporation portfolio projects
Source: Carbon Streaming Corporation

This approach means Carbon Streaming can benefit from rising carbon prices and volumes in compliance and voluntary markets. Investors looking for direct exposure to carbon credit supply may find its growth model interesting.
Intercontinental Exchange: Exchange Infrastructure for Carbon Markets

Intercontinental Exchange (ICE) is a financial markets company known for running major exchanges. ICE supports carbon markets by providing the infrastructure for trading carbon allowances and credits. This includes platforms for compliance markets like the European Union Emissions Trading System (EU ETS) and other regional cap‑and‑trade programs.

Carbon credits and emissions allowances traded on ICE help companies meet regulated limits. By offering transparent pricing and reliable settlement, ICE reduces barriers for institutional participation. As carbon pricing systems expand globally, the need for strong trading infrastructure grows, too.

ICE is not a carbon credit producer. Instead, it is a market facilitator. Its platforms help buyers and sellers discover prices and exchange credits efficiently. This makes carbon markets more liquid and accessible for corporations and financial investors.

ICE carbon futures index
ICE Carbon Futures Index Family

For investors, ICE provides exposure to the growth of carbon markets without tying performance to any single project or credit type.

Xpansiv: Leading Carbon and Environmental Commodities Exchange

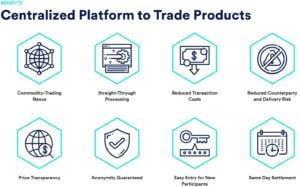
Xpansiv is a technology company that operates one of the world’s largest carbon credit exchanges for voluntary environmental commodities. Its platform, the Carbon Business Line (CBL), is used by companies trading voluntary carbon credits and other climate‑linked assets.
Xpansiv’s system has handled more than 250 million metric tons of carbon dioxide equivalent (CO₂e) transactions since 2020. In 2025, weekly trading volumes often exceeded 300,000 tons, with most credits coming from nature‑based projects like forestry and land restoration.

Xpansiv has also expanded its listings to include removal‑only credits and CORSIA‑compliant aviation credits. Its new partnership with the Korea Exchange (KRX) seeks to create a carbon credit trading market in Asia. This will connect KRX to Xpansiv’s global platform. This could increase liquidity and price discovery in new regions.

xpansiv benefits
Source: Xpansiv

Xpansiv offers investors a key role in carbon credits. It provides market infrastructure, which is important as trading volume and price visibility increase with rising demand.
Drax Group: From Power Generation to Carbon Removals

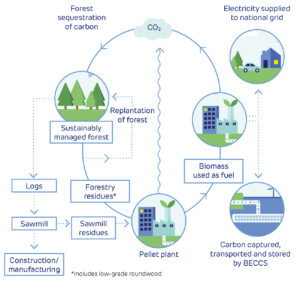
Drax Group plc is a British power generation company listed on the London Stock Exchange. In recent years, Drax has expanded into carbon removal projects, including bioenergy with carbon capture and storage (BECCS).

Drax has a carbon removals deal. They will provide 25,000 metric tons of CO2 removals using BECCS credits. The price starts at $350 per ton. These credits represent permanent carbon storage rather than simple emissions reductions.

Drax’s core power business has used biomass fuel. Now, it is shifting focus to carbon removals. This change places Drax in markets where high-quality credits are in demand. As markets shift toward removal‑based credits, companies with validated removal projects may gain a strategic edge.

drax power beccs process
Source: Drax

Drax gives investors a chance to tap into energy generation and new carbon removal credits. This area could grow as climate goals become more ambitious.

Why These Carbon Credit Innovators Matter

These companies represent different parts of the carbon credit ecosystem:

  • Carbon revenue streams: Tesla shows how compliance markets can create meaningful income from emissions‑reducing products.
  • Credit financing models: Carbon Streaming provides a way to invest in future carbon credits via streaming agreements.
  • Market infrastructure: ICE and Xpansiv build the platforms that make carbon trading efficient and transparent.
  • Carbon removal exposure: Drax participates in projects that generate high‑quality removal credits, helping meet tougher climate targets.

Key Carbon Market Trends to Track in 2026 and Beyond

Carbon markets will likely keep growing. This is due to stricter regulations and tougher corporate climate goals

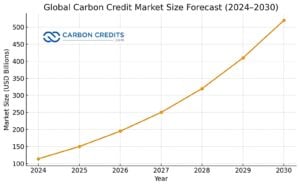
global carbon credit market size 2030

The chart above shows a steady and accelerating rise in the global carbon credit market from 2024 to 2030. Market size grows from just over $110 billion in 2024 to more than $520 billion by 2030, which signals strong and sustained demand.

The upward curve becomes steeper after 2026, suggesting faster growth as climate rules tighten and more countries expand carbon pricing systems. It also reflects rising corporate demand as companies use credits to meet emissions targets.

Overall, the chart supports the view that carbon credits are shifting from a supporting role to a core market tied closely to regulation, compliance, and long-term climate strategy.

Here are key trends that could shape carbon credit investing:

  • Expansion of compliance markets: More regions are adopting emissions trading systems and carbon pricing.
  • Quality of credits: High‑integrity removal credits are gaining attention from corporations and regulators.
  • Voluntary market growth: Companies with net‑zero pledges will continue purchasing credits, especially removal‑based ones.
  • Market access: Easier trading through exchanges and platforms will help investors participate.

Carbon credit markets are becoming part of corporate strategy and financial planning. The five companies reflect both business models and market mechanisms that matter for sustainability‑focused investors in 2026 and beyond.

Microsoft Q2 FY26 Earnings: $81B Revenue, AI Momentum, and a 150% Jump in Water Use by 2030

Microsoft’s Q2 FY26 earnings show a company growing fast while facing new sustainability pressures. Revenue surged on strong AI and cloud demand, carbon removal commitments doubled, and data centers expanded. At the same time, rising water use highlights the environmental costs of AI. Together, the results show how Microsoft is trying to balance financial growth, climate action, and resource management as its AI-driven business scales.

Big Numbers, Bigger Momentum: Microsoft’s Q2 FY26 Performance

Microsoft reported strong results for the second quarter of fiscal 2026, ending December 31, 2025. The company’s total revenue was $81.3 billion, up 17% from the $69.6 billion reported in the same period last year.

Net income, the profit after expenses, was $38.5 billion. This figure rose 60% from about $24.1 billion in the second quarter of fiscal 2025. Microsoft also reported a diluted earnings per share (EPS) of $5.16. This was up 60% from $3.23 per share in the prior year. Operating income also increased by 21% year over year to was $38.3 billion. 

The tech giant also reported large growth in its cloud and AI-related businesses. Revenue from Microsoft Cloud reached $51.5 billion in the quarter. This was an increase of 26% compared with the prior year.

Breaking this down:

  • Intelligent Cloud revenue was $32.9 billion, up 29%.
  • Productivity and Business Processes revenue was $34.1 billion, up 16%.
  • More Personal Computing revenue was $14.3 billion, down 3%.
microsoft fy26 income statement
Source: App Economy Insights

The company also reported its remaining performance obligations, future contracted revenue yet to be recognized, at $625 billion. This was up 110% compared with the same time last year.

Microsoft continued to return cash to shareholders. In the quarter, it returned about $12.7 billion through dividends and share buybacks — an increase of about 32% year over year.

These results show that Microsoft continued to grow across major business segments in Q2 FY 2026. Cloud services and AI-related products remained key drivers of revenue growth. At the same time, personal computing revenue, which includes Windows licensing, Surface devices, and search advertising, experienced a small decline.

Despite these robust results, Microsoft’s stock fell about 11% after the earnings. It dropped by $52.95 to close around $428.68 in late trading after hitting a low of $421.11. This is due to investors’ concerns about slow cloud growth and high spending on AI.

Microsoft MSFT stock price

Alongside its strong financial performance, Microsoft is also taking major strides in its environmental commitments.

Carbon Removal Leadership: Doubling Impact in 2025

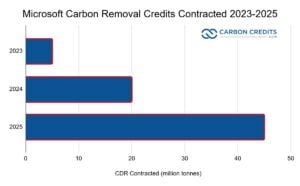
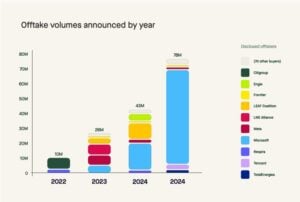
Sustainability remains central to Microsoft’s strategy. In 2025, the company more than doubled its carbon removal agreements to 45 million metric tons of CO₂, up from 22 million tons in 2024.

microsoft carbon removal contracts 2023-2025

These purchases include a mix of nature-based solutions. They cover forestry and soil carbon projects, plus direct air capture technologies. The agreements span North America, Europe, and Africa, targeting high-quality, verified removal credits with long-term permanence.

Microsoft’s move reflects a broader trend among tech giants committing to net-zero and carbon-negative strategies. Other big buyers are Amazon, Google, and Stripe. They’re investing in carbon removal to offset emissions that can’t be cut yet.

By securing long-term offtake agreements, Microsoft ensures these projects receive funding to scale operations and deliver measurable climate impact. Analysts predict that global corporate carbon removal purchases might exceed 150 million metric tons each year by 2030. This shows a fast-growing market that mixes corporate sustainability goals with investment chances.

AI’s Hidden Cost: Data Centers and Water Demand

Microsoft also released projections on AI-driven data center water consumption. With AI workloads surging, water use in Microsoft’s global data centers is expected to rise 150% by 2030 compared with current levels. That’s equal to using about 18 billion liters over the said period. 

The increase is mainly due to liquid cooling systems used to maintain GPU and CPU performance in AI servers. Water is essential to prevent overheating and maintain efficiency. Microsoft’s water needs are spiking hardest in dry areas.

  • In Phoenix (hit by 20 years of drought), the company cut its 2030 estimate from 3.3 billion liters to 2 billion by running hotter data centers.
  • Near Jakarta, Indonesia (a sinking city with drained underground water), the forecast dropped from 1.9 billion to 664 million liters.
  • In Pune, India (where shortages caused protests and a “No Water, No Vote” push), it fell from 1.9 billion to just 237 million liters—Microsoft wouldn’t say why.

As AI adoption grows, data centers will consume more energy and water, especially in regions with concentrated cloud infrastructure.

global data center water use projection Bloomberg

In an interview, Priscilla Johnson, Microsoft’s former director of water strategy until 2020, stated:

“Water took a back seat. Energy was more the focus because it was more expensive. Water was too cheap to be prioritized.”

Microsoft is now exploring solutions such as:

  • Advanced cooling technologies to reduce water intensity per compute unit
  • Use of recycled water in data centers where feasible
  • AI-driven energy and resource optimization to manage electricity and water demand

The company emphasizes that AI deployment must be balanced with sustainability practices, ensuring growth does not lead to unsustainable water consumption or carbon emissions.

Where Growth Meets Responsibility

Microsoft’s Q2 results show that growth and sustainability are connected. Investments in AI, cloud, and enterprise services boost revenue while increasing resource demand. The company’s carbon removal goals and energy-efficient data center plans help reduce environmental impacts.

Key metrics illustrate this balance:

  • Revenue growth of 9% year-over-year
  • Cloud revenue of $30.5 billion, up 12%
  • Carbon removal agreements totaling 45 million metric tons
  • Projected AI data center water increase of 150% by 2030

These initiatives demonstrate that Microsoft is trying to align profitability with long-term climate goals. Investing in clean technology, energy efficiency, and carbon removal shows that big companies can grow responsibly. This approach also helps reduce environmental impacts.

What Comes Next for AI, Climate, and Capital

Microsoft expects AI adoption to boost demand for:

  • Data center capacity
  • Cloud computing
  • Specialized hardware like GPUs

Analysts predict the global AI data center market could double by 2030, creating both financial and sustainability challenges.

The carbon removal market is also expected to expand. With 45 million tons already contracted, Microsoft’s continued leadership signals corporate influence in scaling carbon removal projects.

Forecasts show that voluntary carbon removal deals might exceed $15 billion each year by 2030. This growth is mainly due to tech companies, industrial firms, and financial institutions.

Water management in data centers is another critical area. Companies need to invest in better cooling and recycled water solutions to help meet rising demand while protecting local water resources. Microsoft’s transparency around water use provides a model for responsible AI deployment globally.

Overall, Microsoft’s earnings report not only reflects strong financial performance but also highlights the company’s sustainability leadership. Growth, carbon removal, and AI infrastructure are linked. They provide insights for companies like Microsoft trying to balance profit with environmental responsibility.

Royal Caribbean’s (RCL) Record 2025 Profits Meet Carbon Challenges of the Cruise Industry

Royal Caribbean Cruises Ltd. (NYSE: RCL) kicked off 2026 with strong financial results for 2025. The company’s success reflects a broader recovery and growth in the global cruise industry. Alongside financial gains, the industry faces growing scrutiny over environmental impact. 

Cruise ships are highly carbon-intensive per passenger, prompting major lines—including Royal Caribbean, MSC, Carnival, and Norwegian Cruise Line—to invest in cleaner fuels, energy-efficient technologies, and shore power solutions. 

This article looks at the cruise sector’s financial health, passenger growth, and environmental issues. It also discusses how companies are working to balance profits with sustainability.

Smooth Sailing: 2025 Profits and 2026 Outlook

Royal Caribbean Cruises had solid financial results in 2025 and a positive outlook for 2026. The company made nearly $18 billion in revenue in 2025, up from about $16.48 billion in 2024.

Net income also grew to about $4.27 billion, compared with roughly $2.88 billion the year before. Adjusted earnings per share (EPS) rose to $15.64, showing improved profitability.

Royal Caribbean Cruise financial results 2025
Source: Royal Caribbean Cruises

The company also generated a strong operating cash flow of about $6.4–6.5 billion and returned around $2 billion to shareholders during the year. Record cruise bookings and higher ticket prices helped drive these results.

Royal Caribbean’s board expects double-digit revenue growth in 2026, along with higher capacity. Adjusted EPS is projected between $17.70 and $18.10. Around two-thirds of 2026 cruise capacity is already booked at strong pricing, supporting this forecast.

Jason Liberty, the company CEO, remarked:

“2025 was an outstanding year, and the momentum is further accelerating into 2026… and we continue to see strong and growing preference for our leading brands and differentiated vacation experiences. We expect another strong year of financial performance with both revenue and earnings growing double digits, and we remain on track to achieve our Perfecta goals by 2027.”

After the earnings call, the company’s stock climbed over 6%, mainly due to strong 2026 guidance. 

Royal Caribbean Cruises RCL stock price

These results show not only a recovery from pandemic lows but also sustained demand for cruises. Analysts expect this trend to continue as global travel and premium leisure spending grow.

Passenger Waves: Cruise Industry Expansion and Emissions 

The global cruise industry is growing fast. Projections show over 38 million passengers by 2026, up from around 37.7 million in 2025. This growth follows strong momentum from 2024 and reflects overall travel trends.

cruise passengers outlook
Source: Cruise Lines International Association

Higher demand is encouraging cruise lines to add ships and expand routes. Royal Caribbean, for example, has ordered new Discovery Class vessels and is growing its river cruise segment with more ships planned through 2031. This shows long-term confidence in the market.

Carbon Wake: Cruise Emissions vs Other Travel

Cruising, however, has a higher environmental impact than many other types of travel. Cruise ships are among the most carbon-intensive forms of travel per passenger per distance traveled. This is because they need fuel not just to move but also to run cabins, restaurants, pools, and entertainment.

Even large, efficient cruise ships by Royal Caribbean emit around 250 grams of CO₂ per passenger-kilometer. That is higher than most long-haul flights or hotel stays. Onboard services and hotel-style energy use make cruises even more carbon-heavy.

For perspective:

  • A five-night cruise of 1,200 miles produces about 1,100 pounds (≈500 kg) of CO₂ per passenger.
  • A flight covering the same distance plus a hotel stay produces roughly 264 kg of CO₂ per person.

This means a cruise can generate about 2x the greenhouse gas emissions of an equivalent flight-and-hotel trip.

Trains and electric cars have much lower emissions per passenger. For example, traveling by national rail produces about 35 g CO₂ per kilometer, and international trains like Eurostar are even lower at 4.5 g CO₂ per kilometer.

The Carbon Footprint of Cruise Ship vs Major Travel Methods
Data source: Voronoi App

Other comparison insights:

  • Emissions per passenger-kilometer: Large cruise ships emit 0.43–0.65 kg CO₂, depending on occupancy and efficiency. Economy-class flights emit 0.15–0.20 kg, while high-speed rail is around 0.04 kg. Cruises can be 2–10x more carbon-intensive per passenger.
  • Fuel and technology impact: Using LNG instead of heavy fuel oil reduces CO₂ by 20–25%, but methane slip and upstream emissions can reduce gains. Air lubrication and optimized routing can cut fuel use by 5–10% per voyage.

Ship engines burn huge amounts of fuel. Amenities like air conditioning, theaters, pools, and restaurants add to the energy demand. Cruises remain a luxurious experience, but travelers should know that they usually have a higher carbon footprint than flights, plus hotels or land-based travel. This shows that while cruises are luxurious and convenient, they have a much higher carbon footprint than most other ways of traveling.

Cruise ships also emit sulfur oxides (SOx), nitrogen oxides (NOx), and fine particles, which can harm air quality in port cities and marine ecosystems. Many passengers also fly to and from cruise ports, adding more carbon emissions that are often not included in cruise footprint estimates.

How Cruise Lines Are Addressing Environmental Impact

Cruise companies, including Royal Caribbean, are working to reduce their environmental impact. Many aim to reach net-zero greenhouse gas emissions by 2050 or earlier.

Royal Caribbean’s Destination Net Zero strategy focuses on:

  • Alternative fuels: LNG-powered ships, biofuels, and fuel cell technology.
  • New ship technologies: Advanced hulls, air lubrication systems, and shore power connections.
  • Operational efficiency: Optimized routes and engine improvements to reduce fuel use per passenger.
Royal Caribbean Cruise emission reductions pathways
Source: Royal Caribbean Cruises

Other cruise lines are also taking action to tackle their environmental footprint: 

MSC Cruises used efficiency tools and smart itinerary planning to cut 50,000 tonnes of CO₂ in 2024. They are testing hybrid propulsion and shore power at multiple ports. Carnival Corporation is expanding LNG and biofuel use while increasing shore-side electrical connections. They are also researching carbon capture for ships.

Likewise, Norwegian Cruise Line (NCL) is adding LNG-powered ships, battery-assisted propulsion, and energy-efficient onboard systems. NCL is also expanding shore power at ports.

Disney Cruise Line uses hybrid exhaust gas cleaning, advanced wastewater treatment, and fuel-efficient hulls while eliminating single-use plastics onboard. Meanwhile, Princess Cruises applies energy-saving tech, waste reduction, and wastewater treatment, while testing LNG as a fuel alternative.

Overall, the cruise industry faces pressure to reduce carbon intensity. Cleaner fuels, new technologies, and operational efficiency are becoming standard. Environmental responsibility is now a key part of long-term business strategy.

Forecast Horizon: Growth, Finance, and Green Goals

Royal Caribbean and the cruise industry are financially strong. High bookings, growing revenue, and positive forecasts show that demand for cruises is rising. Investments in new ships and offerings aim to meet demand across different traveler groups.

Cruise forecasts show over 38 million passengers by 2026, highlighting ongoing interest. Electric and hybrid propulsion, shore power, biofuels, and fuel-saving technologies are slowly becoming standard.

Challenges remain. Reducing cruise carbon intensity to levels similar to other travel modes will require more alternative fuels, stricter rules, and continued innovation.

Still, many cruise lines have pledged net-zero targets, often aligned with global shipping goals. Passengers are also more aware of environmental impact, driving demand for greener cruises.

Balancing Growth and Emissions

Royal Caribbean’s strong earnings and positive outlook show a resilient and growing industry. Record bookings and strategic investments indicate financial health and long-term growth.

However, carbon emissions remain a major issue. Cruises generally produce more CO₂ per passenger than many other vacations. Cruising is also considered to emit the most emissions compared to other travel methods. Thus, the industry faces pressure to reduce this impact.

Understanding both the financial and environmental sides can help travelers make better choices. For cruise companies and policymakers, balancing growth with emissions reductions is key for the future of cruising.

The Carbon Credit Market in 2025 is A Turning Point: What Comes Next for 2026 and Beyond?

The global carbon credit market reached a clear turning point in 2025. Volumes declined. Prices rose. Buyer behavior shifted. Policy signals strengthened. At the same time, long-term commitments surged through record-breaking offtake deals.

These changes show a market moving away from scale at any cost. Instead, quality, integrity, and compliance eligibility now shape value. This article reviews the major trends that defined the carbon credit market in 2025 using various industry reports and explains what they mean for 2026 and beyond.

Why 2025 Marked a Turning Point for the Carbon Credit Market

For much of the past decade, growth in the voluntary carbon market was driven by volume. More credits were issued. More were retired. Prices stayed low. Quality concerns often came second.

That model no longer holds.

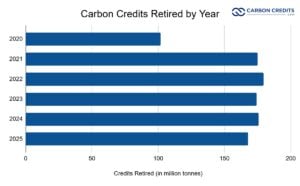
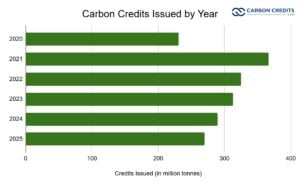
In 2025, total credit retirements fell to about 168 million tonnes, down 4.5% year on year, according to Sylvera report. New issuances also declined, reaching roughly 270 million tonnes, the lowest level since 2020. On the surface, this looks like a contracting market.

carbon credits retired 2025

carbon credits issued by year 2025
Data source: Sylvera

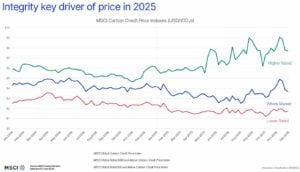
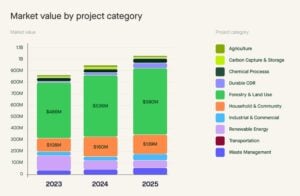
Yet market value moved in the opposite direction. Total spending on carbon credits rose to around $1.04 billion, up from about $980 million in 2024. The average price paid increased to roughly $6.10 per credit.

carbon credit price 2025 MSCI
Source: MSCI Carbon Markets

This shift matters. It shows that market growth is no longer tied to volume alone. Instead, it is driven by higher prices for credits seen as credible, durable, and compliant with future rules.

The reports point to two forces driving this change. First, buyers are paying more for higher-quality credits. Second, compliance-driven demand is starting to reshape the market. Together, these forces signal a transition toward a more structured and selective market.

Supply, Demand, Issuances, and Retirements: What Really Changed in 2025

The balance between supply and demand changed in important ways during 2025.

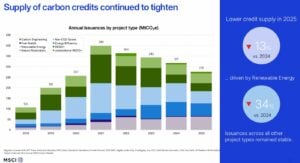
On the supply side, issuances declined across several major project types. Renewable energy credits saw the sharpest drop. These projects have long faced questions around additionality. Many buyers now see them as low impact. As a result, fewer new renewable credits entered the market.

carbon credit issued by project MSCI 2025
Source: MSCI Carbon Markets

Nature-based credits still dominate total volumes. Forestry and land-use projects remain the largest source of issued and retired credits. However, within this category, the mix is changing.

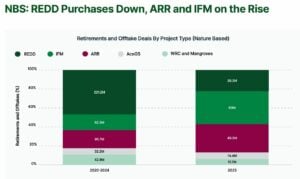
Buyers are moving away from older REDD+ projects and toward improved forest management, afforestation, reforestation, and agriculture-based projects. Allied Offsets data show the following mix:

nature based credits Allied Offsets
Source: Allied Offsets

On the demand side, retirements fell slightly, but this does not signal weakening interest. Corporate demand remained stable in terms of buyer count. What changed was how companies bought credits and what they were willing to pay.

Importantly, compliance use now accounts for about 23% of all retirements. Programs in California, Quebec, South Africa, and Chile contributed to this growth. This share is expected to rise as new compliance systems scale up.

Another key signal comes from inventory data. Credits rated BBB or higher have been in deficit since 2023. In 2025, this deficit continued for a third straight year. At the same time, lower-rated and unrated credits remained heavily oversupplied. Unrated credits alone added an estimated 88 million tonnes to inventory in 2025.

This split highlights a structural imbalance. The market does not lack the credits overall. It lacks the credits that buyers trust.

Nature, Tech, and Removals: The Credit Mix Evolves

The mix of credit types continued to rotate in 2025, reflecting buyer concerns about integrity and future eligibility.

  • Nature-based credits

Nature-based credits still make up the majority of market activity. However, not all nature credits are treated equally.

Legacy REDD+ projects lost market share. High-profile integrity concerns reduced buyer confidence. Prices weakened for lower-rated REDD+ credits. In contrast, well-rated afforestation and reforestation (ARR) projects gained ground. Buyers showed a clear preference for projects with stronger monitoring, permanence, and land tenure controls.

Agriculture-based credits also expanded. These projects often offer measurable co-benefits for soil health and livelihoods. Buyers increasingly value these attributes.

  • Technology-based avoidance credits

Credits from renewable energy projects continued to decline. Waste management, landfill gas, and industrial efficiency projects filled some of this gap. These projects often face lower additionality risks and clearer baselines.

  • Carbon removal credits

Carbon removal credits remain a small share of current retirements. In 2025, durable removals accounted for well under 1 million tonnes of issuances and retirements.

Yet removals are central to the market’s future. This is most visible in the forward market. Most large offtake deals focus on durable carbon removal, such as direct air capture, biochar, BECCS, and enhanced mineralization.

The CDR-focused report highlights why. Net-zero targets increasingly require removals to address residual emissions. Avoidance credits alone are not enough. This structural demand explains why removals command much higher prices and long-term commitments.

Prices, Quality Premiums, and What Buyers Are Paying For

Headline prices only tell part of the story.

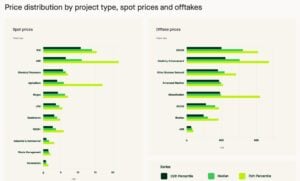
In 2025, the average spot price was around $6.10 per credit. But actual prices varied widely by project type, rating, and co-benefits.

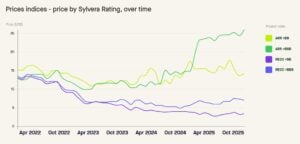
Afforestation and reforestation credits traded anywhere from $2 to over $50. Half of the ARR credits fell between $5 and $25. REDD+ credits showed similar dispersion but at lower levels. Quality became the main driver of these differences. For the first time, ratings were clearly embedded in pricing.

ARR projects rated BBB or higher averaged about $26 per credit. Lower-rated ARR projects averaged closer to $14. Unrated projects traded even lower. A similar pattern appeared in REDD+ credits.

carbon credit price by Sylvera rating
Source: Sylvera

Co-benefits added another layer. Projects with strong biodiversity or community outcomes earned clear price premiums. Buyers were willing to pay more for credits that delivered visible social and environmental value beyond carbon.

In the forward market, prices looked very different. Offtake agreements signed in 2025 implied average prices of around $160 per credit. These prices reflect the high costs and limited supply of durable removals, not spot market conditions.

The result is a two-tier market. One tier is a fragmented spot market with wide price ranges. The other is a concentrated forward market built around high-integrity removals.

Investments and Movers: Who’s Driving the Market

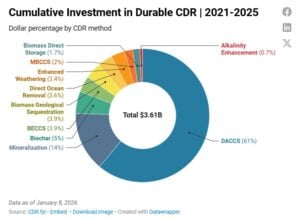
Private investment in carbon removal companies between 2021 and 2025 reached approximately $3.6 billion, with direct air capture (DAC) attracting the largest share of capital over that period.

Cumulative Investment in Durable CDR by CDR.fyi
Source: CDR.fyi

However, investment activity contracted in 2024 and continued into 2025, even as offtake deals expanded. This highlights a gap between commercial commitments and early‑stage funding scaling.

Major Corporate Buyers and Retirees

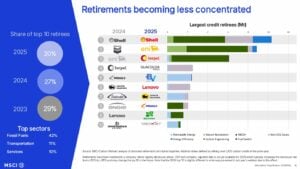
Corporate engagement shapes much of the 2025 retirement landscape. Several household names emerged as significant purchasers and retirees:

  • Microsoft remained the single largest buyer of carbon removal credits, accounting for over 90% of removal volume in the first half of 2025.
  • Energy and utility firms accounted for a sizable portion of total retirements, as indicated in broad market data on retiree sectors.
  • While comprehensive ranked data for all major buyers in 2025 is not fully disclosed publicly, MSCI analysis of prior data indicates that energy companies, transport firms, and services sectors have historically been among the top retirees when disclosure is available.

credit retirees company MSCI

Regional retirements also suggest significant corporate participation from Asia, Europe, and North America. This reflects global corporate climate commitments. 

Offtake Spotlight: Forward Deals Speak Louder Than Volumes

Offtake agreements were one of the clearest signals of future market direction in 2025.

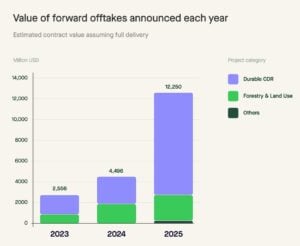
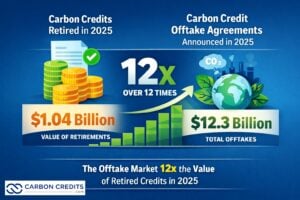
The total value of offtake deals announced during the year reached about $12.25 billion, up from roughly $4 billion in 2024. This is more than 12 times the value of credits retired in the spot market.

Carbon credit offtake infographic
Data source: Sylvera

Yet the volumes involved remain modest. These deals are expected to deliver around 10 million credits per year through 2035. That is less than 10% of current annual retirements.

This gap matters. It shows that buyers are willing to commit large sums to secure limited volumes of high-quality supply. A small group of buyers dominates this space. Microsoft alone accounted for the vast majority of durable removal offtake volume in 2025.

These agreements serve two purposes. They secure future supply in a tight market. They also send strong price signals. If even a fraction of spot market demand shifts toward similar quality thresholds, total market value could grow significantly without higher volumes.

Integrity Meets Policy: Compliance and Ratings Reshape Value

Integrity concerns shaped much of the market’s evolution in 2025.

Buyers are no longer satisfied with claims alone. Ratings, improved methodologies, and third-party assessments now influence decisions. This shift is reinforced by policy.

Compliance and voluntary markets are converging. Credits that can meet compliance rules often command higher prices. This is especially true for credits eligible under CORSIA or aligned with ICVCM’s Core Carbon Principles.

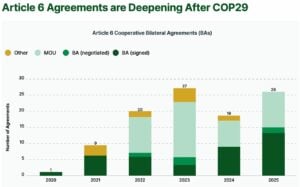
In 2025, nearly half of all credits issued came from methodologies potentially eligible for CORSIA. This share continues to rise. At the same time, Article 6 moved from theory to practice. Twenty new bilateral deals were signed in 2025, bringing the total to over 100 agreements.

article 6 agreements AlliedOffsets
Source: AlliedOffsets

Moreover, corresponding adjustments emerged as a central issue. Credits with a corresponding adjustment are now clearly differentiated from those without. This distinction affects pricing, eligibility, and long-term demand. Some analysts expect corresponding adjustments to become a tradable element of the market.

Policy signals also strengthened corporate demand. Draft updates to the SBTi Net-Zero Standard clarified how credits can be used alongside emissions reductions. This reduced uncertainty for buyers planning long-term strategies.

The Outlook for 2026 and Beyond

The near-term outlook points to a tighter and more complex market.

In 2026, supply constraints for high-quality credits are likely to persist. New issuances are not rising fast enough to meet demand for BBB+ credits. Prices for trusted nature-based projects are likely to remain firm or increase.

Compliance demand will continue to grow. Modeling suggests compliance use could exceed voluntary demand as early as 2027, driven by CORSIA Phase 1 and expanding domestic systems. By the mid-2030s, domestic compliance markets could become the largest source of demand.

Carbon removal credits will remain scarce in the short term. Actual retirements will lag commitments. However, investment and offtakes signal strong long-term growth. As methodologies mature and costs fall, removals will play a larger role in both voluntary and compliance settings.

The carbon credit market in 2025 did not collapse. It restructured.

For the market as a whole, the direction is clear. Volume alone no longer defines maturity. Quality, integrity, and policy alignment do. Buyers became more selective and prices began to reflect integrity. Policy moved closer to implementation. Offtake deals revealed long-term expectations.

The carbon credit market of 2026 and beyond will likely be smaller in volume than past projections, but higher in value, more regulated, and more closely tied to real climate outcomes.

Tesla Reports First-Ever Annual Revenue Drop in 2025, Carbon Credit Sales Also Dip 28%

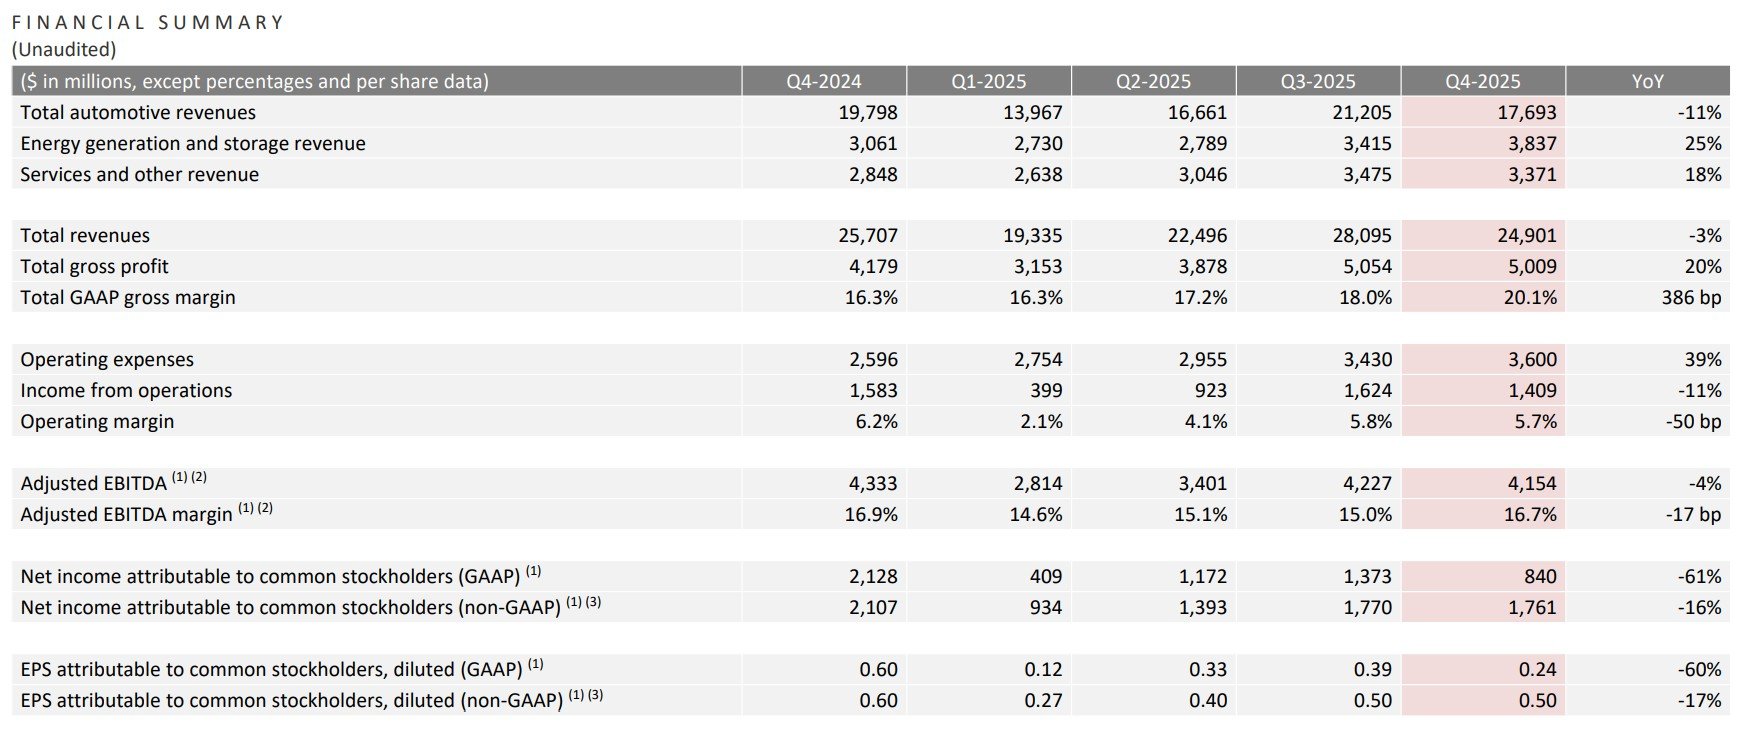
Tesla, Inc. released its fourth-quarter and full-year 2025 earnings on January 28, 2026, showing a mixed financial picture. Revenue exceeded market expectations slightly. However, profits dropped due to weaker vehicle demand and tighter margins.

For the fourth quarter, Tesla reported revenue of about $24.9 billion, a small beat versus analyst forecasts. However, this figure was around 3% lower year over year, reflecting slower growth in global electric vehicle (EV) deliveries. Adjusted earnings per share reached $0.50, down by nearly double digits compared with the same quarter last year.

Tesla Q4 2025 and full-year 2025 financial results
Source: Tesla

For the full year, Tesla posted total revenue of around $94.8 billion, marking its first annual revenue decline. Sales fell by about 3% year over year, mainly due to price cuts, higher competition, and softer demand in key markets. Net income dropped, and operating margins got tighter. Production costs and pricing pressure hurt the results.

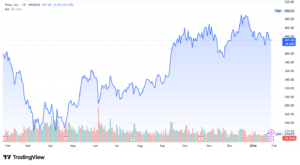
Despite these challenges, Tesla shares moved higher by 3% in after-hours trading. Investors seemed less worried about short-term struggles. Instead, they focused on the company’s long-term strategy, which goes far beyond just vehicle sales.

Tesla TSLA stock price

Strategic Shifts Beyond EVs: Vision for AI, Robotaxis, and Optimus

During the earnings call, Tesla Chief Executive Officer, Elon Musk, highlighted the company’s shift into a technology and energy platform. He noted several initiatives that are expected to shape Tesla’s next phase of growth.

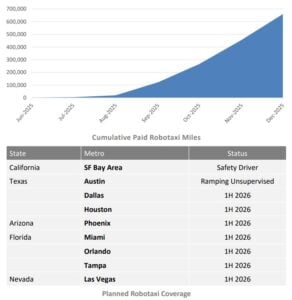
One major focus is autonomous mobility. Tesla continues to prepare for the launch of its Cybercab robotaxi, which the company positions as a future driver of high-margin, recurring revenue. Musk also talked about Optimus, Tesla’s humanoid robot. It’s still in early development, but key to their long-term vision.

Tesla robotaxi plans
Source: Tesla

Musk stated:

“As we increase vehicle autonomy and begin to produce Optimus robots at scale, we are making very big investments. This is going to be a very big CapEx year, as we will get into. That is deliberate because we are making big investments for an epic future. I think all these investments make a lot of sense…But it’s a lot of things. Major investments in batteries and the entire supply chain of batteries. We are also going to be significant manufacturers of solar cells, and we are making massive investments in AI chips.”

Artificial intelligence also featured prominently. Tesla confirmed a $2 billion investment in xAI, Musk’s artificial intelligence venture. The investment reflects the company’s growing emphasis on AI systems that support autonomy, robotics, and advanced software applications.

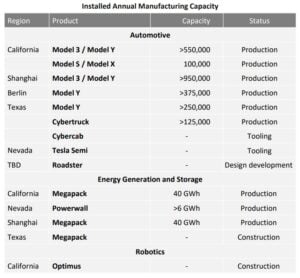
At the same time, Tesla’s energy generation and storage business remains a key growth area. The company is expanding its battery storage systems. These systems thrive on rising electricity demand, grid instability, and the push for renewable energy. While this segment still represents a smaller share of total revenue, it provides diversification at a time when automotive sales face pressure.

Tesla energy generation and storage
Source: Tesla

These initiatives show Tesla’s plan to rely less on vehicle sales. The EV giant aims to create new revenue streams to support long-term profitability.

Carbon Credit Revenue: From Record Highs to Slower Growth

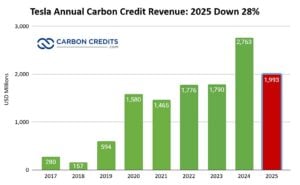
Tesla’s regulatory or carbon credit revenue fell in 2025 from 2024. However, quarterly data reveals significant changes throughout the year that impacted margins.

In Q1 2025, carbon credit sales fell to $595 million, a 14% decline quarter over quarter. This drop reduced margin support at a time when vehicle pricing pressure remained high.

The decline accelerated in Q2 2025, when Tesla reported $439 million, down 26% from Q1. The weaker credit contribution coincided with continued margin compression in the automotive segment.

In Q3 2025, credit revenue slipped further to $417 million, a 5% sequential decline. This marked the lowest quarterly level of the year. With fewer credits available, Tesla relied more heavily on vehicle sales and cost controls to protect margins.

In Q4 2025, regulatory credit revenue rebounded to $542 million, a 30% increase from Q3. This recovery provided year-end margin support and helped offset weaker automotive profitability. The rebound suggests higher compliance-driven demand late in the year.

Tesla carbon credit revenue 2025

Even with the Q4 boost, Tesla’s total regulatory credit revenue for 2025 was still far below 2024, down 28%. That year, Tesla made a record $2.76 billion from credit sales. The 2025 pattern shows lower volumes and greater volatility.

Tesla’s regulatory credits are sold to other automakers that do not meet emissions requirements. These buyers are typically large, global manufacturers such as Stellantis, Toyota, Ford, Mazda, and Subaru.

The EV maker has confirmed its role in carbon credit pooling. This means it shares emissions credits with other automakers. This helps them meet regional rules, especially in Europe. Tesla sells extra zero-emission credits to partner automakers under pooling agreements. In return, they receive payments. 

The 2025 data shows that carbon credits are still high-margin and important. However, they no longer provide steady support each quarter. Their effect on operating margin now relies on timing, regulatory cycles, and year-end compliance needs, not steady growth.

A Shifting Financial Landscape: What Earnings Say About Tesla’s Model

Tesla’s latest earnings underline a clear shift in its financial structure. In the past, carbon credit sales helped offset lower vehicle margins and protected profitability. As those credits decline, Tesla must rely more heavily on its core operations and emerging businesses.

The automotive segment continues to face pressure from competition, pricing strategies, and uneven global demand. While Tesla remains one of the world’s largest EV producers, the market has matured, and growth rates have slowed.

At the same time, new business lines such as energy storage, software, autonomy, and AI offer potential upside. Yet, many of these segments require significant investment and may take years to deliver consistent profits.

From a financial perspective, Tesla’s earnings report highlights a transition phase. Short-term results reflect margin compression and revenue contraction. Long-term performance hinges on new technologies. They must scale up and produce a steady cash flow, especially as regulatory credit income decreases.

Driving Sustainability: EVs, Batteries, and Tesla’s Role in Net-Zero

Sustainability is a key part of Tesla’s identity and long‑term plan. The company says its mission is to accelerate the world’s shift to clean energy. It focuses on EVs, energy storage, and renewable integration — all aimed at cutting greenhouse gas emissions.

Tesla’s EVs help reduce emissions by replacing internal combustion engine cars. According to Tesla’s 2024 impact figures, each Tesla user avoided around 35 million metric tons of CO₂ equivalent over 17 years. 

Tesla EV emissions reductions
Source: Tesla

Carbon credits form part of this sustainability ecosystem. By selling credits, Tesla helps other automakers comply with emissions regulations, indirectly supporting lower sector-wide emissions. However, as more manufacturers electrify their fleets, the need for such credits naturally declines.

Battery storage is another part of Tesla’s sustainability work. In 2025, Tesla deployed the highest energy storage, which supports clean energy grids and renewable expansion. Its Powerwall and Megapack units help balance power systems and reduce reliance on fossil fuels.

Tesla has not publicly stated a formal corporate net‑zero target year as some peers do. However, it continues to report on lifecycle emissions, energy efficiency, and avoided emissions in its impact reporting. The company is also working to improve manufacturing, recycling, and supply chain transparency.

As the EV market evolves, Tesla’s role may shift. Carbon credit sales are likely to shrink as more automakers electrify their fleets, and fewer credits are needed. Instead, Tesla’s direct emissions reductions — through cleaner vehicles, grid‑scale storage, AI, and energy products — could become more important in helping global decarbonization. 

Why South Africa’s Verra-Certified Grassland Carbon Credits Matter for Voluntary Markets

In Cape Town, a carbon credit issuance from restored grasslands has quietly set a global precedent. The Grassland Restoration and Stewardship in South Africa (GRASS) project has issued 266,255 verified carbon units, becoming the first project worldwide to earn the Climate, Community and Biodiversity (CCB) label under Verra’s updated VM0042 methodology.

Developed by carbon project specialist TASC, the initiative focuses on degraded grasslands managed largely by communal livestock farmers. These landscapes, often overlooked by investors, now sit at the centre of a high-integrity carbon model that could shape how future African projects are designed and judged.

This milestone reaches far beyond South Africa. Voluntary carbon markets face rising pressure as buyers question credibility, communities demand fairer benefits, and standards tighten. Against this backdrop, GRASS stands out as a rare land-based project that pairs rigorous measurement with long-term climate value and real gains for rural communities.

South Africa’s Grasslands Face a Quiet Crisis

Grasslands cover vast areas of South Africa. Around 34 million hectares support livestock farming, forming one of the country’s most important rural economies. Yet decades of overgrazing, unmanaged fires, and weak institutional support have taken a heavy toll. Roughly a third of these grasslands are now severely degraded.

Climate change has intensified the pressure. Droughts are more frequent. Rainfall is less predictable. Soil health has declined. Productivity has suffered. Communal farmers, who collectively own about half of South Africa’s livestock, remain marginalised in formal markets. Despite their scale, they supply only around 9 percent of national meat output.

This gap reflects structural barriers rather than a lack of land or labour. Limited access to training, veterinary services, finance, and consistent routes to market has locked many farmers out of value chains. GRASS was designed to work within these realities, not around them.

How the GRASS Project Works

GRASS is built around improved grassland and livestock management. The project applies regenerative practices such as adaptive grazing, better fire management, and active monitoring of soil and vegetation. These changes help rebuild grass cover, increase soil carbon, and improve the resilience of rangelands.

The project operates as a group model. Multiple Project Activity Instances, or PAIs, can join under a single framework. The first PAI focuses on communal livestock farming systems, where land tenure is complex and collective decision-making is essential. More recently, TASC expanded the project to include private, commercial farmers.

Significantly, GRASS was the first project registered globally under Verra’s VM0042 methodology, which is specifically designed for improved agricultural land management. This methodology requires detailed soil carbon measurement and includes safeguards to prevent emissions leakage. It reflects the latest thinking on how to quantify carbon outcomes from land-use change credibly.

A Landmark VCU Issuance Under Stricter Rules

During its first monitoring period from 2021 to 2023, GRASS generated 266,255 verified carbon units across more than 95,000 hectares of communal rangeland. The area overlaps with nine key biodiversity zones, including parts of the Maputaland-Pondoland-Albany hotspot.

What makes this issuance special is the CCB label. It confirms that the project delivers measurable climate benefits while also supporting communities and biodiversity. Under the updated VM0042 rules, GRASS is the first project to earn this combined certification.

For buyers, this matters. They want credits that are real, long-lasting, and socially responsible. GRASS meets these standards through strong monitoring and transparent governance.

carbon credits grassland south africa
Source: Sylvera

Community Livelihoods at the Centre

During the first monitoring period, about 4,000 communal farmers joined GRASS and helped manage the land that generated the initial credits. Nearly 300 people also gained work in ecological monitoring, grazing support, and fire management, which matters in areas with few formal jobs.

Carbon revenues flow through a community trust, ensuring income reaches local communities instead of being captured by developers. While carbon payments alone are not transformative, they help cover the costs of improved land management.

Market access has driven much of the project’s early impact. Through a partnership with Meat Naturally Africa, farmers received training and gained access to mobile auctions and abattoirs. These linkages generated about ZAR56.4 million (roughly $3.35 million) in additional revenue from livestock and wool sales, helping households stabilize income amid rising climate risk.

Employment, Skills, and Local Resilience

As GRASS expanded, it created around 900 jobs across communal rangelands, with nearly one-third held by women. Roles include ecological rangers, grazing coordinators, and data collectors.

The project builds technical skills locally, offering training in fire management and invasive species control. This helps protect ecosystems and reduces the need for outside contractors.

GRASS also works through existing communal governance structures. By strengthening local decision-making and ensuring transparent benefit sharing, it lowers the risk of conflict—an issue that often affects land-based carbon projects in Africa.

TASC is Scaling Grassland Restoration Without Losing Integrity

Today, GRASS spans about 950,000 hectares of communal and private rangeland, placing it among the largest grassland restoration initiatives globally. The communal component alone covers more than 600,000 hectares and is expected to expand to one million hectares over time.

TASC plans to scale the project to two million hectares by 2030. At that level, GRASS could sequester or avoid nearly two million tonnes of carbon dioxide equivalent each year. Over its 100-year commitment period, the project targets the mitigation of around 14 million tonnes within its first 30 years.

These figures are modest compared to national emissions. However, they highlight the cumulative potential of land-use interventions when applied consistently and at scale. They also show that community-managed landscapes can meet some of the world’s most demanding carbon standards.

What This Means for African Carbon Markets

Many African countries see carbon markets as a source of climate finance. Yet progress has been uneven. Concerns over land rights, benefit sharing, and long-term stewardship have slowed investment. Some projects have promised more than they delivered, eroding trust.

The South African grasslands example offers a different path. It shows that community-led projects can achieve high-integrity certification while delivering measurable economic returns locally. It also demonstrates that rigorous methodologies and social safeguards need not limit scale.

As scrutiny of voluntary carbon markets intensifies, examples like GRASS may shape future expectations. Buyers, regulators, and communities alike are shifting their focus from promises to outcomes. Projects that cannot show real climate, social, and biodiversity benefits may struggle to find support.

In that context, GRASS stands out. Not as a silver bullet, but as proof that carbon finance, when designed carefully, can restore ecosystems, strengthen rural livelihoods, and deliver credible climate mitigation at the same time.

DevvStream and UAE Platform’s Alliance Targets $100M Carbon Investment by 2027

A Canadian carbon management company, DevvStream Corp., and a United Arab Emirates (UAE) investment platform have joined forces to launch a new climate investment vehicle. The goal of the partnership is to build a US$100 million fund by the end of 2027 to invest in environmental assets. These include carbon solutions, decarbonization, and technologies that support the global energy transition.

The new vehicle, called the Fayafi x DevvStream Investment Platform, seeks to bring in capital. It will help scale impactful projects in various carbon and climate initiatives. DevvStream’s carbon asset know-how and Fayafi’s financial strength will team up. They will build a global investment engine for environmental infrastructure and carbon solutions.

Inside the Fayafi–DevvStream Investment Platform

DevvStream and Fayafi Investment Holding Limited, based in the Dubai International Financial Centre (DIFC), have signed an investment agreement. They will create a jointly governed special purpose vehicle (SPV).

The SPV’s main objective is to pursue scalable, high-impact decarbonization opportunities. It is targeted to reach $100 million in capital commitments by 2027, though this remains a non-binding target rather than a guarantee.

The vehicle will focus on several areas, including:

  • Environmental infrastructure,
  • Carbon credit solutions and monetization,
  • Climate-related technologies

Fayafi is expected to hold 80% of the economic interest in the SPV, while DevvStream will hold 20%. Most profits from investments and carbon credit revenues are expected to go to Fayafi. The rest will be distributed to DevvStream.

An Investment Committee with representatives from both partners will review and approve funding decisions. A Fayafi representative will serve as Chair of this committee. DevvStream will charge a one-time setup fee once the platform is approved. It will also receive ongoing consulting fees based on a percentage of assets used in the fund.

Why This Deal Matters for Carbon Markets

The launch of the Fayafi x DevvStream Investment Platform comes at a time when carbon markets and environmental assets are gaining traction. More companies, governments, and investors want to fund climate solutions. They are looking for options beyond just cutting emissions. Projects related to carbon capture, carbon markets, clean energy, and decarbonization infrastructure are drawing interest from a wider set of financial players.

DevvStream itself specializes in handling, aggregating, and monetizing environmental assets such as carbon credits and renewable energy certificates. This lets the company handle and create climate investments within larger sustainability plans.

Carbon credits are units that represent a reduction or removal of greenhouse gas emissions. They can be bought and sold in voluntary and compliance markets.

Carbon credit demand is set to rise. Companies aim for net-zero targets, and regulators are tightening rules on climate reporting and carbon offsets.

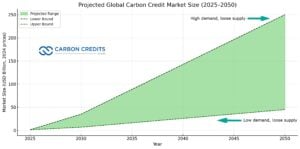
projected global carbon credit market 2050

The chart shows the projected global carbon credit market size from 2025 to 2050. The green range shows lower and upper bounds, reaching $50–$250 billion by 2050 (2024 prices). Growth depends on demand: high demand with loose supply drives the market to the upper bound, while low demand with loose supply results in the lower bound.

Another projection says it could reach up to $270 billion by 2050This prediction of market growth reflects the rising corporate demand for nature-based and technology-based environmental asset solutions. DevvStream and Fayafi are building platforms to tap into this growing market. They focus on linking finance with clear climate results.

DevvStream’s Expanding Role in Climate Assets

DevvStream started in 2021. It focuses on carbon management and monetizing environmental assets. The company works across three strategic domains:

  1. Carbon offset portfolios: including nature-based, tech-based, and carbon sequestration credits for sale to corporations and governments.
  2. Project investment and acquisition: helping to extend its reach into broader environmental markets.
  3. Project development services: where it structures and manages eligible climate and sustainability activities in exchange for a percentage of generated credits.

This model allows DevvStream to provide full support, from project development to monetization. By teaming up with Fayafi to scale investments, the company can boost its opportunities and increase steady revenue from advisory and asset management roles.

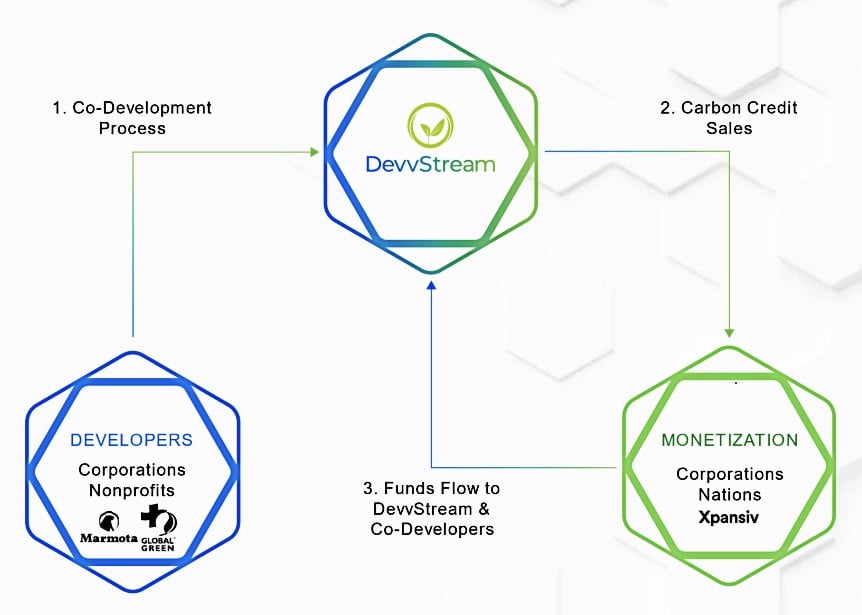
Devvstream carbon credit process
Source: Devvstream

DevvStream has also been active in other strategic moves. In late 2025, it teamed up with Southern Energy Renewables and agreed to merge into a Nasdaq-listed company. This new company will focus on producing low-cost, carbon-negative fuels like sustainable aviation fuel (SAF) and green methanol.

The plan features a $402 million bond allocation for a biomass-to-fuel facility in Louisiana. This move will boost the company’s role in carbon-negative industries.

Market Forces Powering Climate Capital

Many market trends are shaping the launch of climate investment vehicles that DevvStream and Fayafi are creating. 

Corporate net-zero commitments are a major driver. Many multinational companies now aim to reach net-zero greenhouse gas emissions by 2050 or sooner. To meet these goals, they mix direct emissions cuts with clean energy buying. They also purchase environmental assets like carbon credits. This corporate demand boosts liquidity. It also supports investment platforms that create and manage climate-aligned assets.

Policy changes and ESG reporting standards are also pushing growth. Governments and regulators in developed and emerging markets are improving climate reporting rules. This trend increases the demand for verified environmental assets that help firms demonstrate progress toward emissions targets.

Another key trend is the rise of carbon markets themselves. Both compliance markets (such as the EU Emissions Trading System) and voluntary markets are expanding. Voluntary markets have challenges with pricing and standardization.

Still, they are vital for companies looking to offset and eliminate residual emissions. Research shows that the ecosystem for environmental asset investment is growing. This growth opens doors for financial products that blend climate impact with returns.

Climate Finance Market: Size, Trends, and Outlook

Global climate finance continues to expand, but it still falls short of what is needed. In 2024, global climate finance flows reached over $1.8 trillion in 2023 and will surpass $2 trillion in 2024, based on Climate Policy Initiative (CPI) data. Most of this funding goes to clean energy, transport, energy efficiency, and climate-resilient infrastructure. Private investors now provide more than half of total climate finance.

Despite this progress, the funding gap remains large. Analysts estimate that annual climate investment must rise to $5 trillion to $7 trillion by 2030 to meet global climate goals. This means current funding would need to increase several times within the next few years.

global climate finance investment gap CPI

Carbon markets form a smaller but growing part of climate finance. Most future growth is expected in emerging markets, where mitigation costs are lower but access to capital is limited. This has increased interest in structured climate investment vehicles.

In this context, initiatives like DevvStream’s joint platform targeting $100 million by 2027 reflect a broader push to channel private capital into scalable carbon mitigation projects and close global climate finance gaps.

What This Deal Means for Climate Finance

The Fayafi x DevvStream Investment Platform will target:

  • Environmental infrastructure
  • Carbon solutions
  • Technologies that support climate goals

This initiative fits with the growing trend in sustainable investing. Corporations, governments, and financial firms are putting more money into environmental assets. They aim to meet net-zero goals. Though achieving a $100 million target is still a forecast, this partnership is a big step in climate finance growth.

Carbon Credit Offtakes Surge in 2025: What the $12B Says About the Future Market?

Offtake agreements became one of the strongest signals in the carbon credit market in 2025. While spot market activity slowed, long-term commitments surged. These deals revealed how buyers think about future supply, quality, and risk.

The contrast is striking. The spot market remains large in volume but low in value. The forward market is small in volume but very high in value. This gap tells an important story about where the carbon credit market is heading.

A Record Year for Offtake Value, Not Volume

In 2025, companies announced carbon credit offtake agreements worth about $12.25 billion, according to Sylvera’s report. This was a sharp increase from around $3.95 billion in 2024. It was also more than 12x the value of credits retired on the spot market during the same year.

Carbon credit offtake infographic
Data source: Sylvera

This growth did not come from higher volumes. The total credits covered by these deals amount to roughly 78 million tonnes, spread across many years. On average, these agreements are expected to deliver only about 10 million credits per year through 2035.

To put this in context, the spot market retired about 168 million credits in 2025 alone. This means offtakes represent less than 10% of current annual retirements.

carbon credit offtakes annual 2025 Sylvera
Source: Sylvera

This mismatch matters. It shows that the forward market is not about scale today. It is about securing future supply that meets higher standards. Buyers are not chasing large volumes. They are targeting specific credit types with strong integrity signals.

The value growth reflects high carbon prices, not high quantities. The weighted average price implied by offtake deals in 2025 was around $160 per credit. This is far above the spot market average of roughly $6 per credit.

carbon prices spot vs offtake
Source: Sylvera

Why Buyers Are Willing to Pay a Premium Upfront

The forward market price premium reflects several structural factors.

  • Carbon removals dominate offtake deals: 
    Most credits covered by offtake agreements are carbon removal credits, not avoidance credits. These include direct air capture, biochar, BECCS, and mineralization. These technologies are costly and still scaling.

  • Net-zero targets drive long-term planning:
    Companies face growing pressure to meet net-zero goals. Many now acknowledge that emissions cuts alone will not eliminate all emissions. They expect to use removals to address residual emissions in the 2030s and beyond.

  • Future supply remains uncertain:
    Few carbon removal projects operate at a commercial scale today. Delivery risks remain high. Offtake agreements help buyers reduce exposure to future shortages and price spikes.

  • Policy signals reinforce buyer behavior:
    Updated guidance from standard setters and the expansion of compliance markets point to rising demand for high-integrity credits. Buyers anticipate stronger competition for a limited supply.

As a result, buyers accept high prices today to manage future risk. These prices reflect expected scarcity, not current market conditions.

A Highly Concentrated Landscape: Few Players, Big Moves

The offtake market in 2025 was not broad-based. It was highly concentrated.

A small group of buyers accounted for most of the value and volume. Among them, Microsoft dominated the durable carbon removal market. The company accounted for about 85% of the total durable removal offtake volume announced in 2025.

carbon credit offtake announced annual by buyer
Source: Sylvera

Other large buyers included technology firms, energy companies, and buyer coalitions such as Frontier. However, the overall number of active offtakers remained limited. Estimates suggest only 100 to 200 buyers participated meaningfully in the forward market.

This concentration reflects both cost and complexity. Offtake agreements require long-term commitments, strong balance sheets, and the ability to manage delivery risk. Many companies are not ready to take on these challenges.

In contrast, the spot market remains much broader. It involves thousands of buyers and a wide range of project types. Prices are lower. Entry barriers are minimal.

This divide suggests that the forward market is not replacing the spot market. Instead, it operates alongside it, serving different needs and buyers.

What the Volume Gap Tells Us About Market Structure

The gap between offtake value and volume sends a clear signal about market structure.

The carbon credit market does not suffer from a lack of credits overall. Instead, it suffers from a lack of credits that buyers trust for future use.

Inventory data supports this view. Credits rated BBB or higher have been in deficit since 2023. In 2025, this deficit continued for a third year. Lower-rated and unrated credits, by contrast, remained heavily oversupplied.

Offtake buyers focus almost exclusively on the scarce segment. They prefer credits with strong durability, clear additionality, and future compliance potential. Many of these credits do not yet exist at scale.

This explains why high prices do not translate into high volumes. Project developers face long development timelines. New technologies require capital, permitting, and verification. Nature-based removal projects also take years to mature.

As a result, the forward market reflects future expectations, not current supply. It prices scarcity before it appears in the spot market.

What Offtakes Signal for 2026 and Beyond

Offtake agreements offer several insights into the near-term outlook.

  • First, they suggest that quality premiums will persist. Even if spot prices remain low for lower-quality credits, prices for high-integrity projects are likely to rise. Buyers are already anchoring expectations at much higher levels.
  • Second, they show that carbon removal credits will shape long-term demand, even if near-term retirements remain small. Investment and offtake activity indicate confidence that removals will play a central role after 2030.
  • Third, they highlight growing competition between voluntary and compliance demand. As markets converge, credits eligible for compliance use may attract both types of buyers. This will further tighten supply for premium projects.
  • Fourth, they suggest that the total market value could grow without higher volumes. If even a small share of spot market demand shifts toward higher-priced credits, overall spending could increase significantly.

However, risks remain. Delivery delays, policy uncertainty, and technology challenges could slow progress. The forward market remains narrow and exposed to concentration risk.

For now, offtakes function as a price and preference signal, not a volume driver. They show where the market wants to go, even if it cannot get there yet.

The offtake buyer behavior reflects bigger changes in how companies view carbon credits. Price alone no longer defines value. Credibility, durability, and future eligibility now matter most.

As the market moves into 2026, offtake agreements will continue to shape expectations. They do not replace the spot market, but they signal where demand, pricing, and strategy are heading in the years ahead.