LATEST ARTICLES

Thacker Pass Is Being Built: Here Is Why That Is the Best News NILI Investors Have Heard All Year.

Disseminated on behalf of Surge Battery Metals.

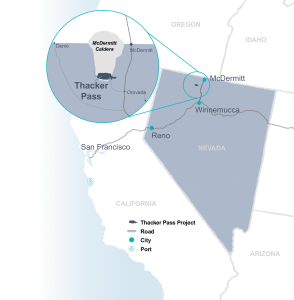
Lithium Americas (LAC) has officially broken ground at Thacker Pass, Nevada. The project is advancing toward its first production target in 2028. LAC CEO Jonathan Evans said in the companyโ€™s news release that the project should be mechanically complete by the end of 2026. Commissioning will happen through 2027, with commercial production starting in 2028.

For investors watching Nevada clay lithium, this milestone is more than an update. Itโ€™s a market signal that could change the investment landscape.

De-Risking the Clay Lithium Category

For years, clay-based lithium has faced a single recurring objection: โ€œIt has never been done at a commercial scale.โ€ Unlike brine or hard-rock lithium, sedimentary clay deposits presented a technological and operational unknown. Investors and lenders were cautious, capital costs were higher, and early-stage projects struggled to secure financing.

Thacker Pass changes that narrative. Once LAC makes battery-grade lithium carbonate from sedimentary clay at a commercial scale, it reduces risks for the whole category. Projects in Nevada now have clear proof that clay-based lithium can be mined and processed effectively.

The historical precedent is instructive. In Chile’s Atacama region, the first brine lithium projects proved the chemistry and cost-effectiveness of large-scale lithium extraction. Later projects attracted capital more easily and on better terms. This created a ripple effect, speeding up the region’s lead in global lithium supply.

Thacker Pass is playing that same role for sedimentary clay. Its success is not just a win for LAC. It marks a key milestone for the whole Nevada clay lithium sector, including the Nevada North Lithium Project (NNLP) of Surge Battery Metals (TSX-V: NILI | OTCQX: NILIF).

Understanding the Technical Landscape

Thacker Pass Phase 1 has lithium levels of 1,500โ€“2,500 ppm. They plan to extract it using sulfuric acid leaching to create battery-grade lithium carbonate. The project is important both geographically and operationally.

It features a large pit, a big processing facility, and integrated infrastructure. This covers access roads, water supply management, and energy sources that meet Nevadaโ€™s rules.

Thacker Pass lithium mine project
Source: Lithium Americas

While Thacker Pass shows commercial viability, it is crucial to note that NNLP and Thacker Pass are not technically the same. NNLP employs a different beneficiation approach and reagent chemistry to optimize recovery.

NNLP: The Higher-Grade, Next-Generation Project

Thacker Pass shows clay lithium on a large scale. NNLP positions itself as the next evolution of this asset class, with clear geological advantages:

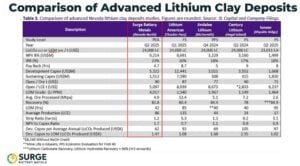
  • Grade: NNLP averages 3,010 ppm lithium, significantly higher than Thacker Pass Phase 1 material. Recent drilling results show that step-out drilling found a 31-meter intercept with 4,196 ppm lithium from surface. This gives NNLP a potential extraction advantage.
  • Strip Ratio: NNLPโ€™s 1.16:1 strip ratio is among the lowest in the sedimentary clay peer group. This indicates that it has favorable material movement requirements relative to ore recovered.
  • Operating Costs: NNLPโ€™s estimated OPEX is US$5,097/t LCE, lower than Thacker Pass guidance of ~US$6,200/t C1. It suggests that it has competitive economic positioning within the peer group.

Both projects produce battery-grade lithium carbonate using sulfuric acid leaching. However, each method is customized for the specific geology of the project. NNLP is not a copy of Thacker Pass. Rather, it is a next-generation clay project designed to leverage lessons learned while improving key parameters.

Surge lithium clay comparison

Moreover, infill drilling showed a steady, thick, high-grade core. It included intercepts like 116 meters at 3,752 ppm Li and 32 meters at 4,521 ppm Li. These results support future resource expansion. They also highlight the project’s scale, quality, and technical readiness as it prepares for a Pre-Feasibility Study.

Why Category De-Risking Matters for Investors

In emerging resource sectors, de-risking is often more valuable than the resource itself. Projects that validate a new extraction method or commodity unlock several market advantages:

  1. Lower financing risk: Investors are more willing to fund projects once proof of concept exists.
  2. Improved capital terms: Lending rates and equity expectations can improve when technology and economics are validated.
  3. Accelerated project development: Developers can move faster, reduce contingencies, and focus on optimization rather than proving viability.

Thacker Passโ€™s progress effectively removes the โ€œfirst-mover riskโ€ from sedimentary clay projects. NNLP has higher grades, near-surface mineralization, and competitive OPEX. Now, it can be assessed on its own merits, not on doubts about large-scale clay processing.

Strategic Significance in the U.S. Lithium Market
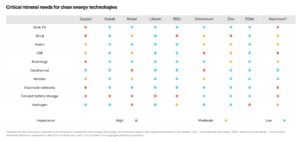
The timing of Thacker Passโ€™s construction and NNLPโ€™s development aligns with broader policy and market trends. Lithium is a critical input for electric vehicles, grid-scale storage, and advanced defense technologies. The U.S. government has emphasized domestic lithium production as a strategic priority.

In March 2025, President Trump signed an executive order called โ€œImmediate Measures to Increase American Mineral Production.โ€ This order directs federal agencies to speed up permitting and support domestic projects. It also aims to lessen dependence on foreign supply chains for critical minerals.

Projects like Thacker Pass and NNLP benefit from this policy. They provide secure domestic sources that boost the lithium supply chain.

Nevada is central to this strategy. Its clay deposits are among the largest and best in the U.S. They provide a stable base for domestic lithium production, which supports electrification goals and helps reduce reliance on imports.

Thacker Passโ€™s progress also sends a signal beyond the Nevada clay sector. It demonstrates that investors and capital markets are willing to back sedimentary clay projects at scale. That validation reduces perceived risk for future projects. It also speeds up permitting and development timelines as well as strengthens valuation metrics.

NNLP, with its superior grade and shallower resource, stands to benefit disproportionately. It is no longer constrained by questions of category viability. It can now be evaluated based on its geological quality, operational efficiency, and potential returns.

NNLP’s advantages, combined with the category de-risking effect of Thacker Pass, position it as a next-generation investment opportunity in Nevadaโ€™s clay lithium space.

Looking Ahead: Domestic Lithiumโ€™s Role in Energy Transition

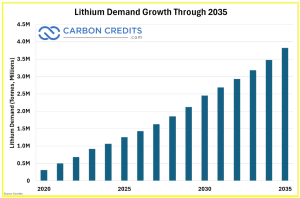
Lithium demand is set to grow rapidly as electric vehicles, battery storage, and renewable systems expand. Securing a high-quality, domestic supply is critical to maintaining U.S. leadership in clean energy technology.

lithium demand growth through 2035

Thacker Pass proves that commercial-scale sedimentary clay lithium is achievable. NNLP demonstrates the potential for even higher efficiency and superior economics within the same category. Together, these projects show how local resources can support the energy transition while providing compelling investment opportunities.

NNLPโ€™s higher grades, near-surface mineralization, low strip ratio, and competitive OPEX position it as a leading asset within a now-validated category.

For NILI investors, the message is clear: the clay lithium category is no longer theoretical, and NNLP is positioned to capitalize on the proof-of-concept success. The best news of the year is hereโ€”and itโ€™s grounded in both science and strategy.


DISCLAIMERย 

New Era Publishing Inc. and/or CarbonCredits.com (โ€œWeโ€ or โ€œUsโ€) are not securities dealers or brokers, investment advisers, or financial advisers, and you should not rely on the information herein as investment advice. Surge Battery Metals Inc. (โ€œCompanyโ€) made a one-time payment of $75,000 to provide marketing services for a term of three months. None of the owners, members, directors, or employees of New Era Publishing Inc. and/or CarbonCredits.com currently hold, or have any beneficial ownership in, any shares, stocks, or options of the companies mentioned.

This article is informational only and is solely for use by prospective investors in determining whether to seek additional information. It does not constitute an offer to sell or a solicitation of an offer to buy any securities. Examples that we provide of share price increases pertaining to a particular issuer from one referenced date to another represent arbitrarily chosen time periods and are no indication whatsoever of future stock prices for that issuer and are of no predictive value.

Our stock profiles are intended to highlight certain companies for your further investigation; they are not stock recommendations or an offer or sale of the referenced securities. The securities issued by the companies we profile should be considered high-risk; if you do invest despite these warnings, you may lose your entire investment. Please do your own research before investing, including reviewing the companiesโ€™ SEDAR+ and SEC filings, press releases, and risk disclosures.

It is our policy that information contained in this profile was provided by the company, extracted from SEDAR+ and SEC filings, company websites, and other publicly available sources. We believe the sources and information are accurate and reliable but we cannot guarantee them.

CAUTIONARY STATEMENT AND FORWARD-LOOKING INFORMATION

Certain statements contained in this news release may constitute โ€œforward-looking informationโ€ within the meaning of applicable securities laws. Forward-looking information generally can be identified by words such as โ€œanticipate,โ€ โ€œexpect,โ€ โ€œestimate,โ€ โ€œforecast,โ€ โ€œplan,โ€ and similar expressions suggesting future outcomes or events. Forward-looking information is based on current expectations of management; however, it is subject to known and unknown risks, uncertainties, and other factors that may cause actual results to differ materially from those anticipated.

These factors include, without limitation, statements relating to the Companyโ€™s exploration and development plans, the potential of its mineral projects, financing activities, regulatory approvals, market conditions, and future objectives. Forward-looking information involves numerous risks and uncertainties and actual results might differ materially from results suggested in any forward-looking information. These risks and uncertainties include, among other things, market volatility, the state of financial markets for the Companyโ€™s securities, fluctuations in commodity prices, operational challenges, and changes in business plans.

Forward-looking information is based on several key expectations and assumptions, including, without limitation, that the Company will continue with its stated business objectives and will be able to raise additional capital as required. Although management of the Company has attempted to identify important factors that could cause actual results to differ materially, there may be other factors that cause results not to be as anticipated, estimated, or intended.

There can be no assurance that such forward-looking information will prove to be accurate, as actual results and future events could differ materially. Accordingly, readers should not place undue reliance on forward-looking information. Additional information about risks and uncertainties is contained in the Companyโ€™s managementโ€™s discussion and analysis and annual information form for the year ended December 31, 2025, copies of which are available on SEDAR+ atย www.sedarplus.ca.

The forward-looking information contained herein is expressly qualified in its entirety by this cautionary statement. Forward-looking information reflects managementโ€™s current beliefs and is based on information currently available to the Company. The forward-looking information is made as of the date of this news release, and the Company assumes no obligation to update or revise such information to reflect new events or circumstances except as may be required by applicable law.


Disclosure: Owners, members, directors, and employees of carboncredits.com have/may have stock or option positions in any of the companies mentioned: .

Carboncredits.com receives compensation for this publication and has a business relationship with any company whose stock(s) is/are mentioned in this article.

Additional disclosure: This communication serves the sole purpose of adding value to the research process and is for information only. Please do your own due diligence. Every investment in securities mentioned in publications of carboncredits.com involves risks that could lead to a total loss of the invested capital.

Please read our Full RISKS and DISCLOSURE here.

Microsoft May Shelve 2030 Clean Energy Target Amid AI Power Consumption Growth

Microsoft is reportedly reconsidering parts of its 2030 clean energy strategy, including its ambitious goal to match 100% of its electricity use with carbon-free energy on an hourly basis, Bloomberg reports.

The review arrives as AI infrastructure grows quickly. This surge is pushing electricity demand well past earlier forecasts.

Data Centers Become the New Power Giants

The companyโ€™s flagship commitment, known as the โ€œ100/100/0โ€ goal, was announced in 2021. It aims to cover 100% of electricity use, 100% of the time, with zero-carbon energy bought from the same regional grids where the power is consumed. This is much stricter than annual matching, which allows renewable energy credits to balance energy use over a year, not just by the hour.

Microsoft has met its annual goal of matching 100% of its electricity use with renewable energy. This was mainly achieved through long-term power purchase agreements (PPAs). However, hourly matching requires far deeper coordination between real-time electricity demand and carbon-free supply.

Microsoft clean energy potfolio
Source: Microsoft

As AI workloads scale, this balance is becoming more difficult to maintain.

Global electricity demand from data centers is rising sharply, and AI is now the main driver of that growth. The International Energy Agency (IEA) predicts that global data center electricity use will hit about 945 terawatt-hours (TWh) by 2030. This is almost double the current levels. This would represent close to 3% of total global electricity demand.

Within that growth, AI is the fastest-expanding segment. The IEA predicts that electricity demand from AI-optimized data centers will rise over four times by 2030. This surge is fueled by extensive model training and inference tasks.

data center electricity demand due AI 2030
Source: IEA

In the U.S., electricity use by data centers will rise by about 240 TWh by 2030. This is over a 130% increase from 2024 levels, based on industry analysis.

The IEA notes that data centers might make up over 20% of electricity demand growth in advanced economies by 2030. This means they could become a key source of power demand in todayโ€™s grids.

This structural shift is now directly impacting corporate clean energy strategies, especially for hyperscale technology firms.

The Hidden Gap Between Green Energy and AI Growth

Microsoft has built one of the largest corporate clean energy procurement portfolios in the world. The company has locked in over 40 gigawatts (GW) of renewable energy capacity. This spans 26 countries and includes more than 400 power purchase agreements (PPAs).

Microsoft Clean Energy Capacity (2020 vs. 2025)

This includes partnerships with key developers. One example is a 10.5 GW agreement with Brookfield Renewable. This deal aims to speed up the renewable energy rollout while also giving multi-year demand signals for new projects.

Microsoft partners with over 20 energy firms. Each manages at least five renewable projects linked to its procurement pipeline. Several partners now have over 1 GW of contracted capacity each, linked to Microsoft demand. These investments help Microsoft reach its climate goals, including its promise to be carbon negative by 2030.

SEE MORE:

However, the companyโ€™s electricity demand is rising quickly due to AI infrastructure expansion. Large AI model training needs big computing clusters. These clusters run all the time and use much more energy than regular cloud tasks.

This creates a growing gap between clean energy procurement and real-time electricity usage.

Big Tech Faces a Structural Clean Energy Bottleneck

Microsoftโ€™s challenge is not isolated. It reflects a broader structural issue across the technology sector. Despite strong renewable energy procurement activity, overall corporate clean power contracting has slowed.

BloombergNEF reports that corporate buyers signed contracts for about 55.9 GW of clean power in 2025. This is a 10% drop from last year. It’s the first big slowdown in nearly ten years.

However, large technology companies remain dominant buyers. Amazon, Microsoft, Google, and Meta together accounted for about 49% of global corporate clean energy PPA volumes in 2025. This concentration highlights how heavily AI-driven firms now influence renewable energy markets. The chart below shows these tech giants’ planned data center growth in MW.

big tech AI data center planned growth 2030

Another shift is also emerging. These companies are looking more into nuclear energy contracts. Recently, these contracts made up about 23% of Amazon and Metaโ€™s clean energy purchases.

This shows a rising need for baseload clean power. It offers a steady electricity supply, no matter the weather, which is crucial for AI data centers.

Policy Changes and Energy Accounting Rules Add Pressure

Regulatory and accounting frameworks are also evolving, increasing pressure on corporate clean energy strategies. The Greenhouse Gas (GHG) Protocol is the main global standard for tracking corporate emissions. It is now updating its Scope 2 emissions method.

Proposed changes could require companies to move toward:

  • Hourly matching of electricity consumption and clean energy supply,ย 
  • More localized energy procurement rules, and
  • Stricter tracking of grid emissions data.

If implemented, these changes would make Microsoftโ€™s hourly matching target more aligned with future reporting standards, but also significantly more difficult to achieve at scale. At the same time, policy uncertainty in major markets is affecting clean energy investment.

In the United States, corporate power purchase agreements (PPAs) hit a record 29.5 GW. However, the number of unique buyers dropped sharply to only 33 companies. This change shows tighter market conditions and uncertainty about tax credits and energy incentives.

From Annual Matching to Hourly Reality

The clean energy market is also shifting toward more reliable power structures. Developers are increasingly offering:

  • Hybrid solar and wind systems,ย 
  • Co-located storage projects,ย 
  • Long-term nuclear PPAs, and
  • Firm power contracts designed for 24/7 supply.ย 

This trend is driven by the needs of AI data centers, which require constant electricity rather than intermittent supply. The IEA has warned that grid flexibility and firm clean power will become critical to managing rising electricity demand from digital infrastructure.

For hyperscale companies, this means a renewable energy strategy is no longer just about volume. It is now about timing, location, and reliability.

AI Is Redefining Corporate Climate Targets

Microsoftโ€™s potential reassessment of its 2030 hourly clean energy goal highlights a wider shift in the global energy system. AI-driven electricity demand is growing faster than most long-term forecasts made just a few years ago.

At the same time, clean energy procurement is becoming more complex due to grid constraints, regulatory changes, and the need for continuous power supply.

Microsoft remains committed to its carbon-negative by 2030 goal. However, its situation illustrates a broader reality for the tech sector: clean energy targets are now colliding with the physical limits of electricity systems.

As AI continues to expand, the central challenge is no longer just sourcing renewable energy. It is matching clean electricity to real-time demand on a global scale. This tension is now shaping the next phase of corporate climate strategy across the worldโ€™s largest technology companies.

Lithium Price Surges 245% as China and Zimbabwe Supply Cuts Tighten Market

Disseminated on behalf of Surge Battery Metals

The lithium market is shifting again. After a period of oversupply and price weakness, new disruptions are tightening supply in real time.

Two developments are driving this change: regulatory action in China and export restrictions in Zimbabwe. Together, they are bringing the lithium deficit narrative back into focus and reshaping how supply risk is assessed.

A New Supply Shock Emerges

In early 2026, Zimbabwe, Africaโ€™s top lithium producer, suspended exports of lithium concentrates and other unprocessed minerals. The government cited malpractices and revenue leakages as the reason for the halt.

Now, exports are set to resume under tighter controls. According to Reuters, Zimbabwe will introduce export quotas and require mining companies to commit to local processing investments.

Key measures include:

  • Export quotas assigned to individual producers
  • A continued 10% export tax on lithium concentrates
  • A requirement to build local processing capacity before January 2027, when a full ban on concentrate exports is expected

Zimbabwe is a major player in the global supply chain. In 2025, the country sent 1.128 million metric tons of lithium-bearing spodumene concentrate to China. This made up about 15% of Chinaโ€™s imports.

Any disruption at that scale has an immediate global impact.

China Tightening Adds Pressure

At the same time, China is tightening its control over domestic lithium production. Industry reports from S&P Global Commodity Insights and Fastmarkets show that permit reviews and stricter environmental rules have impacted some operations. This is especially true for smaller or higher-cost mines.

China dominates global lithium processing and refining. When domestic supply slows or becomes less predictable, it affects the entire supply chain. This includes chemical conversion capacity, which is critical for producing battery-grade lithium.

China dominance lithium supply chain

Together, these developments are creating a short-term tightening effect in the market. Supply is becoming less flexible just as demand continues to grow.

Small Disruptions, Big Price Impacts

Lithium markets are highly sensitive to supply changes. Even small disruptions can affect pricing and availability.

The current situation highlights several key dynamics:

  • Supply is still concentrated in a few regions
  • Policy decisions can quickly impact global availability
  • Processing capacity is as important as raw material supply

Zimbabweโ€™s push for local processing reflects a broader trend. Resource-rich countries are seeking more value from their minerals instead of exporting raw materials. While this may support long-term development, it can reduce short-term supply to global markets.

At the same time, Chinaโ€™s role as the dominant processor means that changes within its domestic system ripple outward. This combination of upstream and downstream pressure is what makes the current situation notable.

From Glut to Squeeze in Just One Year

Just a year ago, lithium prices were under pressure. The market saw oversupply, driven by strong production growth and slower-than-expected EV demand in some regions.

Lithium prices fell to $8,259 per tonne in June 2025, before reaching $28,528 per tonne on May 8, 2026, representing a 245% increase in under a year.

Lithium price chart as at May 08, 2026
Source: BLoomberg, CarbonCredits.com

Now, supply-side disruptions are shifting sentiment again. While the market is not yet in a severe deficit, the balance is tightening.

This shift reinforces a key point: lithium markets can move swiftly. Oversupply can quickly lead to tighter conditions, especially with policy and geopolitics at play.

Lithium Becomes a Strategic Battleground

The current supply story is not just about mining. It is about geopolitics and control over critical materials.

Zimbabweโ€™s lithium sector is heavily influenced by Chinese companies, including major operators that dominate production and processing investments.ย 

One of the biggest players is Zhejiang Huayou Cobalt, which operates the Arcadia lithium project and runs both mining and processing facilities. Sinomine Resource Group is another major operator, managing the Bikita lithium mine and expanding processing capacity.ย 

Chengxin Lithium Group is also active in mining and processing, while Yahua (Sichuan Yahua Industrial Group) is building lithium sulfate plants in the country. Even Tsingshan Holding Group has invested in Zimbabweโ€™s lithium projects. Together, these companies dominate the industry and shape how the countryโ€™s lithium resources are developed.

This creates a concentrated supply chain, where decisions in one country can affect availability in another. For governments and industry players, this raises concerns about the security of supply.

As a result, there is an increasing focus on diversification and domestic sourcing. Countries want to rely less on single regions or supply chains. This is especially true for materials needed for energy transition and tech infrastructure.

U.S. Domestic Projects Gain Strategic Edge

These global disruptions are highlighting the value of stable, domestic lithium resources. Projects located in secure jurisdictions are becoming more important as supply risks increase across regions like Africa and parts of Asia.

In the United States, Nevada stands out as a key lithium hub. It offers scale, infrastructure, and a well-established mining framework. Within this context, Surge Battery Metalsโ€™ (TSX-V: NILI | OTCQX: NILIF) Nevada North Lithium Project (NNLP) provides a clear example of how domestic supply can align with evolving market needs.

NNLP is not just defined by location, but by scale and economics. The 2025 Preliminary Economic Assessment shows a 42-year mine life, with estimated average annual production at around 86,300 tonnes of lithium carbonate equivalent (LCE). It is expected to produce around 3.6 million tonnes of battery-grade LCE over its lifetime. This positions it as one of the longer-lasting lithium supply assets in North America.

Surge-NNLP-Preliminary-Economic-Assessment-PEA

The project is also supported by a large resource base. Current estimates point to more than 11 million tonnes of lithium carbonate equivalent (inferred resource), with mineralization extending across a broad, near-surface footprint. This near-surface shape allows for a regular open-pit mining method. This can make development easier and boost efficiency in operations over time.

Grade is another key factor. NNLP reports an average lithium grade of around 3,010 ppm, with some zones exceeding 4,000 ppm. This positions the project among the higher-grade clay lithium resources in the United States. Higher grades can lead to better recovery efficiency. They also lower processing intensity per tonne, which matters in a cost-sensitive commodity market.

Surge lithium clay comparison

From an economic perspective, the project shows strong baseline metrics. Surge Battery Metalsโ€™ PEA shows an after-tax net present value of about $9.2 billion. It also indicates an internal rate of return of 22.8%, based on a lithium price assumption of $24,000 per tonne. The estimated operating cost is around $5,243 per tonne LCE, supporting its positioning as a potential low-cost producer.

Additional factors reinforcing NNLPโ€™s relevance in the market:

  • Large-scale footprint, with mineralization extending over more than 4 km of strike length
  • Open-pit design, targeting shallow, high-grade zones in early production phases
  • Two-phase development plan, allowing production to scale over time
  • Domestic processing pathway, supporting U.S. supply chain goals

Together, these characteristics position NNLP as a long-duration, scalable lithium source. It aligns with the needs of various demand drivers, including EVs, grid storage, and industrial applications.

In a market increasingly shaped by geopolitical risk, projects like NNLP represent more than just supply. They offer jurisdictional stability, long-term visibility, and alignment with domestic sourcing strategies.

These attributes are key to evaluating lithium assets as supply disruptions continue to emerge globally.

The New Reality: Volatility, Policy, and Power

The lithium market is entering a new phase. Demand is expanding, driven by EVs, grid storage, and data center infrastructure. At the same time, supply is becoming more complex and more sensitive to policy decisions.

The recent actions in China and Zimbabwe show how quickly the balance can shift. They also highlight the importance of diversification, transparency, and long-term planning in lithium supply chains.

For investors and industry participants, the takeaway is clear: The lithium deficit narrative is returning, not just because of demand growth, but because of real-world supply constraints.

In this environment, projects that offer scale, longevity, and jurisdictional stability are likely to play a larger role in meeting future demand.

DISCLAIMER

New Era Publishing Inc. and/or CarbonCredits.com (โ€œWeโ€ or โ€œUsโ€) are not securities dealers or brokers, investment advisers, or financial advisers, and you should not rely on the information herein as investment advice. Surge Battery Metals Inc. (โ€œCompanyโ€) made a one-time payment of $75,000 to provide marketing services for a term of three months. None of the owners, members, directors, or employees of New Era Publishing Inc. and/or CarbonCredits.com currently hold, or have any beneficial ownership in, any shares, stocks, or options of the companies mentioned.

This article is informational only and is solely for use by prospective investors in determining whether to seek additional information. It does not constitute an offer to sell or a solicitation of an offer to buy any securities. Examples that we provide of share price increases pertaining to a particular issuer from one referenced date to another represent arbitrarily chosen time periods and are no indication whatsoever of future stock prices for that issuer and are of no predictive value.

Our stock profiles are intended to highlight certain companies for your further investigation; they are not stock recommendations or an offer or sale of the referenced securities. The securities issued by the companies we profile should be considered high-risk; if you do invest despite these warnings, you may lose your entire investment. Please do your own research before investing, including reviewing the companiesโ€™ SEDAR+ and SEC filings, press releases, and risk disclosures.

It is our policy that information contained in this profile was provided by the company, extracted from SEDAR+ and SEC filings, company websites, and other publicly available sources. We believe the sources and information are accurate and reliable but we cannot guarantee them.

CAUTIONARY STATEMENT AND FORWARD-LOOKING INFORMATION

Certain statements contained in this news release may constitute โ€œforward-looking informationโ€ within the meaning of applicable securities laws. Forward-looking information generally can be identified by words such as โ€œanticipate,โ€ โ€œexpect,โ€ โ€œestimate,โ€ โ€œforecast,โ€ โ€œplan,โ€ and similar expressions suggesting future outcomes or events. Forward-looking information is based on current expectations of management; however, it is subject to known and unknown risks, uncertainties, and other factors that may cause actual results to differ materially from those anticipated.

These factors include, without limitation, statements relating to the Companyโ€™s exploration and development plans, the potential of its mineral projects, financing activities, regulatory approvals, market conditions, and future objectives. Forward-looking information involves numerous risks and uncertainties and actual results might differ materially from results suggested in any forward-looking information. These risks and uncertainties include, among other things, market volatility, the state of financial markets for the Companyโ€™s securities, fluctuations in commodity prices, operational challenges, and changes in business plans.

Forward-looking information is based on several key expectations and assumptions, including, without limitation, that the Company will continue with its stated business objectives and will be able to raise additional capital as required. Although management of the Company has attempted to identify important factors that could cause actual results to differ materially, there may be other factors that cause results not to be as anticipated, estimated, or intended.

There can be no assurance that such forward-looking information will prove to be accurate, as actual results and future events could differ materially. Accordingly, readers should not place undue reliance on forward-looking information. Additional information about risks and uncertainties is contained in the Companyโ€™s managementโ€™s discussion and analysis and annual information form for the year ended December 31, 2025, copies of which are available on SEDAR+ atย www.sedarplus.ca.

The forward-looking information contained herein is expressly qualified in its entirety by this cautionary statement. Forward-looking information reflects managementโ€™s current beliefs and is based on information currently available to the Company. The forward-looking information is made as of the date of this news release, and the Company assumes no obligation to update or revise such information to reflect new events or circumstances except as may be required by applicable law.


Disclosure: Owners, members, directors, and employees of carboncredits.com have/may have stock or option positions in any of the companies mentioned: None.

Carboncredits.com receives compensation for this publication and has a business relationship with any company whose stock(s) is/are mentioned in this article.

Additional disclosure: This communication serves the sole purpose of adding value to the research process and is for information only. Please do your own due diligence. Every investment in securities mentioned in publications of carboncredits.com involves risks that could lead to a total loss of the invested capital.

Please read our Full RISKS and DISCLOSURE here.

Hydrogen Jet Breakthrough at NASA: Rolls-Royce and easyJet Push Aviation Toward Zero-Carbon Flight

Rolls-Royce and easyJet have finished a hydrogen engine flight cycle test at a NASA facility. This is a big step for zero-carbon aviation research. The test looked at how a hydrogen-powered aircraft engine works in various flight conditions. This included changes in thrust and engine load. The results were shared through Aerospace Global News.

The work forms part of a wider collaboration between the aerospace industry, airlines, and research institutions to explore hydrogen as a future aviation fuel.

Rolls-Royce has been developing hydrogen combustion technology for several years. easyJet, a low-cost European airline, has also been investing in long-term decarbonization options as it targets net-zero emissions.

NASAโ€™s involvement highlights the global nature of the project. The agency provides advanced testing facilities that simulate real-world flight conditions without leaving the ground.

The test does not mean hydrogen aircraft are ready for commercial use. However, it shows that hydrogen engines can operate through a full simulated flight cycle, which is an important technical milestone.

How Hydrogen Aviation Technology Works

Hydrogen aviation is being explored in two main forms: hydrogen combustion engines and hydrogen fuel cells. In this case, Rolls-Royce is focusing on hydrogen combustion, where hydrogen is burned in a modified jet engine instead of kerosene. The goal is to produce thrust while emitting only water vapor at the point of combustion.

Hydrogen has a major advantage. When used as fuel, it produces no direct carbon dioxide emissions. However, it also comes with major technical challenges.

Hydrogen has a very low energy density by volume. It must be stored at extremely low temperatures (liquid hydrogen at around -253ยฐC) or under high pressure. This requires redesigned fuel systems and larger storage tanks.

Aircraft design must also change. Hydrogen takes up more space than jet fuel, which affects range and aircraft structure. Engine control systems also need adjustment. Hydrogen burns differently from kerosene, which affects combustion speed and temperature.

Despite these challenges, aerospace companies are continuing to develop because aviation is one of the hardest sectors to decarbonize.

Aviationโ€™s Emissions Problem Is Getting Harder to Ignore

Air travel is a growing source of global emissions. According to the International Civil Aviation Organization (ICAO), aviation accounts for about 2โ€“3% of global COโ‚‚ emissions. However, its overall climate impact is higher when including non-COโ‚‚ effects such as contrails.

Airline aviation sector ghg emissions 2024 IATA
Source: IATA

At the same time, demand for air travel continues to rise. The International Air Transport Association (IATA) predicts that global passenger traffic will nearly double by 2040. This growth will mainly come from Asia and emerging markets.

This creates a major challenge. Even with efficiency improvements, total emissions could rise without new fuel technologies.

Sustainable aviation fuel (SAF) is currently the main short-term solution. SAF can cut lifecycle emissions by up to 80% compared to regular jet fuel. This change depends on the feedstock and how itโ€™s made.

However, SAF supply remains limited. IATA estimates that SAF production is still less than 1% of total jet fuel demand. The supply gap is driving the industry to look into new technologies. This includes hydrogen and electric propulsion for shorter routes.

NASA Testing Strengthens Hydrogen Development Path

NASA plays a key role in aviation research and decarbonization technology. Its testing facilities let engineers simulate extreme flight conditions. They can measure engine performance, fuel efficiency, and emissions.

The Rolls-Royce and easyJet hydrogen engine test is part of a broader push by NASA to support zero-emission aviation concepts. The agency has also worked with other aerospace companies on electric aircraft, hybrid propulsion systems, and advanced fuel technologies.

Hydrogen testing at this level is crucial. It checks if engines can run safely and reliably in various conditions. It also helps identify engineering gaps before full-scale aircraft development begins.

The aerospace industry typically moves slowly due to strict safety and certification requirements. Each stage of testing is required before commercial deployment is possible.

Rolls-Royce and easyJet Net Zero Goals

Both Rolls-Royce and easyJet have set long-term climate targets.

Rolls-Royce has committed to reaching net-zero carbon emissions by 2050 across its operations and products. The company is also investing in cleaner propulsion systems, including hydrogen, electric, and hybrid-electric technologies.

Rolls Royce net zero targets
Source: Rolls-Royce

Its aerospace division focuses on improving engine efficiency and developing new power systems that can reduce fuel consumption and emissions. Here are the company’s net zero targets:

easyJet has also committed to net-zero emissions by 2050. The airline has cut carbon emissions per passenger-kilometer by over 30% since 2000. This change comes mainly from updating its fleet and improving operations.

easyjet net zero roadmap
Source: easyJet

However, aviation remains difficult to decarbonize. Aircraft have long lifespans, often operating for 20โ€“30 years. This slows the transition to new technology. To bridge this gap, airlines are investing in multiple solutions at the same time:

  • Fleet renewal with more fuel-efficient aircraft,
  • Use of sustainable aviation fuel (SAF), and
  • Research into hydrogen and electric propulsion.

easyJet has also entered partnerships with aircraft manufacturers and technology companies to explore future zero-emission aircraft designs. Rolls-Royce, meanwhile, is positioning itself as a long-term supplier of advanced propulsion systems for next-generation aviation.

The Roadblocks Standing Between Hydrogen and Commercial Flight

Hydrogen aviation is still in the early development stage, but global interest is rising.

The European Union, the United States, and several Asian countries are funding hydrogen research programs. Governments see hydrogen as a potential solution for hard-to-decarbonize sectors, including aviation, shipping, and heavy industry.

Airbus has also launched its ZEROe program, aiming to develop a hydrogen-powered commercial aircraft by the mid-2030s. However, the company has recently adjusted timelines, reflecting technical challenges in hydrogen storage, infrastructure, and certification.

Industry forecasts suggest that hydrogen aircraft will likely enter the market first in regional or short-haul routes before expanding further. But key challenges remain, including:

  • Lack of hydrogen production infrastructure at airports,
  • High cost of green hydrogen compared to jet fuel,
  • Need for redesigned aircraft and engine systems, and
  • Certification and safety approval timelines.

Despite these barriers, investment is increasing. According to the Hydrogen Council, global hydrogen investment commitments have reached $680 billion in announced projects through 2030, covering production, transport, and end-use applications.

As of the latest updates, this committed capital has passed $110 billion across more than 500 mature projects worldwide. Meanwhile, the current project pipeline could support up
to 14 mtpa of clean hydrogen capacity by the decade’s end.

clean hydrogen committed capital
Source: Hydrogen Council

Aviation is expected to be a smaller but strategic part of this broader hydrogen economy.

A Multi-Fuel Future for Aviation Is Taking Shape

The Rolls-Royce and easyJet hydrogen engine test reflects a broader shift in aviation. The sector is under pressure from governments, investors, and consumers to reduce emissions. At the same time, demand for air travel continues to grow.

This creates a structural challenge. Efficiency improvements alone are not enough to meet long-term climate goals. As a result, the industry is moving toward a multi-path approach:

  • SAF for near-term emission cuts,
  • Hydrogen for long-term zero-carbon flight, and
  • Electric propulsion for short regional routes.

Each technology is still developing, and none is ready to fully replace jet fuel today. However, tests like the NASA hydrogen engine trial show that progress is moving from theory to real-world engineering.

For Rolls-Royce and easyJet, the results support long-term plans to transform aviation into a lower-carbon industry.

For the wider market, it signals that hydrogen is now entering practical testing inside real aerospace systems, even if commercial use is still years away.

Apple Deepens India Clean Energy Push With $10.6 M Investment as 2030 Climate Deadline Nears

Apple is increasing its clean energy investments in India as the company moves closer to its 2030 carbon neutrality target. The tech giant plans to invest about Rs 100 crore (around $10.6 million) to boost renewable energy in India. The investment will support clean electricity projects linked to Appleโ€™s operations and supply chain in the country.

The move comes as India becomes more important to Appleโ€™s manufacturing and supply chain strategy. In recent years, the iPhone maker has grown its production partnerships in the country. They work with suppliers like Foxconn, Pegatron, and Tata Electronics.

Sarah Chandler, Appleโ€™s VP of environment and supply chain innovation, posted:

โ€œAt Apple, our commitment to the environment is also a driving force for innovation โ€” across the company and around the world. Weโ€™re proud to expand our efforts to invest in Indiaโ€™s clean energy economy and protect the countryโ€™s precious natural resources.โ€

At the same time, Apple is under pressure to reduce emissions across its global value chain. Most of the companyโ€™s carbon footprint comes from manufacturing, logistics, and product use rather than its direct operations.

Why India Has Become Critical to Appleโ€™s Global Supply Chain

India now plays a growing role in both challenges: manufacturing growth and emissions reduction. The new investment will help boost renewable electricity for suppliers and facilities linked to Appleโ€™s growing operations in India.

Appleโ€™s clean energy investment is closely tied to its broader manufacturing expansion in India. The company has steadily increased iPhone production in the country as it diversifies beyond China.

Bloomberg reported that Apple made about $22 billion in iPhones in India for the year ending March 2025. This is nearly a 60% rise from the previous year. This shows how fast India is growing in Appleโ€™s supply chain.

Apple production in India 2025 bloomberg
Source: Bloomberg

Indiaโ€™s government has also supported electronics manufacturing growth through incentive programs such as the Production Linked Incentive (PLI) scheme. However, rising manufacturing activity also increases electricity demand.

Indiaโ€™s power grid still relies heavily on coal, which generated around 74% of the countryโ€™s electricity in 2024, according to the Ministry of Coal data. This creates a major emissions challenge for companies trying to expand manufacturing while meeting climate goals.

As a result, multinational companies are increasingly investing directly in renewable energy projects tied to their supply chains. For Apple, clean energy procurement in India is becoming both an operational and climate strategy.

The iPod maker is also expanding environmental programs beyond electricity procurement. The company has partnered with WWF India on conservation and sustainability initiatives focused on clean energy awareness and environmental protection.

Apple has also backed community programs focused on water care and sustainable jobs in areas linked to its supply chain. These initiatives reflect a broader strategy. Apple aims to reduce emissions from manufacturing. It also wants to boost environmental resilience in communities tied to its operations.

For Apple, clean energy investment in India is becoming both an operational strategy and a long-term climate commitment.

Appleโ€™s 2030 Climate Strategy Depends on Supply Chain Emissions Cuts

Apple aims to be carbon neutral in its business, manufacturing, and product life cycle by 2030. The company reports that over 75% of its carbon emissions come from making products, also called Scope 3 emissions. So, decarbonizing suppliers is key to meeting its climate goals.

Apple carbon footprint 2025
Source: Apple

Apple announced that its global greenhouse gas emissions have dropped by over 55% since 2015. This decrease happened while revenue and product shipments grew.

Apple carbon neutrality 2030 progress
Source: Apple

To speed up reductions, Apple started its Supplier Clean Energy Program. This program encourages manufacturing partners to switch to renewable energy. Over 320 suppliers worldwide have joined the program, based on Appleโ€™s recent environmental report.

Together, these suppliers have committed to using 100% renewable electricity for Apple production. Several Apple suppliers in India are already participating.

The company has also increased the use of recycled materials in products and packaging. Apple reports that many new products now use recycled rare earth materials, aluminum, and cobalt in batteries.

In addition, the company aims to reduce emissions through:

  • Lower-carbon shipping methods,
  • Energy-efficient product design,ย 
  • Reduced packaging materials, and
  • Expanded recycling systems.ย 

These efforts form part of Appleโ€™s broader environmental roadmap leading to 2030.

Indiaโ€™s Renewable Energy Boom Attracts Global Tech Giants

Appleโ€™s investment also reflects the broader growth of Indiaโ€™s renewable energy sector. India is now one of the worldโ€™s fastest-growing clean energy markets. The country has set a target of reaching 500 gigawatts (GW) of non-fossil fuel electricity capacity by 2030.

Indiaโ€™s Ministry of New and Renewable Energy reports that renewable energy capacity has exceeded 190 GW. This includes projects in solar, wind, hydro, and biomass. Solar energy is leading much of the expansion.

India renewable energy production 2025

India added a lot of solar capacity in recent years. This happened as costs went down and demand for electricity from companies grew. Major global companies in India are signing more renewable energy deals. This enables them to cut down on emissions.

Meanwhile, electricity demand in India is rising. This is due to economic growth, more industrial activity, urbanization, and the expansion of digital infrastructure.

The International Energy Agency (IEA) expects India to have one of the biggest rises in global electricity demand over the next 10 years, averaging 6.4% annual growth rate through 2030. This creates both opportunity and pressure. The country must expand electricity generation rapidly while also reducing dependence on coal-fired power.

As a result, corporate renewable energy investments are becoming more important in supporting Indiaโ€™s energy transition.

Tech Companies Increase Focus on Clean Energy Procurement

Apple is not alone in expanding renewable energy investments in India and other emerging markets. Amazon, Google, Microsoft, and Meta are also boosting clean electricity purchases. This change comes as AI, cloud computing, and electronics manufacturing raise global power demand.

These companies are some of the largest buyers of renewable energy in the world. They achieve this through power purchase agreements (PPAs), solar projects, and grid partnerships.

Meanwhile, climate reporting standards are becoming stricter across the European Union, the United States, and Asia. Companies now need verifiable emissions reductions linked to their operations and supply chains.

Appleโ€™s India Strategy Connects Manufacturing and Climate Goals

For Apple, expanding renewable energy access in India supports both its manufacturing growth and long-term climate goals. Itsย latest investment shows how closely manufacturing expansion and climate strategy are now linked.

India is growing as one of Appleโ€™s top production hubs. However, its coal-heavy power system poses emission challenges for manufacturers. Renewable energy investments are now key to supply chain planning, not just sustainability efforts.

Challenges remain, including rising electricity demand, grid expansion, and energy storage needs. Still, investment momentum continues to grow.

For Apple, the Rs 100 crore investment is small compared to its global spending, but it shows a bigger trend: reliable low-carbon electricity is key for the future of manufacturing and tech infrastructure.

Singapore and the Philippines Launch Historic Article 6 Carbon Credit Deal, Boosting Climate Finance in Asia

Singapore and the Philippines have signed a major carbon credit agreement, which could reshape climate finance in Southeast Asia. The deal is the first bilateral carbon credit partnership between the two countries under Article 6 of the Paris Agreement.

The framework will allow Singapore to buy high-quality carbon credits from projects in the Philippines. In return, the projects will receive funding for emissions reduction and climate programs.

The deal shows how international carbon markets are becoming a larger part of global climate policy. Many countries now use carbon credits to help meet net-zero goals. The credits also help fund clean energy, forest restoration, and climate adaptation projects.

Southeast Asia will likely be one of the fastest-growing regions for these investments. This is due to its abundant renewable energy resources and natural carbon sinks.

Inside the Landmark Singapore-Philippines Climate Deal

Singapore and the Philippines both say the agreement will support emissions cuts while creating economic and environmental benefits. Grace Fu, Singaporeโ€™s Minister for Sustainability and the Environment and Minister-in-charge of Trade Relations, said:

โ€œSingapore and the Philippines share a strong and longstanding partnership… This Agreement will deepen collaboration between our two countries, channel climate finance towards impactful projects in the Philippines, and unlock new opportunities in carbon markets for businesses and local communities.โ€

Juan Miguel T. Cuna, the Philippinesโ€™ Department of Environment and Natural Resources Secretary, remarked:

“The signing of our Implementation Agreement marks a significant step forward in our shared pursuit of a low-carbon and climate-resilient future for our region…For the Philippines, entering into this Implementation Agreement under Article 6.2 is a strategic decision โ€“ one grounded in our national priorities, our development aspirations, and our commitment to global climate action.โ€

The deal creates a legal framework for cross-border carbon credit trading under Article 6.2 of the Paris Agreement. Article 6 allows countries to cooperate on emissions reductions by transferring carbon credits between nations. These credits are called โ€œinternationally transferred mitigation outcomes” or ITMOs.

Carbon Credit generation article 6
Source: UNFCCC

Under the agreement, Singapore-based companies can buy carbon credits from approved projects in the Philippines. These projects can include:

The Philippine government will authorize selected projects. It will also oversee environmental safeguards and emissions accounting rules.

Singaporeโ€™s Ministry of Trade and Industry said this deal will diversify the countryโ€™s decarbonization strategy. It will also support climate action in the region.

This is Singaporeโ€™s sixth Article 6 agreement. The country already has similar partnerships with Ghana, Papua New Guinea, Bhutan, Peru, and Chile.

Singapore Is Expanding Its Carbon Market Strategy

Singapore has become one of Asiaโ€™s largest carbon market hubs. The country introduced Southeast Asiaโ€™s first national carbon tax in 2019. The tax applies to large facilities that produce at least 25,000 tonnes of greenhouse gas emissions each year.

The Asian nation plans to raise the carbon tax from S$25 per tonne today to between S$50 and S$80 per tonne by 2030. To help companies manage costs, Singapore allows businesses to use eligible international carbon credits to offset up to 5% of taxable emissions.

singapore carbon tax increase
Source: Image from S&P Global

That policy is increasing demand for high-quality carbon credits across Asia.

Singapore has also committed to reaching net-zero emissions by 2050. The government says carbon markets will help with other climate tools. These include renewable energy, energy efficiency, and low-carbon technologies.

The country faces significant energy constraints due to its small land area. Singapore imports most of its energy and has limited space for large solar or wind projects. Because of this, international carbon markets are becoming more important to its climate strategy.

Singapore is also trying to become a global center for carbon trading and climate finance. The country already hosts several large carbon credit exchanges and climate finance firms. These include Climate Impact X. Itโ€™s a global carbon marketplace supported by DBS Bank, Singapore Exchange, Standard Chartered, and Temasek.

Why the Philippines Could Become a Major Carbon Credit Supplier

For the Philippines, the agreement could bring new foreign investment into climate and environmental projects. The country is highly vulnerable to climate change. The World Risk Index shows that the Philippines often ranks among the worldโ€™s most disaster-prone countries. This is due to typhoons, floods, and rising sea levels.

At the same time, the Philippines has strong renewable energy and nature-based carbon potential. The country has one of the worldโ€™s largest geothermal industries. It also has major opportunities in solar, wind, mangrove restoration, and tropical forestry.

According to the Department of Energy, the Philippines aims to increase the renewable energy share of its power mix to 35% by 2030 and 50% by 2040.

The government aims to cut greenhouse gas emissions by up to 75% by 2030. This goal is part of its Nationally Determined Contribution. However, much of that target depends on international financial support.

philippines NDC and emission reduction target
Source: Image from Climate Action Tracker

Carbon finance could help support those goals. Carbon market projects can create jobs, boost biodiversity, restore forests, and enhance climate resilience. Nature-based projects are expected to play a major role here.

The Philippines has vital mangrove and tropical forest ecosystems. These ecosystems absorb a lot of carbon dioxide. Mangroves are especially valuable because they store carbon more efficiently than many land forests.

Carbon Markets Are Expanding Across Southeast Asia

The Singapore-Philippines agreement comes as global carbon markets continue to grow. According to MSCI Carbon Markets, the voluntary carbon market was worth about $2 billion in recent years. Some forecasts suggest the market might surpass $100 billion each year. This could happen as climate rules strengthen and more countries commit to net-zero goals.

carbon credit market value 2050 MSCI

Today, over 140 countries have set net-zero targets. These goals cover about 90% of the world’s GDP, says the United Nations. Large companies are buying more carbon credits. They do this to offset emissions from sectors like aviation, shipping, heavy industry, and supply chains.

Southeast Asia will likely be a key carbon credit hub. This is due to its forests, mangroves, peatlands, and renewable energy resources. Industry estimates the region may need more than $1 trillion in climate investment by 2030. Carbon markets could help provide part of that funding.

Countries including Indonesia, Vietnam, Thailand, and Malaysia are also developing carbon trading systems and Article 6 frameworks.

However, investors still want better monitoring systems, clearer verification standards, and stronger environmental safeguards. They have concerns that some carbon credits exaggerate climate benefits.

Supporters believe Article 6 agreements could address this concern and boost market credibility. They offer government oversight, formal accounting rules, and safeguards against double-counting.

Carbon Finance Is Becoming Central to Net-Zero Strategies

The Singapore-Philippines agreement shows how carbon markets are becoming more connected to national climate strategies.ย The deal could also help increase climate finance flows into Southeast Asia. International carbon markets could help provide additional funding alongside public and private investments.

For Singapore, the agreement strengthens its position as a regional climate finance hub.

For the Philippines, this could attract new investment in renewable energy, forestry, and climate resilience projects. It would also help meet the country’s long-term emissions goals.

More importantly, the partnership reflects a larger global trend. Carbon markets are shifting from small pilot systems to larger, government-backed frameworks. These new systems connect directly to national net-zero goals and international climate efforts.

Boom-Bust-Bounce: Understanding Nickelโ€™s Latest Price Cycle

Nickelโ€™s latest price cycle is more than just a story of volatility. It shows how fast sentiment can flip in a market now shaped by policy, supply control, and long-term energy transition demand. The sharp move from a deep slump in late 2025 to a strong rebound in early 2026 has forced investors to rethink how they value nickel assets.

Letโ€™s take a ride through nickelโ€™s roller coaster journey.

Nickel Price Crash to Recovery: What Triggered the 2025โ€“2026 Market Swing?

The downturn began with oversupply. By late 2025, nickel prices had dropped to around $14,000โ€“$15,000 per tonne. A surge in production from Indonesia flooded the market and pushed prices lower. According to Reuters, prices touched near $14,235 per tonne during this phase. Producers struggled, margins shrank, and sentiment turned weak.

Then came the reversal.

Indonesiaโ€™s Supply Moves Drive Nickel Price Rebound

In early 2026, Indonesia changed the game. The country tightened mining quotas, slowed permits, and signaled more control over supply. Since Indonesia accounts for more than half of global nickel output, even small policy shifts had a big impact.

Global nickel prices paused at $18,942.75 per ton, posting a 0.00% change as the market consolidates. Recent upward momentum stalled due to investor profit-taking and easing US-Iran tensions, deflating short-term risk premiums. Despite today's flat movement, structural fundamentals remain heavily supported. Strict Indonesian ore production quotas and ongoing refining disruptions caused by a global sulfur supply squeeze continue to reinforce a strong price floor, keeping the underlying market outlook highly resilient.

Here’s a complete one-year presentation of the nickel price cycle:

Nickel Spot Price

Unit: USD/Tonne
---
---
Loading Chart...

This sharp move from bust to bounce highlights a key shift. Nickel is no longer just driven by demand. It is now heavily influenced by policyโ€”especially from Indonesia.

Nickelโ€™s Two Stories: Industrial Metal vs EV Battery Metal

This boom-bust-bounce cycle also reveals something deeper. Nickel now lives a โ€œdual life.โ€

In the short term, it behaves like a traditional industrial metal. Most nickel still goes into stainless steel, so prices depend on construction activity, manufacturing, and Chinaโ€™s economy. When industrial demand slows, nickel prices fall quickly.

But in the long term, nickel is becoming a critical battery metal. It is a key input for EV batteries, especially high-purity Class 1 nickel used in NCM (nickel-cobalt-manganese) cathodes. This is where the real growth story lies.

According to forecasts from the International Energy Agency, global EV sales could cross 20 million units annually in the coming years. As a result, nickel demand could double by 2030. Itย creates a strong long-term tailwind.

nickel demand

But there is a problemโ€”supply is struggling to keep up.

Nickel Supply Challenges: Indonesia Dominance and ESG Pressures

Even though Indonesia dominates more than 50% of global nickel production, not all of it is suitable for batteries. Producing battery-grade nickel requires complex processing, especially through HPAL (High Pressure Acid Leach) technology.

And this is where bottlenecks appear.

HPAL projects are expensive, difficult to scale, and often face environmental concerns. At the same time, Western mining companies are dealing with strict ESG regulations, rising costs, and long permitting timelines. These challenges are slowing new supply growth outside Indonesia.

So, while the market may look oversupplied today, the long-term picture is less certain. If demand keeps rising and supply struggles to scale, the market could tighten quickly.

Why Nickel Projects Are Slowing Despite Strong Demand Outlook

This uncertainty explains why many nickel projects are not moving forward. Companies are cautious. Prices are still volatile, and committing billions of dollars in such an environment is risky. As per analysts, this is why several producers have delayed or scaled back projects due to cost pressures and unclear price signals.

Instead of rushing into production, many companies are focusing on de-risking their assets. They are improving project economics, advancing studies, and waiting for better market conditions.

At the same time, investors are changing their approach.

Exploration Assets Become โ€œLong Optionโ€ Plays in Nickel Market

Rather than focusing on near-term production, investors are now looking at exploration-stage assets as long-term opportunities. These assets are being treated as โ€œoptionalityโ€ plays.

The idea is simple. Investors enter early, when valuations are low and sentiment is weak, and wait for a stronger price cycle. This is exactly where Alaska Energy Metals fits in.

Alaska Energy Metalsโ€™ Nikolai Project Stands Out

AEMCโ€™s Nikolai project is not designed for todayโ€™s market. It is built for the future.

The project offers two key advantages: location and scale. Located in Alaska, it benefits from strong infrastructure potential, including access to roads, ports, and possible hydro power. This is a major advantage compared to remote or politically risky regions.

At the same time, Nikolai hosts a multi-billion-pound nickel resource. This scale matters. In a future supply-constrained market, large deposits become highly valuable.

The company is also advancing toward a Preliminary Economic Assessment (PEA), which will help define the projectโ€™s economics and development pathway.

Nikolaiโ€™s Economics: Built for Higher Nickel Prices

What makes Nikolai particularly interesting is how it performs under different price scenarios. Notably, at a more conservative long-term price of $18,000-$20,000 per tonne, the economics start to look strong. The project benefits from:

  • Low strip ratios
  • Large-scale resource base
  • Additional value from byproducts like copper, cobalt, and platinum group elements (PGEs)
nickel eureka
Source: AEMC

These factors improve overall project returns and reduce risk over time. And if prices move higher, the upside becomes even more significant.

Nickel Price Outlook: Can Prices Reach $25,000?

Some market forecasts suggest that nickel could enter a deficit later this decade. If that happens, prices could rise well above current levels.

Recently, Oregon Group projected that nickel prices could climb as high as $25,000 per tonne if supply tightens in the coming years. However, for now, a more realistic and stable price range is likely to stay between $20,000 and $22,000 per tonne.

This is where the โ€œlong optionsโ€ strategy becomes clear.

AEMC is not betting everything on todayโ€™s market. Instead, it is positioning itself for a future where:

  • EV demand continues to grow
  • Supply remains constrained
  • Prices move into a stronger range

Investors entering at current valuations are essentially buying exposure to that future upside.

Final Take: Volatility Today, Opportunity Tomorrow

Nickelโ€™s boom-bust-bounce cycle has exposed how fragile and fast-moving the market can be. Prices fell sharply due to oversupply, then rebounded just as quickly when Indonesia tightened control.

But beneath this volatility lies a bigger shift.

Nickel is transitioning from a traditional industrial metal to a strategic resource for the energy transition. In the short term, it will continue to react to economic cycles. In the long term, it is driven by EV demand and supply constraints.

For Alaska Energy Metals, this shift creates a clear opportunity. The company is not chasing short-term gains. It is building a large, scalable asset that can deliver value in a tighter future market.

If nickel does move into a deficit and prices rise toward $20,000โ€“$25,000, projects like Nikolai could become highly valuable.

In that sense, todayโ€™s uncertainty may actually be the best entry point. Because in the nickel market, the biggest rewards often come to those who position earlyโ€”and wait.

DISCLAIMERย 

New Era Publishing Inc. and/or CarbonCredits.com (โ€œWeโ€ or โ€œUsโ€) are not securities dealers or brokers, investment advisers, or financial advisers, and you should not rely on the information herein as investment advice. Alaska Energy Metals. (โ€œCompanyโ€) made a one-time payment of $90,000 to provide marketing services for a term of three months. None of the owners, members, directors, or employees of New Era Publishing Inc. and/or CarbonCredits.com currently hold, or have any beneficial ownership in, any shares, stocks, or options of the companies mentioned.

This article is informational only and is solely for use by prospective investors in determining whether to seek additional information. It does not constitute an offer to sell or a solicitation of an offer to buy any securities. Examples that we provide of share price increases pertaining to a particular issuer from one referenced date to another represent arbitrarily chosen time periods and are no indication whatsoever of future stock prices for that issuer and are of no predictive value.

Our stock profiles are intended to highlight certain companies for your further investigation; they are not stock recommendations or an offer or sale of the referenced securities. The securities issued by the companies we profile should be considered high-risk; if you do invest despite these warnings, you may lose your entire investment. Please do your own research before investing, including reviewing the companiesโ€™ SEDAR+ and SEC filings, press releases, and risk disclosures.

It is our policy that information contained in this profile was provided by the company, extracted from SEDAR+ and SEC filings, company websites, and other publicly available sources. We believe the sources and information are accurate and reliable but we cannot guarantee them.

CAUTIONARY STATEMENT AND FORWARD-LOOKING INFORMATION

Certain statements contained in this news release may constitute โ€œforward-looking informationโ€ within the meaning of applicable securities laws. Forward-looking information generally can be identified by words such as โ€œanticipate,โ€ โ€œexpect,โ€ โ€œestimate,โ€ โ€œforecast,โ€ โ€œplan,โ€ and similar expressions suggesting future outcomes or events. Forward-looking information is based on current expectations of management; however, it is subject to known and unknown risks, uncertainties, and other factors that may cause actual results to differ materially from those anticipated.

These factors include, without limitation, statements relating to the Companyโ€™s exploration and development plans, the potential of its mineral projects, financing activities, regulatory approvals, market conditions, and future objectives. Forward-looking information involves numerous risks and uncertainties and actual results might differ materially from results suggested in any forward-looking information. These risks and uncertainties include, among other things, market volatility, the state of financial markets for the Companyโ€™s securities, fluctuations in commodity prices, operational challenges, and changes in business plans.

Forward-looking information is based on several key expectations and assumptions, including, without limitation, that the Company will continue with its stated business objectives and will be able to raise additional capital as required. Although management of the Company has attempted to identify important factors that could cause actual results to differ materially, there may be other factors that cause results not to be as anticipated, estimated, or intended.

There can be no assurance that such forward-looking information will prove to be accurate, as actual results and future events could differ materially. Accordingly, readers should not place undue reliance on forward-looking information. Additional information about risks and uncertainties is contained in the Companyโ€™s managementโ€™s discussion and analysis and annual information form for the year ended December 31, 2025, copies of which are available on SEDAR+ atย www.sedarplus.ca.

The forward-looking information contained herein is expressly qualified in its entirety by this cautionary statement. Forward-looking information reflects managementโ€™s current beliefs and is based on information currently available to the Company. The forward-looking information is made as of the date of this news release, and the Company assumes no obligation to update or revise such information to reflect new events or circumstances except as may be required by applicable law.


Disclosure: Owners, members, directors, and employees of carboncredits.com have/may have stock or option positions in any of the companies mentioned: None.

Carboncredits.com receives compensation for this publication and has a business relationship with any company whose stock(s) is/are mentioned in this article.

Additional disclosure: This communication serves the sole purpose of adding value to the research process and is for information only. Please do your own due diligence. Every investment in securities mentioned in publications of carboncredits.com involves risks that could lead to a total loss of the invested capital.

Please read our Full RISKS and DISCLOSURE here.

France Roadmap to End Fossil Fuels by 2050: Climate Strategy, Targets, and Emissions Outlook Explained

France has published a structured policy document titled โ€œRoadmap for Transitioning Away from Fossil Fuelsโ€ (2026) by the French Government. This roadmap sets out how the country plans to reduce its dependence on coal, oil, and natural gas over the coming decades. It does not introduce entirely new commitments. Instead, it consolidates existing climate and energy strategies into a single framework and gives them a clearer direction.

The plan aligns with the goals of the Paris Agreement, especially the global objective of achieving net-zero emissions by 2050. It also reflects decisions from the Global Stocktake under COP28 guidance, which emphasized a fair, orderly, and science-based transition away from fossil fuels.

The roadmap was also influenced by broader European Union commitments to decarbonize the energy system and reduce dependence on fossil fuels.

A Unified Climate Strategy Built on Existing Policies

The roadmap is built mainly on two long-standing national frameworks: Franceโ€™s National Low Carbon Strategy (SNBC) and the Multiannual Energy Planning (PPE).

These policies already define Franceโ€™s climate targets and energy direction. The new roadmap brings them together under a single umbrella to enhance clarity and coordination.

  • It confirms clear phase-out timelines for fossil fuels. Coal consumption is expected to end by 2030, oil by 2045, and natural gas by 2050.

In addition, France plans to shut down its last two coal-fired power plants by 2027. These steps are already part of the national energy policy but are now reaffirmed in a more unified structure.

This approach shows that France is organizing its climate goals into a more visible transition pathway. The focus is on execution rather than new ambition.

Fossil Fuels Still Dominate Energy Use

Despite strong policy direction, fossil fuels continue to play a major role in Franceโ€™s energy system. In 2023, fossil fuels accounted for slightly less than 60% of final energy consumption. They were also responsible for around 65% of total greenhouse gas emissions, according to French government climate data.

Oil remains the dominant fuel, mainly used in transport. It accounts for about 38% of final energy consumption. Natural gas accounts for around 19% of energy use, primarily in buildings, heating, and industry. Coal has now become marginal, representing less than 1% of total consumption.

A significant portion of these fossil fuels is imported, which creates energy security concerns. This dependence is one of the key reasons France is linking climate policy with energy sovereignty in this roadmap.

Transport Is the Core Focus of Oil Reduction

Transport is the largest source of emissions linked to oil consumption in France. The roadmap, therefore, places strong emphasis on electrification.

One of the key targets is for electric vehicles to represent 66% of new car sales by 2030. Alongside this, France is investing in charging infrastructure and expanding electrification to buses and heavy-duty vehicles. Public transport usage is also expected to increase by 25% by 2030.

These measures are designed to reduce oil demand in one of the most energy-intensive sectors. Transport decarbonization is seen as essential to meeting national emissions targets and reducing import dependency.

Buildings and Gas Phase-Out Strategy

Natural gas is widely used in buildings for heating and in some industrial applications. To reduce gas consumption, France is focusing on electrification and efficiency improvements.

A key measure is the ban on installing gas boilers in new residential and commercial buildings from the end of 2026. At the same time, the government plans to install around one million heat pumps per year by 2030.

Energy renovation of buildings is another major pillar. Better insulation and efficiency improvements are expected to significantly reduce heating demand. According to the roadmap, about 85 terawatt-hours of gas consumption could be replaced by domestically produced energy by 2030. This is equivalent to roughly 20% of current gas imports.

These actions show that France is targeting both demand reduction and fuel switching at the same time.

france

Clean Energy Expansion and Industrial Transition

Franceโ€™s roadmap places strong emphasis on expanding low-carbon energy production. The country already relies heavily on nuclear power for electricity generation, which keeps its power sector emissions relatively low.

According to data from RTE France, emissions from electricity generation have fallen to one of their lowest levels in recent years due to nuclear dominance and growing renewable capacity.

  • Looking ahead, France plans to expand offshore wind capacity to 15 GW by 2035 and add 1.3 GW of onshore wind annually. Solar photovoltaic capacity is expected to triple by 2035.

The country is also investing in emerging technologies. These include up to 8 GW of electrolyzers for green hydrogen production, a sixfold increase in biomethane output, and a doubling of biofuel use by 2035. Renewable heat production is also expected to double.

This diversified energy strategy aims to reduce dependence on fossil fuels while maintaining energy stability.

france renewable energy

Latest Emissions Data: Progress, But Slowing Momentum

France has made long-term progress in reducing greenhouse gas emissions, but recent data shows a slowdown in the pace of reduction.

According to the European Environment Agency and French national statistics, total emissions in 2023 were around 376 million tonnes of COโ‚‚ equivalent. In 2024, emissions fell slightly further to about 369 MtCOโ‚‚e. Early estimates for 2025 suggest emissions may have dropped to around 363 MtCOโ‚‚e, according to energy research estimates from Enerdata.

Overall, France has reduced emissions by roughly 35% compared to 1990 levels. However, this is still not fast enough to meet its 2030 climate targets.

france emissions

The IEAย has noted that emission reductions in France are currently slower than required. The country would need a much faster decline rate to stay aligned with its national and EU climate commitments.

Transport remains the largest emitting sector, followed by buildings, industry, and agriculture. This sectoral imbalance explains why the roadmap focuses so heavily on electrification and efficiency improvements.

Improvements in Air, Water, and Land Protection

France has made progress in several environmental areas beyond emissions. Air quality has improved due to reduced pollution levels. Water quality is also relatively strong, with a majority of water bodies meeting good chemical standards.

Protected natural areas now cover more than 31% of the territory, exceeding earlier 2030 targets. Waste generation per person has also declined over the past decade.

However, challenges remain. Renewable energy still represents only about 22.3% of final energy consumption, below the 2030 target of 33%. Recycling systems, especially for plastics, are not yet fully efficient. Organic farming also remains below national targets.

This shows that environmental progress is real but uneven across sectors.

Clarity vs Action: Franceโ€™s Climate Plan Faces the Real Test

Environmental experts and organizations have responded with mixed views. Speaking to AFP, Anne Bringault of the Climate Action Network said France has at least set clear timelines for phasing out fossil fuels after years of slow policy movement.

At the same time, Greenpeace Franceโ€™s Lorelei Limousin described the roadmap as an early step but insufficient given the scale of the climate crisis. The concern is that existing policies may not be strong enough to accelerate emissions cuts quickly.

These reactions reflect a broader debate in climate policy: whether long-term planning is being matched by short-term action.

Thus, Franceโ€™s fossil fuel roadmap provides clarity and structure by consolidating the existing policies. Itย provides direction, but success will depend on how quickly it can turn policy into measurable emissions reductions.

EV Batteries Need Nickel: Why Class 1 Supply Is Becoming Critical Amid Global Conflict

Disseminated on behalf of Alaska Energy Metals Corporation.

The electric vehicle (EV) revolution is unfolding at full speed. EV sales, battery factories, and electrification plans are all increasing rapidly across the world. But behind this cleanโ€‘energy success story lies a growing risk that few people fully grasp: the supply of highโ€‘purity nickel โ€” known as Class 1 nickel โ€” is under increasing strain.

While overall nickel output appears large, the specific kind of nickel that powers EV batteries is far harder to secure. Add in rising geopolitical tensions and energy price shocks, and the result is a supply chain that is both fragile and critical.

EV demand

Nickelโ€™s Role in the EV Revolution

Nickel is a key ingredient in the lithiumโ€‘ion batteries that power most longโ€‘range electric vehicles. Modern battery chemistries like NMC (Nickelโ€‘Manganeseโ€‘Cobalt) and NCA (Nickelโ€‘Cobaltโ€‘Aluminum) use large amounts of nickel because it improves energy density, which helps EVs travel farther on a single charge.

Nickel chemistries

  • As a result, demand for nickel from EV batteries is soaring. IRENA data suggested that global demand for nickel used in EV batteries could reach more than 1.09 million tonnes by 2030 under current trends, depending on battery technology and adoption rates.

As per analysts and industry pundits, as EV markets grow across the U.S., Europe, China, and other regions, this nickel demand is only expected to rise further. What makes this particularly challenging is that EV battery producers only accept Class 1 nickel โ€” nickel that is at least 99.8% pure and suitable for conversion into nickel sulfate, which is essential for battery cathodes.

NICKEL CHEMISTRIES

Why Class 1 Nickel Is Scarce

On the surface, the global nickel supply seems large. Countries like Indonesia have rapidly increased production, and numerous mines operate in Asia, Russia, and Latin America. But most of this nickel is Class 2, a lowerโ€‘purity type used mainly in stainless steel production, which cannot easily or cheaply be turned into batteryโ€‘grade material.

This means the world may have enough nickel in total, but the kind that matters most to the EV industry is limited. This structural imbalance between total output and batteryโ€‘grade supply is now one of the EV sectorโ€™s biggest supply challenges.

According to McKinsey, Class 1 supply growth is lagging demand growth. Some analysts project that even by 2025, primary Class 1 capacity may only supply around 1.2 million tonnes, compared with demand closer to 1.5 million tonnes, indicating a shortfall right when EV adoption accelerates.

nickel supply

Global Conflict Adds Supply Risk

Geopolitics is also heightening uncertainty. Russia, historically one of the largest producers of highโ€‘grade nickel, saw its exports disrupted after the Ukraine war began. Sanctions and shifting trade relationships have forced automakers and battery makers to look for alternatives.

Meanwhile, an analysis from S&P Global explained how instability in the Middle East may not directly affect nickel mining, but it does influence everything from energy costs to shipping routes. Critical passages like the Strait of Hormuz handle significant volumes of global oil and gas. Any disruption there can increase fuel prices, which raises costs throughout the mining, refining, and logistics chain.

Since nickel production and refining are energyโ€‘intensive, rising energy costs feed directly into higher production costs. In this way, even conflict far from nickel mines can tighten the Class 1 supply chain.

Processing Bottlenecks Drive Hidden Risk

Another often overlooked factor is processing. Much of the worldโ€™s nickel comes from lateritic ores, especially in Indonesia and the Philippines. To turn these ores into batteryโ€‘ready nickel sulfate requires a complex Highโ€‘Pressure Acid Leach (HPAL) process that depends heavily on sulfuric acid and stable energy inputs.

Disruptions to sulfur supply โ€” linked closely to global energy markets โ€” can slow down or increase the cost of HPAL operations. Analysts have highlighted that future price swings in batteryโ€‘grade nickel could be driven not just by ore availability but by these processing input risks tied to sulfur and acid supply.

So even if mines produce enough nickel ore, the ability to convert it into usable battery material can become the real bottleneck.

A Twoโ€‘Tier Nickel Market

As a result of these pressures, the nickel world is dividing into a clear twoโ€‘tier market:

  • A surplus of lowerโ€‘grade Class 2 nickel
  • A shortage of highโ€‘purity Class 1 nickel demanded by EV makers

This gap is expected to grow as EV battery demand rises more sharply than Class 1 production capacity. Data from IEA shows that demand for nickel in cleantech applications, mainly EVs, could more than double from around 560 kilotonnes in the early 2020s to over 1,349 kilotonnes by 2030.

nickel demand
Source: IEA

Yet most new refining capacity is focused on processing laterite ores, and planned Class 1 expansions are relatively limited. This makes highโ€‘purity nickel increasingly strategic.

Tight Battery Nickel Amid Shifting Market Trends

The same S&P report has emphasized this imbalance as a core structural challenge in the nickel market. While overall nickel supply may at times appear ample, the availability of batteryโ€‘grade nickel remains tight and vulnerable to both demand shifts and supply disruptions.

Furthermore, tracking the broader nickel market trends showed that industrial demand dynamics and tariff uncertainty have at times weighed on prices, even as batteryโ€‘grade demand continues to grow.

This mixed picture of soft prices amid growing strategic demand underscores how complicated the nickel supply story has become.

The Rising Value of Sulphide Nickel in North America

Not all nickel sources are equal. Sulphide nickel deposits โ€” found in places like parts of Canada, Australia, and Alaska โ€” are much easier to process into highโ€‘purity Class 1 material than laterites. They also tend to have lower emissions and simpler refining paths.

Sulphide Nickel: Scarce but Strategic

Not all nickel sources are equal. Sulphide nickel deposits found in places like parts of Canada, Australia, and Alaska are much easier to process into highโ€‘purity Class 1 material than laterites. They also tend to have lower emissions and simpler refining paths.

However, sulphide deposits are rare compared with laterite ores. Most of the easyโ€‘toโ€‘develop sulphide assets have already been mined. Discoveries are limited, making existing and new sulphide projects more strategically valuable.

This is why automakers and governments in Western countries are placing greater attention on domestic and North American projects as they seek to reduce reliance on geopolitically sensitive supply chains.

Alaska Energy Metals’ Nikolai Project and Cleaner Supply Chains

A highโ€‘profile case is the Nikolai project in Alaska, developed by Alaska Energy Metals Corporation or AEMC. It contains not just nickel but also copper, cobalt, and platinum group metals โ€” all important for EV batteries and broader clean energy technologies.

Projects like this offer several key advantages:

  • Cleaner processing pathways
  • Simpler conversion to batteryโ€‘grade nickel
  • Stronger environmental, social, and governance (ESG) transparency

As of March 10, 2025, the nickel junior shows a major increase in contained metals.ย The resource estimate also confirms the presence of a treasure trove of energy transition metals: copper, cobalt, platinum, and palladium.

  • The Indicated categoryย now includes 5.6 billion pounds of nickel and 1.77 billion pounds of copper, and along with the value of the other metals equal to 11.03 billion pounds of nickel equivalent metal. This marks a 46% increase from the previous estimate.
  • The Inferred categoryย holds 9.38 billion pounds of nickel and 2.43 billion pounds of copper, and along with the value of the other metals equal to 17.98 billion pounds of nickel equivalent metal. This represents a sharp 122% increase, highlighting the scale of new resource growth.
aemc nickel
Source: AEMC

As automakers push to decarbonize their supply chains, these attributes are becoming more valuable, not just economically but also in regulatory and brand terms.

Friendshoring and Supply Security

The concept of โ€œfriendshoringโ€ โ€” sourcing critical materials from politically stable and allied regions โ€” is gaining traction. Governments in the U.S., Europe, and elsewhere are funding and incentivizing projects that can produce strategic minerals like nickel in safer jurisdictions.

This shift aligns with national security goals as well as corporate sustainability targets. Securing battery metals in friendly regions helps reduce exposure to conflicts and sanctions while supporting longโ€‘term industrial planning.

Outlook: Quality Over Quantity

In the early days of the EV transition, the focus was simply on increasing battery production. Today, the conversation has shifted. It is no longer enough for the world to produce more nickel โ€” it must produce the right kind of nickel.

Highโ€‘purity, batteryโ€‘grade nickel is becoming one of the most strategic materials in the energy transition. Its supply chain is deeply influenced by geopolitics, processing challenges, and shifting industrial priorities.

Conflicts like the Russiaโ€‘Ukraine war, energy price shocks, and sulfur supply vulnerabilities have all shown how fragile the nickel ecosystem can be. At the same time, demand projections through 2030 make it clear that EV adoption will continue pushing nickel demand higher.


DISCLAIMERย 
New Era Publishing Inc. and/or CarbonCredits.com (โ€œWeโ€ or โ€œUsโ€) are not securities dealers or brokers, investment advisers, or financial advisers, and you should not rely on the information herein as investment advice. Alaska Energy Metals Corp. (โ€œCompanyโ€) made a one-time payment of $90,000 to provide marketing services for a term of three months. None of the owners, members, directors, or employees of New Era Publishing Inc. and/or CarbonCredits.com currently hold, or have any beneficial ownership in, any shares, stocks, or options of the companies mentioned.

This article is informational only and is solely for use by prospective investors in determining whether to seek additional information. It does not constitute an offer to sell or a solicitation of an offer to buy any securities. Examples that we provide of share price increases pertaining to a particular issuer from one referenced date to another represent arbitrarily chosen time periods and are no indication whatsoever of future stock prices for that issuer and are of no predictive value.

Our stock profiles are intended to highlight certain companies for your further investigation; they are not stock recommendations or an offer or sale of the referenced securities. The securities issued by the companies we profile should be considered high-risk; if you do invest despite these warnings, you may lose your entire investment. Please do your own research before investing, including reviewing the companiesโ€™ SEDAR+ and SEC filings, press releases, and risk disclosures.

It is our policy that information contained in this profile was provided by the company, extracted from SEDAR+ and SEC filings, company websites, and other publicly available sources. We believe the sources and information are accurate and reliable but we cannot guarantee them.

CAUTIONARY STATEMENT AND FORWARD-LOOKING INFORMATION

Certain statements contained in this news release may constitute โ€œforward-looking informationโ€ within the meaning of applicable securities laws. Forward-looking information generally can be identified by words such as โ€œanticipate,โ€ โ€œexpect,โ€ โ€œestimate,โ€ โ€œforecast,โ€ โ€œplan,โ€ and similar expressions suggesting future outcomes or events. Forward-looking information is based on current expectations of management; however, it is subject to known and unknown risks, uncertainties, and other factors that may cause actual results to differ materially from those anticipated.

These factors include, without limitation, statements relating to the Companyโ€™s exploration and development plans, the potential of its mineral projects, financing activities, regulatory approvals, market conditions, and future objectives. Forward-looking information involves numerous risks and uncertainties and actual results might differ materially from results suggested in any forward-looking information. These risks and uncertainties include, among other things, market volatility, the state of financial markets for the Companyโ€™s securities, fluctuations in commodity prices, operational challenges, and changes in business plans.

Forward-looking information is based on several key expectations and assumptions, including, without limitation, that the Company will continue with its stated business objectives and will be able to raise additional capital as required. Although management of the Company has attempted to identify important factors that could cause actual results to differ materially, there may be other factors that cause results not to be as anticipated, estimated, or intended.

There can be no assurance that such forward-looking information will prove to be accurate, as actual results and future events could differ materially. Accordingly, readers should not place undue reliance on forward-looking information. Additional information about risks and uncertainties is contained in the Companyโ€™s managementโ€™s discussion and analysis and annual information form for the year ended December 31, 2025, copies of which are available on SEDAR+ atย www.sedarplus.ca.

The forward-looking information contained herein is expressly qualified in its entirety by this cautionary statement. Forward-looking information reflects managementโ€™s current beliefs and is based on information currently available to the Company. The forward-looking information is made as of the date of this news release, and the Company assumes no obligation to update or revise such information to reflect new events or circumstances except as may be required by applicable law.


Disclosure: Owners, members, directors, and employees of carboncredits.com have/may have stock or option positions in any of the companies mentioned: .

Carboncredits.com receives compensation for this publication and has a business relationship with any company whose stock(s) is/are mentioned in this article.

Additional disclosure: This communication serves the sole purpose of adding value to the research process and is for information only. Please do your own due diligence. Every investment in securities mentioned in publications of carboncredits.com involves risks that could lead to a total loss of the invested capital.

Please read our Full RISKS and DISCLOSURE here.

From Ore to Economics: How Metallurgy Will Shape Nikolaiโ€™s 2026 PEA

Disseminated on behalf of Alaska Energy Metals Corporation.

The story at the Nikolai project in Alaska is entering a new phase. The latest resource update confirms what the market already suspected – this is a massive nickel system with long-term potential. But the focus is now shifting. The key question is no longer just about size. It is about how efficiently that metal can be recovered and turned into value.

That shift – from geology to metallurgy – will define the projectโ€™s future. As Alaska Energy Metals advances toward a Preliminary Economic Assessment (PEA), expected in 2026, processing performance will play a central role in shaping both costs and returns.

Big Resource, Clear Grade Dynamics

The updated 2025 Mineral Resource Estimate (MRE) highlights the scale of the Eureka deposit. It hosts 1,190 million tonnes of Indicated resources at 0.30% NiEq and 2,087 million tonnes of Inferred resources at 0.28% NiEq.

This puts total tonnage well above the billion-tonne mark, making it the largest nickel sulphide resource in the United States by a substantial margin. At the same time, the grade profile places it in the low-to-moderate range. That means the project must rely on scale and efficiency rather than high-grade ore alone.

aemc resource alaska energy metals
Source: AEMC

However, the deposit is not uniform. A higher-grade core within the Central Eureka Zone 2 (CEZ2) offers a stronger grade profile, reaching around 0.36โ€“0.39% NiEq over a continuous 2.5-kilometer strike.

This distinction between bulk tonnage and higher-grade zones is important. It gives the project flexibility to prioritize better material early in the mine plan, which can improve early cash flow and strengthen overall project economics.

Built for Large-Scale Open-Pit Mining

Nikolaiโ€™s physical characteristics support a bulk mining model. The mineralization starts near the surface and remains consistent across large areas. The strip ratio is low, and the orebody shows strong continuity.

These features make the project well-suited for a large open-pit operation. They also support a relatively low cutoff grade of about 0.064โ€“0.065% recovered NiEq, which is typical for high-volume mining systems.

But this model depends on efficient processing. Mining large volumes of ore only creates value if enough metal can be recovered at a reasonable cost.

Metallurgy Takes Center Stage

AEMC’s metallurgical testing is now moving to the forefront. Work is underway at SGS laboratories in Lakefield, Ontario, where teams are studying how the ore responds to different processing methods. Early test programs have focused on magnetic separation and flotation, helping define how metals can be separated from the host rock.

Based on these trials, a preliminary flowsheet has already been developed. The next step is a locked-cycle test, which will simulate continuous plant operations and provide a clearer picture of expected performance.

Multi-Metal Potential Adds Upside

The Eureka deposit is not just about nickel. It also contains copper, cobalt, platinum group metals, chromium, and iron. The 2025 update newly includes chromium and iron, adding significant additional material to the resource base.

These metals could provide extra revenue streams, especially if they can be recovered efficiently. However, they also add complexity. Each additional product may require extra processing steps, which can increase costs.

The challenge for the upcoming PEA will be to balance this opportunity with simplicity, ensuring that added value does not come at the expense of higher capital or operating costs.

In summary, the current plan is to produce a bulk nickelโ€“copperโ€“cobalt concentrate, along with a separate ironโ€“chromium stream. At the same time, further testing is exploring whether copper can be separated into its own concentrate. If successful, this could improve copper payability and increase overall project value.

Alaska energy metals eureka zone
Source: AMEC

Exploring a Domestic Processing Path

Beyond conventional processing, the company is also evaluating hydrometallurgical options. Concentrates produced during earlier flotation tests will be assessed using Lifezoneโ€™s proprietary technology to determine whether metals can be separated more efficiently.

If this approach works, it could unlock a different development path. Instead of relying on overseas smelters, the project could produce semi-refined or fully refined nickel, copper, and cobalt directly in Alaska.

This would be a major advantage. It would reduce dependence on foreign processing facilities and support domestic supply chains for critical minerals in the United States. More detailed testing is expected to follow in 2026 if early results are positive.

Recovery Rates Will Drive Value

In projects like Nikolai, recovery rates often matter more than headline grades. Even a small improvement in recovery can significantly increase the amount of payable metal.

Typical nickel sulphide operations achieve recoveries in the range of 50โ€“80% for nickel, with copper often performing even better. If Nikolai reaches similar levels, its moderate grade could still translate into strong economic returns.

On the other hand, lower recoveries would reduce the effective value of the resource. This is why the ongoing metallurgical work is so importantโ€”it will determine how much of the metal in the ground can actually be sold.

Charting Nikolaiโ€™s Future: AEMCโ€™s Strategic Study for 2026 PEA

Alongside technical work, Alaska Energy Metals is running an internal options study to explore how the Nikolai project could be developed. This includes early-stage mine planning and a high-level look at potential economics.

While the results of this study will not be published, they will guide the next stepโ€”a formal Preliminary Economic Assessment planned for 2026. That study will bring together all key variables, including grade, recovery, costs, and metal prices, to define the projectโ€™s economic potential.

AEMC 2026 PEA
Source: AEMC

The Bottom Line

Nikolai has already proven its scale. It has a large, continuous resource and a higher-grade core that could support strong early production. But size alone is not enough.

The projectโ€™s success will depend on how well the ore performs during processing. Metallurgy will determine recoveries, influence costs, and shape the overall development strategy.

If test work confirms strong recoveries and a straightforward processing route, Nikolai could become a major, long-life source of nickel and other critical minerals in the United States.

Thus, in todayโ€™s mining industry, that transitionโ€”from ore to economicsโ€”is where real value is created.


DISCLAIMERย 

New Era Publishing Inc. and/or CarbonCredits.com (โ€œWeโ€ or โ€œUsโ€) are not securities dealers or brokers, investment advisers, or financial advisers, and you should not rely on the information herein as investment advice. Alaska Energy Metals. (โ€œCompanyโ€) made a one-time payment of $90,000 to provide marketing services for a term of three months. None of the owners, members, directors, or employees of New Era Publishing Inc. and/or CarbonCredits.com currently hold, or have any beneficial ownership in, any shares, stocks, or options of the companies mentioned.

This article is informational only and is solely for use by prospective investors in determining whether to seek additional information. It does not constitute an offer to sell or a solicitation of an offer to buy any securities. Examples that we provide of share price increases pertaining to a particular issuer from one referenced date to another represent arbitrarily chosen time periods and are no indication whatsoever of future stock prices for that issuer and are of no predictive value.

Our stock profiles are intended to highlight certain companies for your further investigation; they are not stock recommendations or an offer or sale of the referenced securities. The securities issued by the companies we profile should be considered high-risk; if you do invest despite these warnings, you may lose your entire investment. Please do your own research before investing, including reviewing the companiesโ€™ SEDAR+ and SEC filings, press releases, and risk disclosures.

It is our policy that information contained in this profile was provided by the company, extracted from SEDAR+ and SEC filings, company websites, and other publicly available sources. We believe the sources and information are accurate and reliable but we cannot guarantee them.

CAUTIONARY STATEMENT AND FORWARD-LOOKING INFORMATION

Certain statements contained in this news release may constitute โ€œforward-looking informationโ€ within the meaning of applicable securities laws. Forward-looking information generally can be identified by words such as โ€œanticipate,โ€ โ€œexpect,โ€ โ€œestimate,โ€ โ€œforecast,โ€ โ€œplan,โ€ and similar expressions suggesting future outcomes or events. Forward-looking information is based on current expectations of management; however, it is subject to known and unknown risks, uncertainties, and other factors that may cause actual results to differ materially from those anticipated.

These factors include, without limitation, statements relating to the Companyโ€™s exploration and development plans, the potential of its mineral projects, financing activities, regulatory approvals, market conditions, and future objectives. Forward-looking information involves numerous risks and uncertainties and actual results might differ materially from results suggested in any forward-looking information. These risks and uncertainties include, among other things, market volatility, the state of financial markets for the Companyโ€™s securities, fluctuations in commodity prices, operational challenges, and changes in business plans.

Forward-looking information is based on several key expectations and assumptions, including, without limitation, that the Company will continue with its stated business objectives and will be able to raise additional capital as required. Although management of the Company has attempted to identify important factors that could cause actual results to differ materially, there may be other factors that cause results not to be as anticipated, estimated, or intended.

There can be no assurance that such forward-looking information will prove to be accurate, as actual results and future events could differ materially. Accordingly, readers should not place undue reliance on forward-looking information. Additional information about risks and uncertainties is contained in the Companyโ€™s managementโ€™s discussion and analysis and annual information form for the year ended December 31, 2025, copies of which are available on SEDAR+ atย www.sedarplus.ca.

The forward-looking information contained herein is expressly qualified in its entirety by this cautionary statement. Forward-looking information reflects managementโ€™s current beliefs and is based on information currently available to the Company. The forward-looking information is made as of the date of this news release, and the Company assumes no obligation to update or revise such information to reflect new events or circumstances except as may be required by applicable law.


Disclosure: Owners, members, directors, and employees of carboncredits.com have/may have stock or option positions in any of the companies mentioned: None.

Carboncredits.com receives compensation for this publication and has a business relationship with any company whose stock(s) is/are mentioned in this article.

Additional disclosure: This communication serves the sole purpose of adding value to the research process and is for information only. Please do your own due diligence. Every investment in securities mentioned in publications of carboncredits.com involves risks that could lead to a total loss of the invested capital.

Please read our Full RISKS and DISCLOSURE here.