Donald Trump’s recent election win has cast doubt over global climate efforts, with his victory sending ripples through the international community just a few days before the COP29 climate talks in Baku. Trump, who previously pulled the U.S. out of the Paris Agreement, has hinted at doing the same again. This is especially true given his pro-oil and gas stance in climate policy.
His victory speech highlighted America’s vast reserves of “liquid gold,” emphasizing the country’s oil and gas resources over renewable energy alternatives. This move has caused climate activists to be concerned about how the world’s largest economy will respond to the climate crisis.
America’s “Drill, Baby, Drill” Resurgence with Trump’s Victory
Donald Trump’s victory signals a shift in U.S. climate policy, as he aims to undo numerous environmental actions implemented under Biden. In Dan Eberhart words, CEO of Canary LLC, Trump as the new president means:
“You are looking at, overall, a ‘drill baby drill’ philosophy.”
Bloomberg reported that Trump’s plans include reversing EV subsidies, limiting EPA pollution rules, and boosting fossil fuel production. Moreover, Trump could challenge Biden’s Inflation Reduction Act by modifying tax credits for clean energy, potentially making them harder to access or more favorable to fossil fuels.
Internationally, Trump may withdraw the U.S. from the Paris Agreement and the upcoming UN Framework Convention on Climate Change (COP29). This would also mean sidelining the nation from climate negotiations while encouraging other countries to weaken their own emission goals.
Meanwhile, some U.S. states and local governments are preparing alternative strategies to uphold climate progress, including discussions with Chinese officials to maintain subnational climate cooperation. Climate activists and leaders are also strategizing around Trump’s presidency to mitigate potential setbacks to climate action globally.
Will the EU Rise to the Challenge and Take Charge?
Many are now eyeing the European Union (EU) to fill the leadership void with the U.S. potentially stepping back. Climate Action Network Europe’s director, Chiara Martinelli, stressed the EU’s moral responsibility to address climate issues head-on.
She also pointed out that the EU must support climate action in vulnerable regions, especially in the Global South. Countries in this region suffer the most from climate impacts despite contributing the least to the crisis.
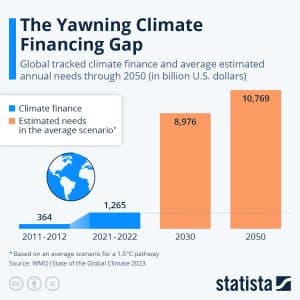
- COP29 is expected to focus heavily on establishing a new financial framework to assist poorer nations with their climate adaptation and transition efforts.

Laurence Tubiana, a former French climate diplomat who played a key role in the 2015 Paris Agreement, said the situation is reminiscent of Trump’s first withdrawal. However, she noted that today’s landscape is more favorable for renewable energy and environmental policy. This could help keep the momentum going, even without full U.S. involvement.
With Trump’s victory, the EU faces a renewed call to step up as the world’s climate leader. Patrick ten Brink, head of the European Environmental Bureau, noted that Trump’s administration has a record of environmental rollbacks, from weakening protections to supporting fossil fuels. With this, Brink remarked that:
“With Donald Trump’s re-election, the EU must recognize the urgency of stepping up and scaling up as the global leader in climate and environmental policy.”
To solidify its stance, the EU must maintain a visible presence at COP29 to ensure that it actively participates and leads in policy discussions. Brink emphasized that Europe should also bolster its efforts to move forward with climate initiatives like Fit-for-55 and the European Green Deal. They aim to slash greenhouse gas emissions by 55% by 2030 and achieve net-zero emissions by 2050.
How Does Trump’s Climate Stance Could Impact COP29?
In light of Trump’s apparent opposition to climate action, there are fears that other countries might also avoid commitments if they see the U.S. walking away from the Paris Agreement again. Already, there are reports that leaders from major emitters will not attend COP29, while some may not attend.
Europe’s lawmakers hope the U.S. stance will not derail global climate ambitions. Trump’s influence might inspire some hesitation, but the global shift toward green technology and renewables provides an economic and environmental incentive that is difficult to ignore.
Adding to these concerns, the recent announcement that European Commission President Ursula von der Leyen will not attend COP29 has sparked debates about EU leadership. French President Emmanuel Macron is also notably absent from the attendee list.
Nonetheless, the EU Parliament plans to send a delegation, including Dutch lawmaker Mohammed Chahim. He commented on the “troubling signals” from the U.S. but encouraged climate policy advocates not to lose hope.
Chahim pointed out that the U.S. is not monolithic in its climate stance. Despite Trump’s previous exit from the Paris Agreement, American cities, states, and non-governmental organizations continued to engage in climate diplomacy. With green technologies now more affordable and financial incentives linked to emissions reductions, the U.S. may find it challenging to resist the green agenda, Chahim noted.
With COP29 just around the corner, there’s renewed urgency for the participating nations to act decisively. The conference will attempt to strengthen financial commitments and establish a new goal to support the global south.
Despite the uncertainty surrounding the U.S. involvement, COP29 organizers hope to secure meaningful agreements, with or without the backing of the world’s largest economy.