Understanding The Carbon Cycle and How it Changes the Climate

Carbon is the foundation of all life on Earth. Humans are made of carbon. We eat carbon and almost everything is built on carbon.

Carbon is the 4th most abundant element in the entire universe. It’s also plenty in our atmosphere in the form of carbon dioxide (CO2).

It helps regulate the planet’s temperature but any changes that put it into the atmosphere cause temperatures to rise. And so, it turns out to be the most serious concern we face today – climate change.

This article explains what happens during the carbon cycle and how it causes global warming. It will also talk about the carbon cycle in relation to the water cycle and how they both affect the earth’s temperature.

How Carbon Cycle Takes Place

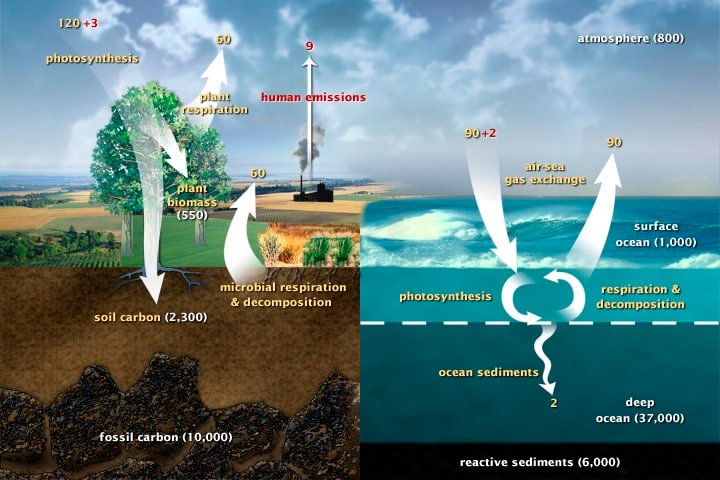
Most of Earth’s carbon, which is around 65,500 billion metric tons, is found in rocks. The rest of it is in the soil, plants, fossil fuels, oceans, and the atmosphere. They’re the reservoirs or sinks through which carbon cycles.

Carbon cycle is the exchange through which carbon flows between each of those sinks. Any change in the cycle that lets carbon flows out of one sink creates more carbon in the other sinks.

carbon cycle process
This fast carbon cycle shows the movement of carbon between land, atmosphere, and oceans. Yellow numbers are natural fluxes while red are human contributions in gigatons of carbon per year. White numbers are stored carbon. (Source: U.S. DOE, Biological and Environmental Research Information System.)

In the long run, the carbon cycle seems to keep the balance that avoids carbon from entering the atmosphere or from being stored in rocks. This balance helps keep the planet’s temperature stable.

But for some time scales, parts of the carbon cycle may amplify temperature changes that can happen for shorter time periods. This instance often occurs over tens to a hundred thousand years.

In the same manner, over very long time periods, millions to tens of millions of years, geological changes can also cause carbon to seep from the Earth’s core. This also changes the planet’s temperature from extreme hot (Cretaceous era) to extra cold (Pleistocene era).

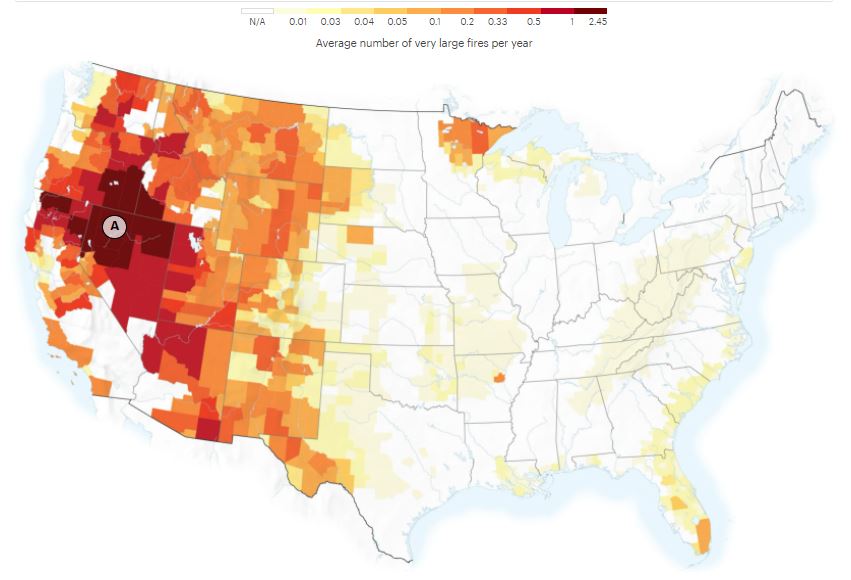
Today, carbon escapes the sinks and reaches the atmosphere when organisms die, wildfires breakout, fossil fuels get burned, and so on.

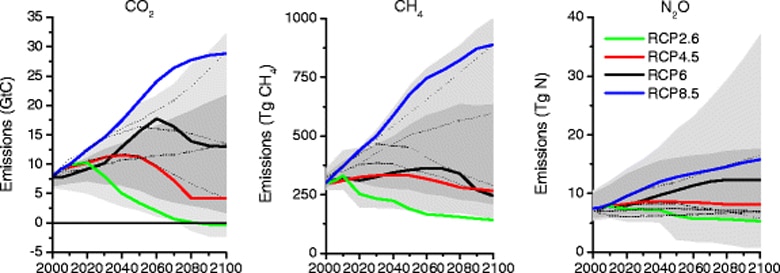
And humans have a big role in the carbon cycle through their activities such as too much logging, burning of fossil fuels, excessive fishing, and land development. As a result, the amount of CO2 in the air has been rising so fast.

  • In fact, it’s already greater today than at any time in the last 800,000 years.

In the case of the ocean, the carbon cycle takes place between the ocean’s surface waters and the atmosphere.

The carbon cycle happens either in slow pace or fast pace.

The slow carbon cycle involves a series of chemical reactions and tectonic activity that moves carbon between different reservoirs. The process also takes place between 100 to 200 million years to complete.

On the contrary, the fast carbon cycle occurs in a lifespan and involves the movement of carbon through various life forms.

In other words, this carbon cycle moves via the biosphere. About 1,000 – 100,000 million metric tons of carbon move through this cycle each year.

For the purposes of this article, we’ll focus on this short-term, fast carbon cycle. It only takes days, months, or years for carbon to cycle through this process.

The fast (biological) carbon cycle

Plants and phytoplankton (very tiny organisms in the ocean) are the main components of the fast or biological carbon cycle. Photosynthesis is the process that forms the foundation of this carbon cycle.

During photosynthesis, plants absorb CO2 and sunlight to form sugar and oxygen they need to grow.

Next, animals and humans eat the plants or plankton, breaking down the plant sugar to get energy. During food consumption, CO2 is released into the atmosphere due to cell respiration.

Then plants and plankton die and decay, and get eaten by bacteria. Or fires can also consume the plants and release the carbon back into the atmosphere.

Changes in the Carbon Cycle

In the past years, the carbon cycle has changed in response to climate change.

Levels of CO2 in the air corresponded closely with the Earth’s temperature over the past 800,000 years. Though the temperature changes were partly due to variations in Earth’s orbit, the increased temperatures released CO2 into the air.

That, in turn, caused the planet to get warmer. That was the case tens of thousands of years ago. But today, changes in the carbon cycle are happening because of humans.

Human activities disturb the natural carbon cycle significantly. By burning coal, oil, and natural gas, we quicken the carbon cycle process, releasing large amounts of carbon into the air each year.

That carbon took millions of years to escape their sinks. As such, we enable the carbon to move from the slow cycle to the fast cycle.

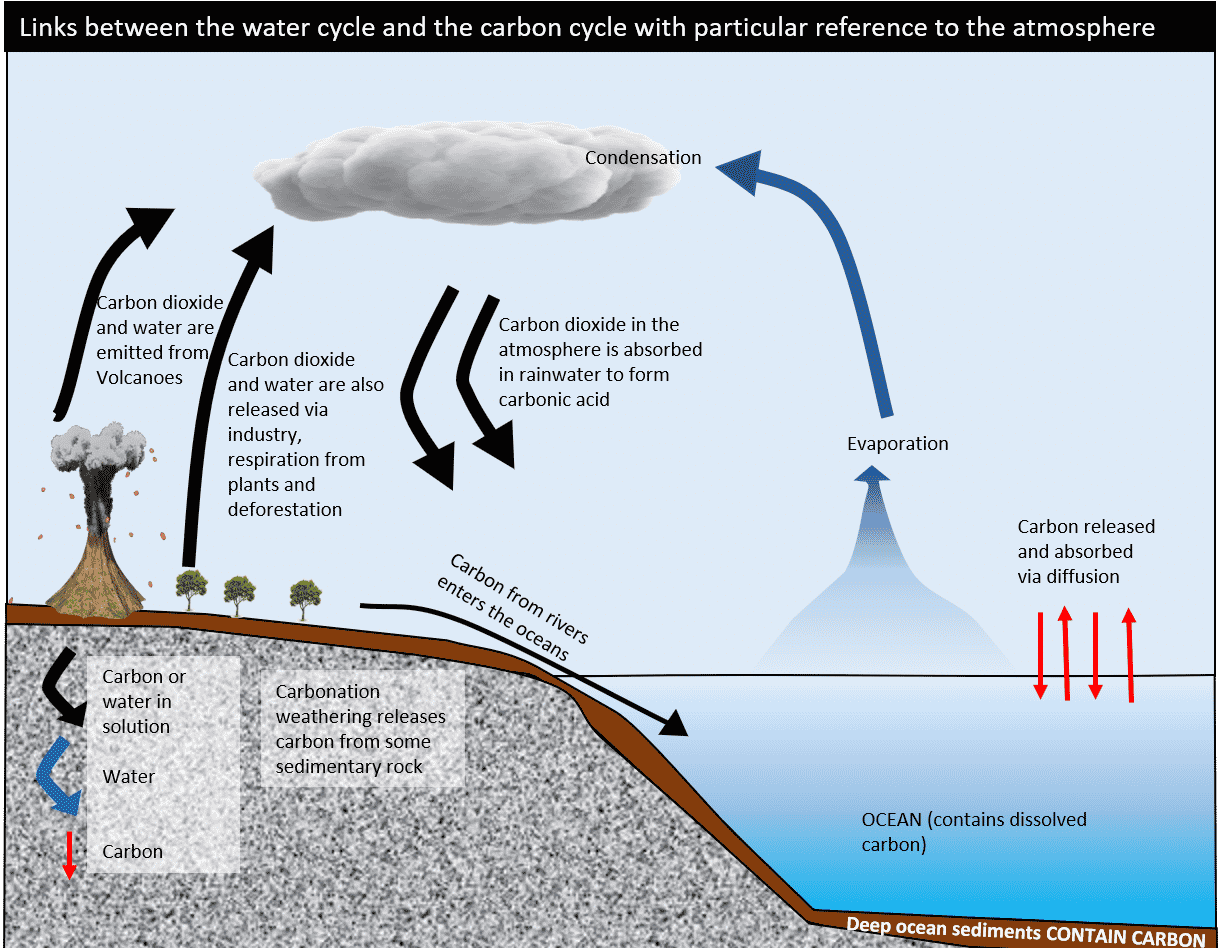
The carbon cycle and the water cycle

Energy from the sun sets in motion both the carbon and water cycles. Recall that sunlight, CO2 and water are inputs during photosynthesis.

But, changes to the carbon cycle as mentioned above affects the water cycle. With rising global warming due to increasing levels of CO2, the result is super-charging both cycles.

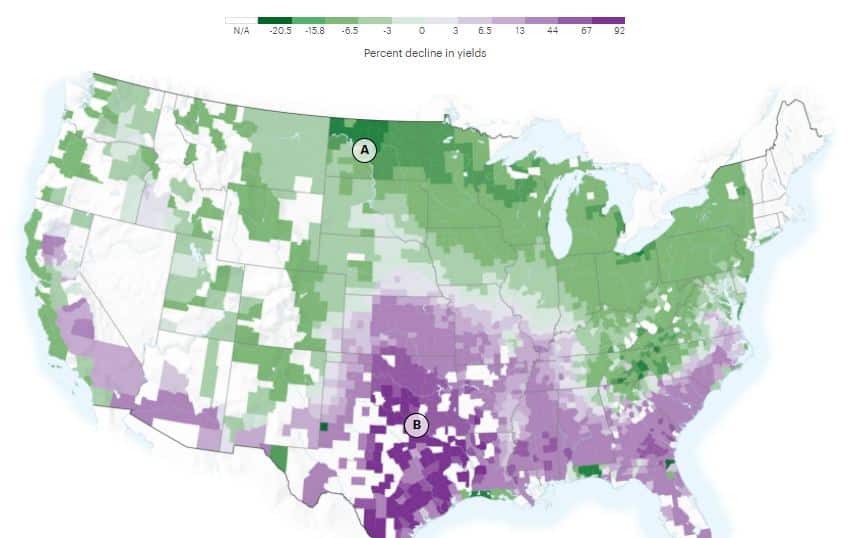
For instance, we’ve seen greater evaporation in regions that created heavier rainfall in some areas and deeper droughts in others. This phenomena shows that the greater amount of carbon in the air is altering the water cycle.

Meanwhile, the water cycle has been altered by the greater amount of carbon in the air. Likewise, plant growth is enhanced by higher carbon levels in the atmosphere.

This, in turn, contributes to more water vapor to the atmosphere during transpiration. It then leads to heavier downpours during rain events.

Hence, both water and carbon are cycling faster and differently than before as the climate changes.

carbon cycle and water cycle

The carbon cycle and the oceans

More CO2 concentrations and warming temperatures are causing changes in the natural carbon cycle. And much of the carbon emitted by humans has been absorbed by the oceans, causing them to become less alkaline.

This helps to slow global warming by removing some CO2 from the atmosphere. But as warmer ocean waters can hold less carbon, it will leave more in the atmosphere.

  • About 30% of the CO2 that humans dumped into the air has diffused into the ocean via direct chemical exchange.

Dissolving CO2 in the ocean creates carbonic acid that makes the water more acidic or less alkaline. Since 1750, the pH of the ocean’s surface has dropped by 0.1, a 30% change in acidity.

Warmer oceans, as a product of the greenhouse effect, can decrease the abundance of phytoplankton. These living organisms grow better in cool, nutrient-rich waters. As such, this can limit the ocean’s ability to take carbon from the air through the fast carbon cycle.

On the other hand, CO2 is essential for plant and phytoplankton growth. An increase in CO2 also increases their growth by fertilizing a few species that take CO2 from the water.

Unfortunately, most species are not like that as they’re harmed more by increasing CO2 levels in the ocean.

Feedbacks within and between cycles

The burning of fossil fuels, deforestation, and land use changes have changed the carbon budget. But it’s only the first or primary stage in the entire cycle story.

Changes in one part of the carbon and water cycles can lead to unexpected outcomes. These changes are the secondary ones which are also known as climate feedbacks.

Scientists worry that climate feedbacks can further worsen global warming due to CO2 alone.

For instance, snow and ice are melting in the Northern Hemisphere. Warming temperatures are also melting more parts of Arctic sea ice, exposing dark ocean water during hot summer days. While snow cover on land is also declining in many parts of the world.

As snow and ice cover decreases these areas absorb more sunlight instead of reflecting it. As a result, more energy gets absorbed that causes more warming. Thus, a positive feedback loop takes place.

The same holds true in the case of water vapor, which is the largest feedback factor. As temperature goes up, more water vapor evaporates into the atmosphere. This causes temperatures to climb up even more.

In effect, with more water vapor in the atmosphere we see more clouds. Clouds can both cool the planet (by reflecting sunlight) and warm it (by absorbing heat radiation from the surface). Though clouds have a cooling effect, that can change in a warmer environment.

So, everything with water seems to be closely related to carbon and how it cycles. If CO2 levels change, it goes the same with water and both cycles also change.

ZeroAvia Raises $30 Million Funding to Scale Hydrogen Aviation

Hydrogen aviation startup ZeroAvia secured another US$30 million in funding from new investors, NEOM, AENU, and Barclays, to scale sustainable aviation.

IAG also added to its prior investment that bringing the capital increase of the Series B round to US$68 million.

By increasing its investment, IAG brings along with it its arsenal of European airlines. These include Aer Lingus, British Airways, and Iberia.

Other early investors are Amazon Climate Pledge Fund, AP Ventures, Breakthrough Energy Ventures, Horizons Ventures, Summa Equity and Shell Ventures.

ZeroAvia founder and CEO Val Miftakhov remarked about the investors:

Each of these star investors brings a unique perspective and strength to ZeroAvia’s wider team… Our new investors are each looking at our journey through a different lens, but all energized by our mission to enable zero-emission flight using hydrogen-electric engines. This is a great recognition of ZeroAvia’s leadership in the space, fueled by real, tangible achievements.

With three major airlines – United Airlines, Alaska Airlines, and IAG – as strategic investors, the new investment will advance ZeroAvia’s hydrogen-electric powertrain development program.

  • The aviation startup aims to power 200+ seat planes with hydrogen zero-emission engines by 2040, from 40-80 seats by 2026.

How safer is hydrogen than conventional jet fuels?

Airships use lighter-than-air gas like hydrogen to float and they’ve been around for ~150 years. But the 1937 Hindenburg accident almost killed the airship industry.

Today, they’re making a big comeback as the aviation industry, and the entire world, race toward net zero emissions.

Airplanes emit 900+ million tonnes of CO2 which accounts for 2% of the global CO2 emissions. The aviation sector is also the fastest growing source of GHG emissions.

In comparison, modern airships use only 10% of the emissions of jet planes though they’re not yet available on a commercial scale.

But ZeroAvia is working to make it possible via its hydrogen-electric, zero-emission aviation solution.

  • Compared to air, hydrogen is 14x lighter and it dissipates much faster, too. Plus, hydrogen is 2x to 3x less flammable than gasoline when in the air. That’s because it needs 18x more oxygen concentration to ignite than gasoline.

To top it all, hydrogen production, storage, transport, and use has been safe for over 50 years.

ZeroAvia’s Hydrogen-Electric Aviation Solution: HARE

Banking on the advantages of using hydrogen over liquid gas fuel, ZeroAvia takes its climate solution much further. That’s by using carbon neutral fuel cells.

The $30 million investment will go towards its 2-5MW hydrogen-electric powertrain development program for planes. These bigger planes will use liquid hydrogen fuel as opposed to gaseous for smaller planes.

  • ZeroAvia’s hydrogen-electric powertrains offer a long range, higher energy density, lower fuel and maintenance costs. It’s the first practical hydrogen-electric, zero-emission aviation solution to replace traditional engines on existing fixed wing aircraft.

Here’s why ZeroAvia’s hydrogen-electric is a great option for long-term transition to clean aviation:

ZeroAvia hydrogen electric aviation solution

This latest funding will also help ZeroAvia deploy building infrastructure at airport sites. It will support live demonstrations of its Hydrogen Airport Refueling Ecosystem (HARE). And that’s in preparation for routes carrying passengers and cargo in the next years.

ZeroAvia HARE
A rendering of a potential (HARE) refueling process for hydrogen-electric planes.

The startup is ground testing its ZA600 powertrain at its R&D facility at Cotswold Airport in the UK. The testing is part of “Project HyFlyer II,” the name of its program to demonstrate hydrogen-electric flight in a Dornier 228 plane.

The firm also recently welcomed a second test bed to its US facility at Hollister, CA.

This is how ZeroAvia’s hydrogen-electric powertrain tech works:

Zero-emission aviation starts with green hydrogen. Green hydrogen is produced through electrolysis and stored at or near airports. This will reduce transportation costs that drive up the price of hydrogen before. Locally available renewable energy then powers the electrolyzers.

Green hydrogen powers electric propulsion via the fuel cells. Renewable hydrogen stored in tanks converts to electricity in flight using a fuel cell, which then powers the electric motors.

Both the old and new investors are betting on ZeroAvia’s novel hydrogen fuel cell aviation solution to help bring the sector to net zero emissions.

Here’s a quick overview of each of the new investors.

IAG: International Airlines Group is one of the world’s largest airline groups with major airlines in Spain, the UK, and Ireland. They include Aer Lingus, British Airways, Iberia, Vueling and LEVEL. It’s the first airline group to commit to achieving net zero emissions by 2050 and began partnering with ZeroAvia in 2020.

Barclays Sustainable Impact Capital. Barclays will invest £175m of its own capital in fast-growing, innovative, environmentally-focused companies like ZeroAvia. Its investments target the goals and timelines of the Paris Agreement.

NEOM. It’s a region in northwest Saudi Arabia on the Red Sea being built from the ground up as a living laboratory. It’s leveraging green hydrogen as a key power source in delivering the world’s first zero-carbon city. It can produce green hydrogen for power at scale.

AENU. This is an evergreen impact fund that invests multi-stage in climate-tech and social impact companies in Europe & US. AENU drives systemic transformation in venture capital towards impact, accessibility, and stakeholder-alignment.

Climate Maps of Transformed United States (Under 5 Scenarios)

Rising temperatures are causing drastic effects on the planet’s living conditions while increasing sea levels continue to consume coastlines. Thus, new climate maps show a transformed United States.

Indeed, heat wave by heat wave, scientists can now see the powerful impact of climate change behind unusual high temperatures in recent years.

Climate change is not just propaganda anymore but is a real thing that causes a catastrophic chain of events. And so, this article will reveal how new climate maps show a transformed United States.

The US climate maps are the results of the analyzed data from the Rhodium Group. They show how climate change will transform the way people in the US will live by mid-century.

The never-before-seen climate data unveil how heat and humidity will push the South and Gulf Coast to be almost uninhabitable. You’ll also wonder how the change will show that the upper Midwest will be a more ideal place to live.

The new climate maps provide one of the most complete views of what the climate future looks like in the United States.

They’ll also show how counties will rank across the climate criteria. These include heat, sea level rise, farm crop yields, large wildfires, and economic damages.

The Changing Human Climate “Niche”

Recent research shows that the most livable climate in North America will shift northward while large fires will continue to get worse across the country.

A team of researchers coined a term to refer to the regions where temperature has been most fit for humans to live in over the past 6 millennia. They call it the human climate “niche”.

  • In the US, that niche covers the heart of America, from the Atlantic seaboard through northern Texas and Nebraska, and the California coast.

But as temperature continues to rise, the niche can move northward by 2070. Under even a moderate carbon emissions scenario (known as RCP 4.5), much of the Southeast becomes less suitable. And the niche shifts toward the Midwest by 2070.

In the case of extreme warming (RCP 8.5), the niche moves toward Canada. This shift leaves much of the lower half of the US too hot or dry as to what humans used to live before.

Both of those future climate scenarios (RCP 4.5 and RCP 8.5) suggest immense change in where Americans live and grow their food right now.

  • RCP stands for Representative Concentration Pathway referring to future emissions scenarios.

Projecting future climate change involves assessing a number of various uncertainties.

Some of them relate to the climate system. For example, how sensitive the climate might be to increased concentrations of GHG in the atmosphere.

Other factors involve the amount of gas emitted using energy system models to simulate varying scenarios of future emissions. The chart illustrates the four common RCPs used by scientists to predict future emissions with 3 warming GHGs.

RCP scenarios
Greenhouse gas emissions in RCP scenarios compared to the range of projections in published scenarios – 90th percentile in dark grey, 98th percentile in light grey. Charts show CO2 (left), methane (middle) and nitrous oxide (right).

Heat is one of the biggest factors that change the niche of human habitability. Scientists expect that under the RCP 8.5 scenario, between 2040 and 2060 extreme temperatures will be common in the South and Southwest.

The future climate map below shows how Phoenix’ Maricopa county in the US will experience temperatures above 95 degrees for 6 months.

new climate maps show transformed United States

  • Concept defined: RCP 8.5 is an extreme warming scenario that also means high-emissions scenario that’s often referred to as “business as usual”. It suggests that’s a likely outcome if the world doesn’t make concerted efforts to reduce GHG emissions. It’s the worst-case scenario in a no-climate policy world.

New Climate Maps: The “Wet Bulb” Temperatures

While heat is a key climate factor, alone it won’t determine the future of Americans. The new climate maps that show a transformed United States include also humidity alongside heat.

Taken together, they form the “wet bulb” temperatures that will disrupt the daily existence of Americans.

  • Concept defined: Wet bulb temperature is the lowest temperature to which air cools down by the evaporation of water into the air at a constant pressure. It accounts for both heat and humidity in projecting temperature.

Though the dangers of wet bulb temperature is still rare today, it can be three decades from now. That’s assuming that people continue to dump more planet-warming gases.

Sample scenarios of new climate maps below show how the United States will be transformed under moderate (RCP 4.5) and high emissions (RCP 8.5). The projections include scenarios under five different phenomena.

Extreme Heat and Humidity: 2040-2060

Once heat meets excessive humidity, the body can no longer cool itself by sweating. That is the case with wet bulb temperatures.

In perspective, it’s when 82 degrees brings southern Alabama to its hottest temperature. So, working outdoors and playing school games can be both dangerous under this climate.

  • And as wet bulb temperatures rise even more, so is the risk of heat strokes that may lead to deaths.

In both climate maps below, heat and humidity in Missouri (A) will feel like Louisiana today. Meanwhile, southwestern Arizona (B) that’s usually not that humid will witness rising wet bulb temperatures.

climate maps wet bulb high emissions
High emissions scenario
climate maps wet bulb moderate emissions
Moderate emissions scenario

What most likely cause such a big change are many factors that react to high temperatures such as wind speed, sun angle, and cloud cover.

Large Wildfires in the US: 2040-2060

Wildfires are also another major evidence of changing climate maps of transformed United States. The chance that huge wildfires (fires that burn ~12,000 acres) affecting the country will increase even more with heat and worsening drought.

The last two years, 2020 and 2021, saw record-breaking wildfires engulfing the West, Northwest, and the Rocky Mountains. Even parts of the Southeast and Georgia are experiencing large wildfires that weren’t seen before.

  • In fact, researchers estimate that by 2050, the northern Great Basin (A) which is not a dense forested region, will be the focal point of large wildfires.
new climate maps show transformed United States wildfires
High emissions scenario

That region where big Nevada and Oregon counties will experience wet and dry weather cycles. This can turn the grasslands into a fuel field for fires that can spread through 10,000 acres in a day with strong winds.

Sea Level Rise: 2040-2060

When it comes to sea levels, they’re also rising rapidly. As per the National Oceanic and Atmospheric Administration (NOAA), the rate at which they rise has more than doubled from 2006 to 2015.

NOAA also predicts that sea levels will likely rise by at least 1 foot (0.3 m) above the levels seen in 2000 by the start of the next century. This means high tides in the coming decades will submerge even more properties along the coastlines.

Though this will affect a small land part of the country, it will impact a large share of the population. As illustrated in the new climate map, some of the populous cities in the US will be affected.

US climate map sea level rise
High emissions scenario

About 50 million people are living in America’s metro areas. And that include Miami (A), New York (B), and Boston (C). They’re all found in counties where higher share of properties will be below high tide.

So if you or someone you know happen to live in those areas, pay attention to the rising sea levels.

Farm Crop Yields in the US: 2040-2060

Apart from wild forests and oceans, agricultural lands will also be severely harmed by the climate change.

The rate of desertification grew a lot, turning plenty of croplands into dry lands. With more warming, it will be even more difficult to grow food.

Corn and soy are the most dominant crops in the US and are vital for livestock feed and other staple foods. As such, they have high economic value.

Because they’re taking most of the croplands in the country, corn and soy production is often used to predict how rising temperatures impact farming.

As growing both crops is more sensitive to heat than drought, their production rate will go down for each degree of warming.

In a sense, North Dakota (A in the map) can expect to have higher yields for both crops. That’s because the place will experience warmer temperatures by midcentury. But parts of Texas and Oklahoma (B) may witness declining yields by ~70% under high emissions scenario.

climate map farm crop yield

If you’re farming in the southern regions in the map (B), your production will face challenges if the projection holds true.

Climate Change Economic Damages: 2040-2060

Lastly, climate-driven changes will also take a financial toll on the US economy. The researchers determined the economic damages as a share of the counties’ GDP. The previous maps showing a transformed United States due to climate change can also tell.

The dragging effects of climate change to the American economy are due to several factors. These include the following:

  • rising energy costs,
  • lower labor productivity,
  • poor crop yields, and
  • increasing crime

Overall, under a high emissions scenario, the US economy will lose between about 1% – 4% of GDP each year by the end of the century. The effects, however, will not be the same across the country as shown in the map.

new climate maps show transformed United States economic damages
High emissions scenario

For example, populous areas with expensive real estate like Houston (A) and Miami (B), will see economic losses in billions. That corresponds to several percentage points loss in their GDP.

What will cause such a big financial loss are rising sea levels, storms, and even deaths from extreme heat, according to the researchers.

More notable is the fact that climate change damages will be worse in poorer and rural areas. Take the case of the Gulf Country, Florida (C), for instance. They may lose even half of their economy due to those climate-related disasters.

Are Those Future Scenarios Unavoidable?

Without a doubt, those climate maps that show a transformed United States from today look scary.

Oceans swallowing more coastal lands are unimaginable while deaths due to heat strokes are more unthinkable.

Not to mention the fierceness of large wildfires claiming vast acres of land and even lives. And the idea of low food supply may prompt you to think of hoarding food today. These compounding climate change calamities seem to be like the end of world.

But the good news is that humans still have a chance to avoid them with suitable climate policies and prompt actions. The deadline is quite tight though.

Organizations and individuals alike are looking for ways to prevent those disastrous scenarios.

People develop initiatives that avoid greenhouse gas emissions.

Companies innovate technologies that remove carbon and other GHG already dumped in the air.

Nations take measures that cut down their emissions.

Investors fund projects that support all those actions above.

If you are interested in how you can join and help address climate change and reverse its catastrophic effects, there are plenty of means to do so.

But if you’re looking for a way that can both benefit the planet and your wallet, you can start by exploring the carbon market.

You can visit our education page for comprehensive guidelines all about carbon market. It’s best to begin with this beginner’s guide explaining the voluntary carbon market.

Banking on Carbon – BMO Acquires Carbon Offset Developer Radicle Group

Bank of Montreal, BMO, is buying carbon offset developer Radicle Group to meet the bank clients’ demand for advice on emissions reduction.

BMO’s acquisition reflects major banks’ growing interest to help clients measure carbon emissions. It will also allow the bank to help their clients manage a difficult transition toward net zero emissions.

The buyout is also a move by BMO to be at the forefront of developing products fit for climate transition such as carbon offsets.

Dan Goldman from BMO said that:

“Climate, energy transition and net-zero targets come up in almost every client conversation we have… It’s not topical, it’s front and centre in terms of thinking about how the world evolves… Helping our clients navigate what is clearly going to be an enormous part of their agenda going forward was paramount.”

BMO Carbon – Radicle Acquisition Deal

Buying Radicle supports BMO’s Climate Ambition to be its clients’ lead partner in the transition to a net zero world.

Founded in 2008, Radicle has built a reputation as a leading developer of carbon offsets. It’s also the leading adviser that helps organizations measure and reduce emissions.

The firm is one of Canada’s most advanced carbon offset developers that generates carbon credits that entities can buy and sell to offset their unavoidable emissions.

Radicle has 130 employees and over 4,000 clients including Imperial Oil, Meg Energy, TC Energy, Chevron, and ConocoPhillips.

Carbon offsets, despite criticisms as less effective, are Radicle’s key area of expertise. But they will not be BMO’s main focus. The bank will continue to develop and adapt new products with Radicle’s expertise.

Buying carbon offsets means paying for projects that provide positive impact to the environment. Common examples are protecting trees or capturing and storing carbon.

Radicle also helps entities measure their emissions so they can develop ways to reduce them and track their progress.

The Radicle team will work with various bankers to advise clients on several areas. These include investment and corporate banking, commercial lending, and wealth management.

BMO is aware that building the carbon offset expertise from scratch will take time. So, the bank set its eyes on Radicle which was exploring a sale.

The role of carbon offset markets

Canada’s major banks are criticized for their continued funding of the oil and gas industry. Yet, the banks defended by saying they plan to work with heavy emitters to reduce emissions.

BMO isn’t the only Canadian lender to tap the carbon market for emission offsets.

For instance, the Canadian Imperial Bank of Commerce joined 3 other banks last year to launch a pilot marketplace for trading voluntary carbon credits on a digital ledger.

It was called Project Carbon whose first trade occurred in September between the Nature Conservancy of Canada and NatWest.

Carbon markets have a vital role in fighting the effects of climate change and thus, enable a sustainable future. They’ve grown remarkably around the world as people and companies work to scale the technologies needed to reach net zero.

To achieve their own net zero pledges, banks also have to boost ways to measure and reduce emissions by the firms they finance. And BMO knows this well that’s why it struck the deal.

It also expects Radicle to speed up its emissions reduction efforts, scale its activities across BMO’s client network, and develop more sustainability services.

To date, Radicle helped its clients generate over C$100M in value and cut carbon emissions by 7 million tonnes.

BMO did not reveal the financial terms of its Radicle deal but expects it to close by the end of 2022.

Dutch Farmers Dilemma: Sort Out Emissions or Sell The Farm

Dutch farmers protested as lawmakers voted on proposals to reduce nitrogen emissions, a plan that will likely force them to cut their livestock herds or exit the farming business.

The Netherlands is Europe’s biggest meat exporter from its intensive livestock farming industry. But the Dutch government decided to cut nitrogen and ammonia by 50% by 2030, with a €25 billion budget for it.

Ministers call the proposal an “unavoidable transition” that aims to improve air, land and water quality. They warn that farmers need to adapt or face the prospect of closing their businesses.

The honest message, however, is that not all farmers can continue their business if profits are also cut. And so, Dutch farmers are revolting.

They’re angered by the government’s environmental policy to reduce 30% in livestock production. They’re blocking food distribution centers, roads, and ministers’ driveways.

Livestock Farming and Nitrogen Emissions in the Netherlands

The country has the EU’s highest density of livestock. It has ~20 million livestock, including cattle, pigs, and chickens but it only has a 17 million population.

The intensive livestock production pollutes the environment. Manure and urine combine to release ammonia. They then run-off from fields as fertilizer to streams and lakes, harming life in these bodies of water.

In other words, manure poses a harmful waste product in the Netherlands instead of being a vital fertilizer.

Also, the success in agriculture has been emitting harmful nitrogen compounds that include nitrogen oxide (N2O).

In response, the government introduced a trading or offsetting scheme in 2015. It permitted projects releasing nitrogen in exchange for future nitrogen reductions.

But in 2019, the Council of State court ruled that the scheme was not valid and that nitrogen reductions have to come first. The Dutch government believes that something has to be done with ammonia, nitrogen, and its warming emissions.

  • In effect, there’s a plan to reduce nitrogen emissions by 50% by 2030. And this has a backing of €25 (US$25.4) billion budget.

Part of the plan is cutting livestock production by 30%. Plus, over €500 million is brought forward for the regional government to buy out farmers this year and next.

Since the Netherlands is the region’s largest nitrogen emitter, the plans to cut N2O emissions must go through. So, the Dutch government created two official documents.

One is a map showing the areas where N2O reductions should happen by about 12% to 95%. The other one is a statement intended to help farmers.

But farmers consider both measures damaging to their business, particularly pointing out to the reduction numbers. They think the plans are a huge blow to their farming business and the entire sector.

In fact, many of them invested a lot in new equipment to cut down their herds’ environmental impact.

Farmers’ Grassroots Proposals Ignored

The protest that Dutch farmers initiated shakes the entire nation. There’s a big rally in Stroe’s central village and police cars get attacked. Food retailers lost tens of millions in sales.

  • And farmers declared a free state of boerenlanden (farmer land) in some villages.

One major reason for the farmers uprising is the fact that their proposals were not heard by the national government.

According to Wytse Sonnema, a spokesman for the farmers’ association the LTO, they proposed a 40% reduction by 2030.

But their proposal was fully ignored and lost over the government’s 70% reduction targets. And farms in EU-designated Natura 2000 protected zones face the hardest restrictions.

Sonnema said that:

“Famers in the Netherlands are deeply concerned and angry about the nitrogen policy that was presented by the national government on June 10th… According to the government these should all add up to a country-level reduction of 50% in 2030… which is simply unfeasible, and will have disastrous effects on not just agriculture, but on the economic, social and cultural viability of rural Netherlands.”

One group of organic farmers proposed its own 10-point plan called Green Farmers Plan. It’s intended to get farmers out of the stand-off of the nitrogen dossier yet the government ignored it.

The food team at WWF Netherlands commented on this concern. Natasja Oerlemans remarked that:

“I speak to many farmers who want to change [livestock production]: the question is how. The how is not very clear in current government communication but I think there are many opportunities for farmers to change.”

Across the country, people hang Dutch flags upside down along roads and bridges as support for the farmers. And the world is also starting to take notice.

Not Just a Dutch Issue

Nitrogen emissions is not just a Dutch issue. It’s a problem all over Europe, such as the Po Valley in Italy, Brittany in France, and parts of Denmark, Ireland and the UK.

The current Dutch farmers’ rally hinges on EU standards setting maximum safe nitrogen emissions levels. This applies all throughout the bloc.

For instance, Belgium, which has the 3rd-highest EU livestock concentration, is paying big attention to the Netherlands.

The government of the Dutch-speaking region, Flanders, also aims to reduce numbers of pigs 30% by 2030. It’s offering farmers €150 euros per pig and €855 euros per sow to buy them out.

Germany also has its new regulations on nitrogen pollution. France could also follow.

With the Dutch government already having some outlines, it’s now up to provincial administrators to develop and implement their nitrogen emission reductions plan.

Tesla’s Carbon Credit Sales Down 49% in Q2

Tesla recorded $344 million in regulatory credits for Q2 2022, down 49% from Q1 which was $679 million.

The credits account for 1.7% of the overall gross margin for the quarter, down from 2.9% last quarter.

The public has been anticipating how much the EV carmaker will earn from its carbon credits this second quarter, and year-over-year it was down 3%.

Tesla regulatory Credits

Since 2017, Tesla has made ~$5.1 billion from the sale of regulatory carbon credits as shown above. The credits sold help other automakers meet their emissions regulations and bypass billions in fines.

Alongside the carmaker’s carbon credit sales is the company’s commitment to further reduce its carbon footprint as revealed in its 2021 Impact Report. This report seems to be the answer to the public’s long wait for Tesla’s decarbonization strategies. 

Currently, the carmaker is providing energy generation and storage products using its patented solar energy system. They significantly contribute to Tesla’s regulatory carbon credit generation.

Most importantly, they also represent Tesla’s massive efforts in cutting down its carbon footprint.

Tesla’s GHG Emissions

In 2021, Tesla began measuring its Scope 1 and Scope 2 GHG emissions considering the principles and guidance of the GHG Protocol.

The carmaker used the operational control approach method or accounting for GHG emissions from operations under its control. The table below shows Tesla’s emissions for all three scopes.

Tesla emissions by scope

For its Scope 3 emissions, Tesla measures two largest categories: use of product and supply chain.

Use of product emissions:
Tesla has access to primary data from its ~2 million vehicles on the road and fleet of solar and storage products. So it can calculate emissions from use of products each year with accuracy, not just estimates.

Supply chain emissions:
The company had identified which materials and processes in the supply chain are key emitters. It means the firm can prioritize its engagement and projects to tackle those emissions.

100% Renewable Supercharger network

Tesla’s global Supercharger network was 100% renewable in 2021. Thanks to a combination of its onsite resources and annual renewable matching.

Plus, all home charging in California was 100% renewable through annual renewable matching. 

As such, the only emissions from the use of Tesla vehicles were from home charging outside of California. It can also be from use of third-party charging networks.

Tesla’s Emissions Reduction Strategies

Decarbonizing the Manufacture and Use of EVs

1. Building new, better designed and more efficient factories. Building components need less movement, use fewer robots, and consume lower energy.

Tesla energy use per vehicle produced

2. Covering roof space with solar panels. All new Tesla factories are designed to be covered with solar panels. As of the end of 2021, the carmaker installed solar panels with a capacity of 21,405 kW on the roofs of Gigafactory Nevada, Gigafactory New York, and manufacturing facilities in California.

3. Leveraging AI to make factories more efficient. Tesla is leveraging 6 years of sensor data to train an AI program to safely control 195 interconnected HVAC units. In its first full year of operation, there’s significant load reductions compared to baseline use.

Increasing Vehicle Utilization

Tesla batteries are designed to outlast the vehicle. A vehicle gets scrapped after about 200,000 miles of use in the U.S. and 150,000 miles in Europe.

By creating a battery that can last for 1,000,000 miles (4,000 charging cycles), Tesla helps reduce emissions per mile driven for high-mileage vehicles like trucks, taxis, or delivery vans.

Reducing Fleetwide Emissions

Tesla semi truck

Tesla Semi offers an opportunity to have a great impact on GHG emissions from transport. Combination trucks, which are mostly semi trucks, in the U.S. account for just 1.1% of the total fleet of vehicles on the road.

But they have high fuel consumption because of their weight and heavy use. In fact, they account for about 18% of all U.S. vehicle emissions.

This is why Tesla’s plan to also electrify the heavy-duty truck segment is vital in transitioning the world to sustainable energy.

Right now, cell availability is the limiting factor for full production. A Tesla Semi needs more cells than a passenger vehicle.

Accelerating Deployment of New Factories via Emissions Credits

Emissions credits or carbon credits revenue is used for Tesla’s EV capacity expansion, which in turn displaces ICEs.

In 2021, the EV manufacturer generated almost $1.5 billion in revenue selling emissions credits to other OEMs. The proceeds go to building new factories to make more EVs.

Tesla delivered almost 1 million EVs globally last year. In comparison with other carmakers, Tesla outperformed all others as shown in the chart.

EV produced globally

There’s confusion, however, among Tesla’s customers about the company’s claim that its cars produce zero carbon emissions. This led to German Consumer Consumer Association (VZBV) suing Tesla recently.

VZBV claims that consumers were misled into thinking that buying from Tesla will cut the entire emissions from all cars.

The emissions that Telsa reduced by producing EV’s are bundled up and then sold as regulatory credits (carbon credits).

These carbon credits allow other car manufacturers to exceed the emissions limits applicable to their vehicle fleets.

Telsa’s potential consumers are only notified about the emissions rights on page 75 of its Environmental Impact report, which could be downloaded from the website.

Though it’s common practice for other automakers to buy carbon credits from Tesla to offset their emissions, it’s not a sustainable strategy. To meet stricter regulatory mandates worldwide, an industry-wide shift to EVs is crucial.

Tesla’s “Solar + Storage” Products and Supply Chain

Commercial customers: Megapack and renewables (solar)

Pairing energy storage with renewables enables cost-effective decarbonization of the grid. A single Megapack has an average 3,000 kWh worth of battery storage capacity.

In 2021, Tesla started building a new production facility that can produce 40,000,000 kWh of energy storage a year. This helps households rely less on the grid and avoid blackouts.

Tesla sold 4 GWh worth of energy storage products, more than 15% of the 25 GWh global market in 2021. This includes projects in California and Australia.

Add to this Tesla’s Powerwall solar technology for residential customers. Installing solar panels on roofs can help reduce carbon emissions while allowing customers to save on energy costs.

Supply chain: battery recycling

“What happens to Tesla battery packs once they reach the end of their life?”

Before decommissioning and recycling a consumer battery pack, Tesla does everything it can to extend the useful life of each pack. For instance, they send out over-the-air software updates to Tesla vehicles to improve battery efficiency.

Moreover, while Tesla works with third-party recyclers, the firm also recycles in-house. On-site recycling allows for raw material transfer straight to the company’s nickel and cobalt suppliers.

The firm’s cell recycling facility unlocks the cycle of innovation for battery recycling at scale. This enables Tesla to improve current designs via operational learnings and to perform process testing of its products.

By the end of 2021, Tesla’s recycling facility achieved a production rate of over 50 tons of recycled material per week.

Outlook for battery supply chain responsible sourcing:

In 2022, Tesla plans to continue building on its battery responsible sourcing program and improve on the data points. More importantly on the development of supply chain GHG emissions reduction plans and future investments.

All these emissions reductions initiatives allow Tesla to earn massive carbon credits revenue. As the automaker continues to electrify the industry, it can expect more sales from regulatory credits.

Are Clean Energy Tax Credits the Solution for Electricity?

0

The benefits of clean energy tax credits outweigh the efficiency gains of carbon pricing according to a study of popular climate policies.

Many believe that putting a price on carbon is the most efficient way to cut emissions from the electricity generation or power sector. Pricing carbon emissions with a tax or with a cap-and-trade program is often considered the “first best policy”.

Lawmakers have to consider a couple of factors when deciding which climate policy approach to choose. But policymakers in the U.S. have started to focus on clean energy tax credits.

Policy Options for Decarbonizing the Power Sector

1. Carbon pricing

This approach involves two options: carbon tax and cap-and-trade.

A carbon tax, also known as GHG emissions tax, mandates power sector emitters to pay for their emissions with a certain amount.

Under a cap-and-trade system, firms trade permits to stay within a set carbon budget. There’s a set limit on carbon emissions they are allowed over a long period of time.

For every tonne of carbon emitted, the entity must get a permit or allowance to cover it. These permits are then traded, often as carbon credits, either in government auctions or in private carbon markets.

A popular example of a cap-and-trade is the European Union Emissions Trading Scheme, there are numerous other programs in different jurisdictions.

2. Subsidizing clean energy (Clean energy tax credits)

Under this approach are also two options for subsidy. One is the Zero-emission Energy Subsidies (ZES) which pay producers a fixed amount for a unit of electricity generated from clean or zero-emissions sources.

An example of this is the production tax credit for wind power which is different from solar power generation. But both subsidies are often done via tax credits.

The second option is Zero-emission Capital Subsidies (ZCS). ZCS subsidizes the creation of capacity and not the production of electricity from clean sources. A perfect example is investment tax credits for solar power generation.

Why are clean energy tax credits more effective?

Ryan Kellogg and co-author Severin Borenstein examined how those policies can lead to various GHG emissions.

They pointed out that pricing carbon penalizes fossil fuels like coal that is the dirtiest source. They then consider the impact of policies on electricity prices and government revenue.

Carbon pricing results in the highest electricity prices for consumers and generates government revenue. On the other hand, prices are lower under clean electricity tax credits but it calls for government spending.

In general, the high prices under carbon pricing seem to be efficient as they give consumers incentives to conserve power. While low prices under clean energy tax can result in over-consumption.

  • But, the authors claimed that this point of view is unlikely to hold in bringing the power sector to zero emissions.

That’s because utilities mark up the retail price of electricity above the wholesale price. This is to cover the fixed costs associated with electricity distribution and utility programs like subsidies for solar and energy efficiency.

In the US, those markups can be 2x more than the cost of producing electricity itself. In a sense, if the power or electricity generation sector decarbonizes via a carbon price, it leaves the consumers to pay much higher prices.

This over-pricing of electricity is problematic if decarbonizing other sectors like transportation and building calls for electrification.

electricity prices under different climate policies

The chart above shows that the ZES policy leads to electricity prices that are lower than a carbon tax. The same holds true in the case of the clean energy standard. That’s because the ZES enables zero-emission sources to rival fossil units.

Also, ZES wholesale prices are below the social marginal cost of producing electricity each year. It also includes the final year when emissions are eliminated so that private and social marginal costs are identical. This is better at aligning retail power prices with social costs.

The Climate Benefits of Clean Energy Tax Credits

A similar study on a specific example of clean energy tax, the “Build Back Better”, found that its benefits are about 3x-4x greater than its costs. The graph below illustrates the cost and benefits of this climate policy. SCC means social cost of carbon.

clean energy tax credits cost and benefit

Across a wide range of assumptions, the authors find that the projected benefits of the tax credits go above the costs. Plus, on a cost/tonne of CO2 basis, they tend to deliver greater emission reductions than other climate policies in place.

As per Borenstein,

“We found that the standard economic logic of carbon pricing doesn’t fit the electricity sector very well, due to the other pricing distortions in the industry… Carbon pricing is still a powerful tool, but this shows it is important to think through the full context in which we are doing GHG regulation.”

Integrating Carbon Credits in Corporate Sustainability

As corporations are leading generators of carbon emissions globally, it is necessary to take urgent action to uplift corporate sustainability.

This is particularly pressing as multinational corporations are responsible for almost 20% of climate-changing carbon dioxide emissions around the world.

Fortunately, with attention to the climate crisis becoming more widespread, corporations are making active moves to find more sustainable alternatives to their operations.

Many companies are hiring professionals in sustainability, such as environmental specialists, to advise them on their environmental, social, and governance (ESG) plans to decrease their carbon footprint.

As a result, global investments in business sustainability have increased significantly in the last three years.

In propelling corporate sustainability, companies are searching for innovative ways to offset their carbon footprint. One of the most efficient and effective new ways to do this is by investing in carbon credits.

What are carbon credits?

Carbon credits are generated when 1 metric ton of carbon dioxide has been removed or prevented from entering the atmosphere. These carbon credits are commonly generated through renewable energy, energy efficiency, carbon and methane capture, and land use and reforestation projects.

Project developers then sell these carbon credits to financially sustain their carbon offset projects. Plenty of big companies like Disney and Microsoft purchase these carbon credits, allowing their money to go to funding projects that contribute to the reduction or removal of these greenhouse gasses (GHG).

How to use carbon credits for corporate sustainability

Although companies may continuously move towards sustainable and renewable practices, there may still be some processes that necessitate generating GHG emissions. This may involve causes like outsourcing transportation to companies that rely on fossil fuels or producing chemical reactions that are unavoidable in manipulating raw materials.

Purchasing carbon credits allows corporate leaders to offset carbon emissions with greater ease. This is because they eliminate the need for corporations to come up with carbon reduction initiatives themselves. Instead their money is going through projects that are better resourced and proven to be effective.

For instance, even as Netflix was on target to meet its goal to hit net-zero GHG emissions by 2022, its progress was hampered by the pandemic. Despite the sudden increase in emissions due to increased TV and film productions, investing in carbon projects helped Netflix avoid about 14,000 tons of carbon in 2021 — thus allowing them to continue their progress towards its target.

Other companies like Disney, Microsoft, and Unilever have also committed to investing in carbon offsets and projects to combat the emissions they can’t avoid.

How to choose the best carbon credit to buy

The voluntary carbon market has accelerated because of the Paris Agreement, which prompted governments and corporations to commit over $14 trillion towards climate change. With entities needing to commit to decarbonization actions to reach net-zero emissions, they must choose the best carbon credit to buy.

However, know that not all carbon credits are the same nor are they the best option for your company. In addition to price, you will have to consider factors like additionality, permanence, measurability, and scalability.

Additionality refers to reductions or removal directly produced by the carbon credit market.

Permanence is the capacity of different methods to make lasting changes with a lower risk level of the projects being undone.

Measurability is the accuracy of reported reductions — with no overestimation or underestimation of emissions, or a failure to account for indirect effects.

Lastly, scalability refers to the project’s suitability for scaling up. This may depend on their CO2 removal capacity, level of readiness deployment, and cost-effectiveness.

As corporations are largely responsible for global carbon emissions, it’s necessary to find multiple methods of achieving net-zero with their emissions, and incorporate these steps into their ESGs.

Carbon credits provide a suitable and effective way to do this, although companies must take into account the varying factors that make each offset unique. But with the biggest companies around the world already set the precedent, the carbon market is already making significant strides in reducing emissions worldwide

Canada Explores Options to Cap Oil and Gas Emissions

The Canadian government proposed two options to set emissions cap in the oil and gas sector to achieve Prime Minister Justin Trudeau’s goal of reducing it by 40% by 2030.

The two emissions reduction options are in a discussion paper published by Environment Minister Steven Guilbeault.

The federal government aims to cut emissions across all sectors by 40% – 45% below 2005 levels by 2030. It also plans to hit net zero emissions by 2050.

The oil and gas industry accounts for over 1/4 of Canada’s total emissions (27%) or 179 million tonnes in 2020. The emissions cap in this sector was first promised during the last year’s election. But clear details about the plan are not available so far.

Sources say that the cap for the end of this decade will be close to the nation’s Emissions Reduction Plan announced last March. If so, it means it will be about 110 million tonnes, which is a 32% reduction over 2005 levels and 46% from 2019.

In the past 30 years, emissions from the sector increased by 83% as gas, oil, and oilsands production also rose.

Proposed Options for Oil and Gas Sector Emissions Cap

1. Cap-and-trade: sets regulated limits on emissions from the sector

The first option is imposing a new regulated, cap-and-trade system for the entire oil and gas sector. As such, there will be certain allowances (carbon credits) given to specific firms via an auction.

Lower-emitting companies can trade credits with higher-emitting ones. Those that don’t buy enough credits to cover their emissions need to buy them from other firms that have more credits than their cap.

The money from the auction would be for funding programs that aid the sector to cut emissions. The total allowances will decline over time in line with the emissions cap for the oil and gas sector.

2. Modifying the carbon pricing requirements

The second option is to alter or impose a steeper carbon price on the sector to cut down emissions. This will demand provincial governments to have their own carbon pricing systems to put in place the changes.

  • The current carbon price in Canada is at $50/tonne and is set to go up to $170/tonne by 2030.

Right now, oil and gas producers can avoid paying a bigger carbon price by buying carbon credits from other sectors. But with the new emissions cap, they can buy credits only from companies within the sector, not outside of it.

The government noted in a background document to the published paper:

“Both options could include some time-limited flexibilities to reflect the timelines of major emission reduction projects.”

While the sector’s emissions intensity (oil sands emissions per barrel of oil) declined by 30% since 1990, it remains higher than its global rivals.

And though most of Canada’s oil and gas companies are already reducing emissions through various means, the sector has a lot to do.

The Oil Sands Pathway Alliance

The Pathway Alliance is the country’s biggest oil sands producers group working together to tackle climate change. It has six member companies, including Suncor, the largest oil sands producer. Together, their operations account for 95% of Canada’s total oil sands production.

The collaboration seeks to bring the sector’s emissions to net zero by 2050. This includes cutting 22 million tonnes of carbon from 2019 levels by 2030. And one major part of their emission reduction strategies is the carbon capture and storage (CCS) projects.

The Alliance’s leading oil and gas producers are not against the emissions cap but said it must be feasible and realistic.

It’s important to note that the new cap-and-trade system must settle key issues involved to prevent confusion. And this must include agreeing on the current emission levels to serve as the baseline for reductions.

  • The Alliance says it’s only about 68 million tonnes in 2019 but the government reports it to be around 83 million tonnes.

The difference is significant and it can impact what reduction measures the sector has to pursue.

The oil and gas sector and its stakeholders can comment on the emissions cap proposals until September 21. The government will reveal the final design early next year.

DeepMarkit Facilitates People Going Carbon Neutral Via MintCarbon.io

DeepMarkit announced that its MintCarbon.io platform can help individuals and families offset their annual carbon footprints to become carbon neutral. This innovative solution is critical in Canada’s commitment to reduce its carbon emissions by 30% by 2030.

Canadians emit about 14.2 tonnes of carbon per person per year. If the average cost of $15/tonne of carbon is applied, an average Canadian can offset their annual carbon footprint for $213.

Using the same cost, an average family size of 2.9 people emitting ~30 tonnes/year can become carbon neutral for a reasonable cost.

Via MintCarbon.io, DeepMarkit helps fight carbon emissions by making it easier for people and businesses that want to drive net zero to buy and retire NFT-based carbon credits on the platform.

MintCarbon.io is a web-based ecosystem that facilitates the minting of carbon credits into NFTs, among other features. The NFT minting process for carbon credits is done by confirming and authenticating them on a carbon project registry.

Once the credits’ authenticity is verified, they can then be minted into carbon credit NFT via MintCarbon.io. Once minted, the user can hold, sell or retire their NFTs on a third-party platform.

Read full news release HERE.