Chery Automobile is steering full speed ahead. The Chinese carmaker posted record revenues and profits for Q4 2025, backed by a stronger global presence and growing investments in new energy vehicles (NEVs) and smart technology. While the future looks bright, investors should keep an eye on the challenges of NEV profitability and the costs of rapid expansion.
Last year, Chery’s net income jumped 34.6% to 19.02 billion yuan ($2.77 billion). This surge came on the back of record global deliveries of 2.63 million vehicles, an 8% rise from 2024.
Revenue also climbed 11.3% to 300.29 billion yuan. Despite tough competition in China’s passenger car market, Chery managed to slightly lift its overall gross margin to 13.8% from 13.5% the year before.
Financial highlights for the year ended 31 December 2025
Data Source: Chery
NEVs Take the Spotlight
Passenger vehicles made up the major revenue at 272.4 billion yuan, or 90.7% of total sales. NEVs stole the spotlight, with sales soaring 66.4% to 98 billion yuan, now making up almost a third of passenger vehicle revenue.
Traditional internal combustion engine (ICE) vehicles fell 7.2% to 174.3 billion yuan, reflecting the ongoing industry shift toward electrification. The surge in NEV sales shows how the market is changing fast, and Chery is clearly keeping pace.
Chery Going Global Pays Off
Chery’s international strategy is paying off.
For the first time, overseas revenue outpaced domestic sales, jumping to 157.4 billion yuan from 100.9 billion yuan, while China’s sales dropped to 142.9 billion yuan.
This milestone highlights how Chery’s global expansion is more than a strategy—it’s a real driver of growth. It also shows the brand’s rising appeal outside China, particularly in markets that value affordable, high-tech, and energy-efficient vehicles.
A Rise in Gross Profit
Overall gross profit increased 14.1% to 41.4 billion yuan, but NEVs still lag behind ICE vehicles on margins, earning 8.8% compared to 15% for ICEs. As NEVs took up a larger share of the passenger vehicle mix, the core business margin slipped slightly to 12.8%.
The EV maker is investing heavily to meet rising global demand, pushing up capital expenditure, marketing, and R&D spending to build capacity and future models. Selling and distribution costs jumped 32.6% due to aggressive marketing campaigns, while research and development spending rose 23.8% as the company accelerated innovation for its next-generation vehicles.
Brand Performance Highlights
Among Chery’s brands, Luxeed and iCar saw the fastest growth. Luxeed sold 90,493 vehicles, up 56% year-on-year, while iCar delivered 96,989 units, a 47% increase.
Meanwhile, the premium Exeed brand fell 15% to 120,369 units, showing that not all segments are booming equally.
This show, Chery is clearly experimenting with a multi-brand approach, pushing emerging names forward while keeping an eye on premium offerings.
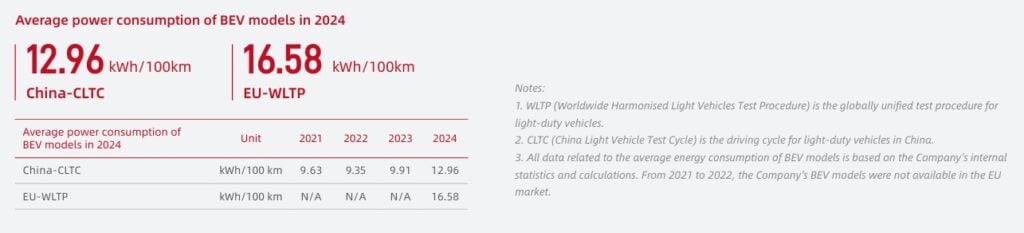
Chery is doubling down on technology to stay ahead. According to the CnEV report, the company planned to unveil its solid-state battery technology at its upcoming “Battery Night,” promising ranges over 1,200 kilometers—a potential game-changer in the EV market.
The solid-state battery module showcased in October 2025 signals Chery’s serious step toward longer-range, high-performance electric vehicles, which could help it compete with international EV leaders.
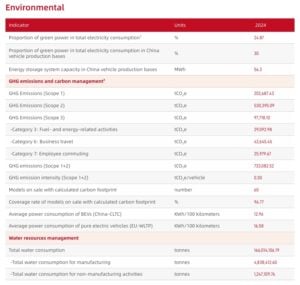
Chery’s Emissions and Energy Use
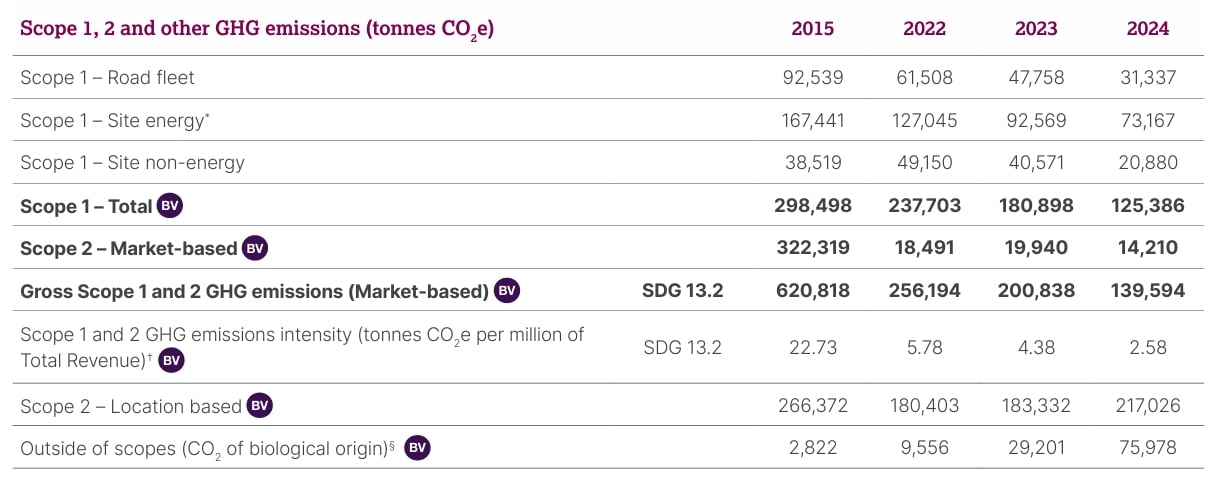
Chery is ambitious about cutting emissions and using energy more efficiently. In its 2024 ESG Report, the company tracks greenhouse gas emissions, energy consumption, and ways to make operations cleaner.
It reports both Scope 1 and Scope 2 emissions—direct emissions from the fuel it uses and indirect emissions from electricity.
Scope 1 emissions rose from 140,000 to 203,000 tonnes of CO₂e in 2024, and total emissions for Scopes 1 and 2 reached over 733,000 tonnes.
Emission intensity, which measures CO₂e per vehicle, rose slightly to 0.30 tCO₂e, reflecting changes in production and energy use.
Source: Chery
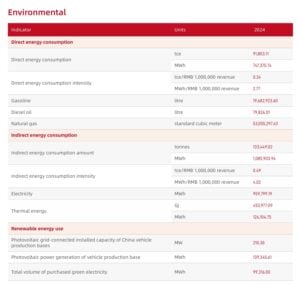
Chery’s energy strategy focuses on cleaner electricity and renewables, aligning with China’s targets for carbon peak by 2030 and carbon neutrality by 2060. About 30% of energy at China plants comes from green sources, and the company has installed 210 MW of solar panels across its facilities. It also improves energy efficiency in factories, cutting energy use and emissions.
Source: Chery
On the vehicle side, it assesses the full lifecycle carbon footprint of nearly all models, from production to end-of-life, helping the company target areas with the highest impact.
To further reduce emissions, Chery is investing in hybrids, NEVs, and supply chain efficiency. Low-carbon materials, energy-efficient manufacturing, and renewable adoption are part of a multi-year transition to greener operations. This approach shows that Chery is serious about sustainability while scaling up production globally.
Smart Mobility and AI
Chery’s guiding philosophy, “Technology Shapes the Future,” reflects a clear commitment to electrification and intelligent mobility. The company is building cross-industry alliances and pushing innovations in AI and smart vehicles.
Its AI governance framework aligns with international standards, covering intelligent cockpits, driver assistance, and quality prediction tools. This ensures that Chery’s vehicles are not only electric but also smart, safe, and ready for future mobility trends.
Innovation in Hybrids and Ethanol Fuel
Chery focuses on hybrid powertrains, next-gen battery tech, and expanding electric vehicle options. The Fulwin, EXLANTIX, and JETOUR Shan Hai series offer hybrid and plug-in options for city driving, long trips, and off-road adventures.
Its fifth-generation Super Hybrid System powers multiple series, offering high fuel efficiency and long-range capabilities, tested under extreme conditions. The tri-motor architecture and 3-speed intelligent electric hybrid DHT enable the JETOUR Shan Hai T2 AWD to accelerate from 0 to 100 km/h in 5.5 seconds while covering over 1,200 kilometers.
Last year, the company rolled out plug-in hybrids compatible with high-ratio E32 ethanol fuel, further cutting carbon emissions and boosting energy flexibility. These moves highlight how the company blends innovation with environmental responsibility.
Source: Chery
Looking Ahead
Chery’s 2025 performance shows a company in transition. Revenues and global sales are surging, NEVs are taking a larger share, and investment in technology and sustainability is accelerating.
However, challenges remain, including NEV profitability, execution risks, and cash flow management. But with strong finances, aggressive R&D, and a clear global strategy, Chery can become a major player in low-carbon, intelligent mobility.
AtkinsRéalis Group has announced a collaboration with NVIDIA to explore nuclear‑powered large‑scale “AI factories.” These facilities are meant to support next‑generation artificial intelligence computing using stable, low‑carbon energy. The work combines AtkinsRéalis’s engineering and nuclear expertise with NVIDIA’s digital and AI design tools.
The project aims to use AI tools like NVIDIA’s Omniverse libraries and accelerated computing systems. These tools help engineers design and test physical infrastructure in a digital, 3D environment before actual construction. AtkinsRéalis said this could speed up the deployment of highly efficient computing hubs powered by nuclear energy.
Ian L. Edwards, President and CEO, AtkinsRéalis stated:
“AtkinsRéalis brings deep engineering and delivery expertise across complex infrastructure and a 70-year legacy of excellence in the nuclear industry. This collaboration enables us to leverage these strengths in energy, infrastructure, and complex project delivery to complement NVIDIA’s leadership in accelerated computing to help power critical AI data centers.”
Why Nuclear Power Matters for AI
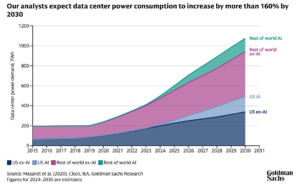
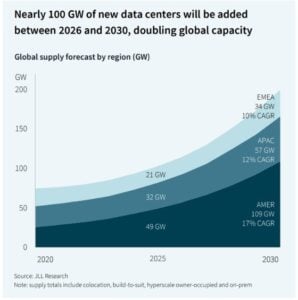
Nuclear energy is seen as a potential solution for very large energy needs. AI data centers and high‑performance computing facilities require constant, very high levels of electricity. Nuclear plants can run 24/7, unlike intermittent sources like solar or wind. This makes them attractive for energy‑intensive AI operations.
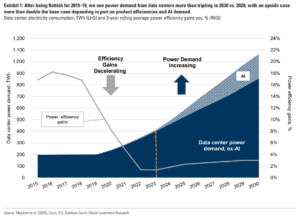
AI computing is driving huge increases in data center energy use. In 2024, global data centers consumed about 415 terawatt-hours (TWh) of electricity. That is enough to power all of Japan for a year.
This figure is forecast to grow to 800 TWh by 2026 and possibly beyond as AI workloads expand rapidly. Some analysts predict that AI will drive 165% increase in data center power demand by the same period.
The world’s leading research and consulting firms also view nuclear as key to meeting future electricity demand. For example, analysts at Goldman Sachs estimate that new nuclear capacity of 85 to 90 gigawatts (GW) may be needed by 2030 to supply power for data centers worldwide.
Nuclear power offers stable, continuous energy — a trait industry leaders call baseload power. This helps facilities operate reliable computing systems without interruptions. Nuclear plants also have very low operational emissions compared with fossil fuels.
AI Tools Designing the Next Power Plants
The AtkinsRéalis–NVIDIA deal highlights another trend: AI is not just a load on power systems. It is also a tool for designing and optimizing new power infrastructure.
NVIDIA’s Omniverse and AI analytics can simulate everything from heat flow to electrical load in highly complex systems. This allows engineers to design layouts and workflows with precision. It also helps in digital twin modeling: creating virtual replicas of physical systems to test performance before building.
These tools can support nuclear reactor design, safety planning, and integration with computing facilities. AI can also help optimize operations, lowering costs and improving reliability.
The partnership focuses on three key areas to support the development of nuclear-powered AI infrastructure:
Nuclear + AI integration: AtkinsRéalis will link its CANDU® reactors with AI data centers, while NVIDIA provides computing and digital twin tools.
Faster project delivery: AI, simulation, and Omniverse tools aim to speed up design and construction and improve safety.
Data center engineering: AtkinsRéalis will deliver power, cooling, and modular systems for efficient AI facility deployment.
Energy analysts believe that using digital tools with nuclear power can speed up new energy projects. This includes small modular reactors (SMRs), which are viewed as a key source of carbon-free energy for the future.
SMRs are typically smaller and more modular than traditional reactors. They may be built faster and at lower cost. Many technology companies and utilities are exploring SMRs for new power capacity to meet rising energy demand.
Data Center Boom Reshapes Global Energy Demand
AI’s rise has reshaped energy demand. As shown below, power needs for data centers could double or more by 2030 compared with 2024 levels. This growth comes from both AI training workloads and everyday data processing.
Data center energy demand is expected to grow faster than many other industrial sectors. Some forecasts suggest that electricity consumption by data centers could account for up to 12% of total U.S. power demand by 2028.
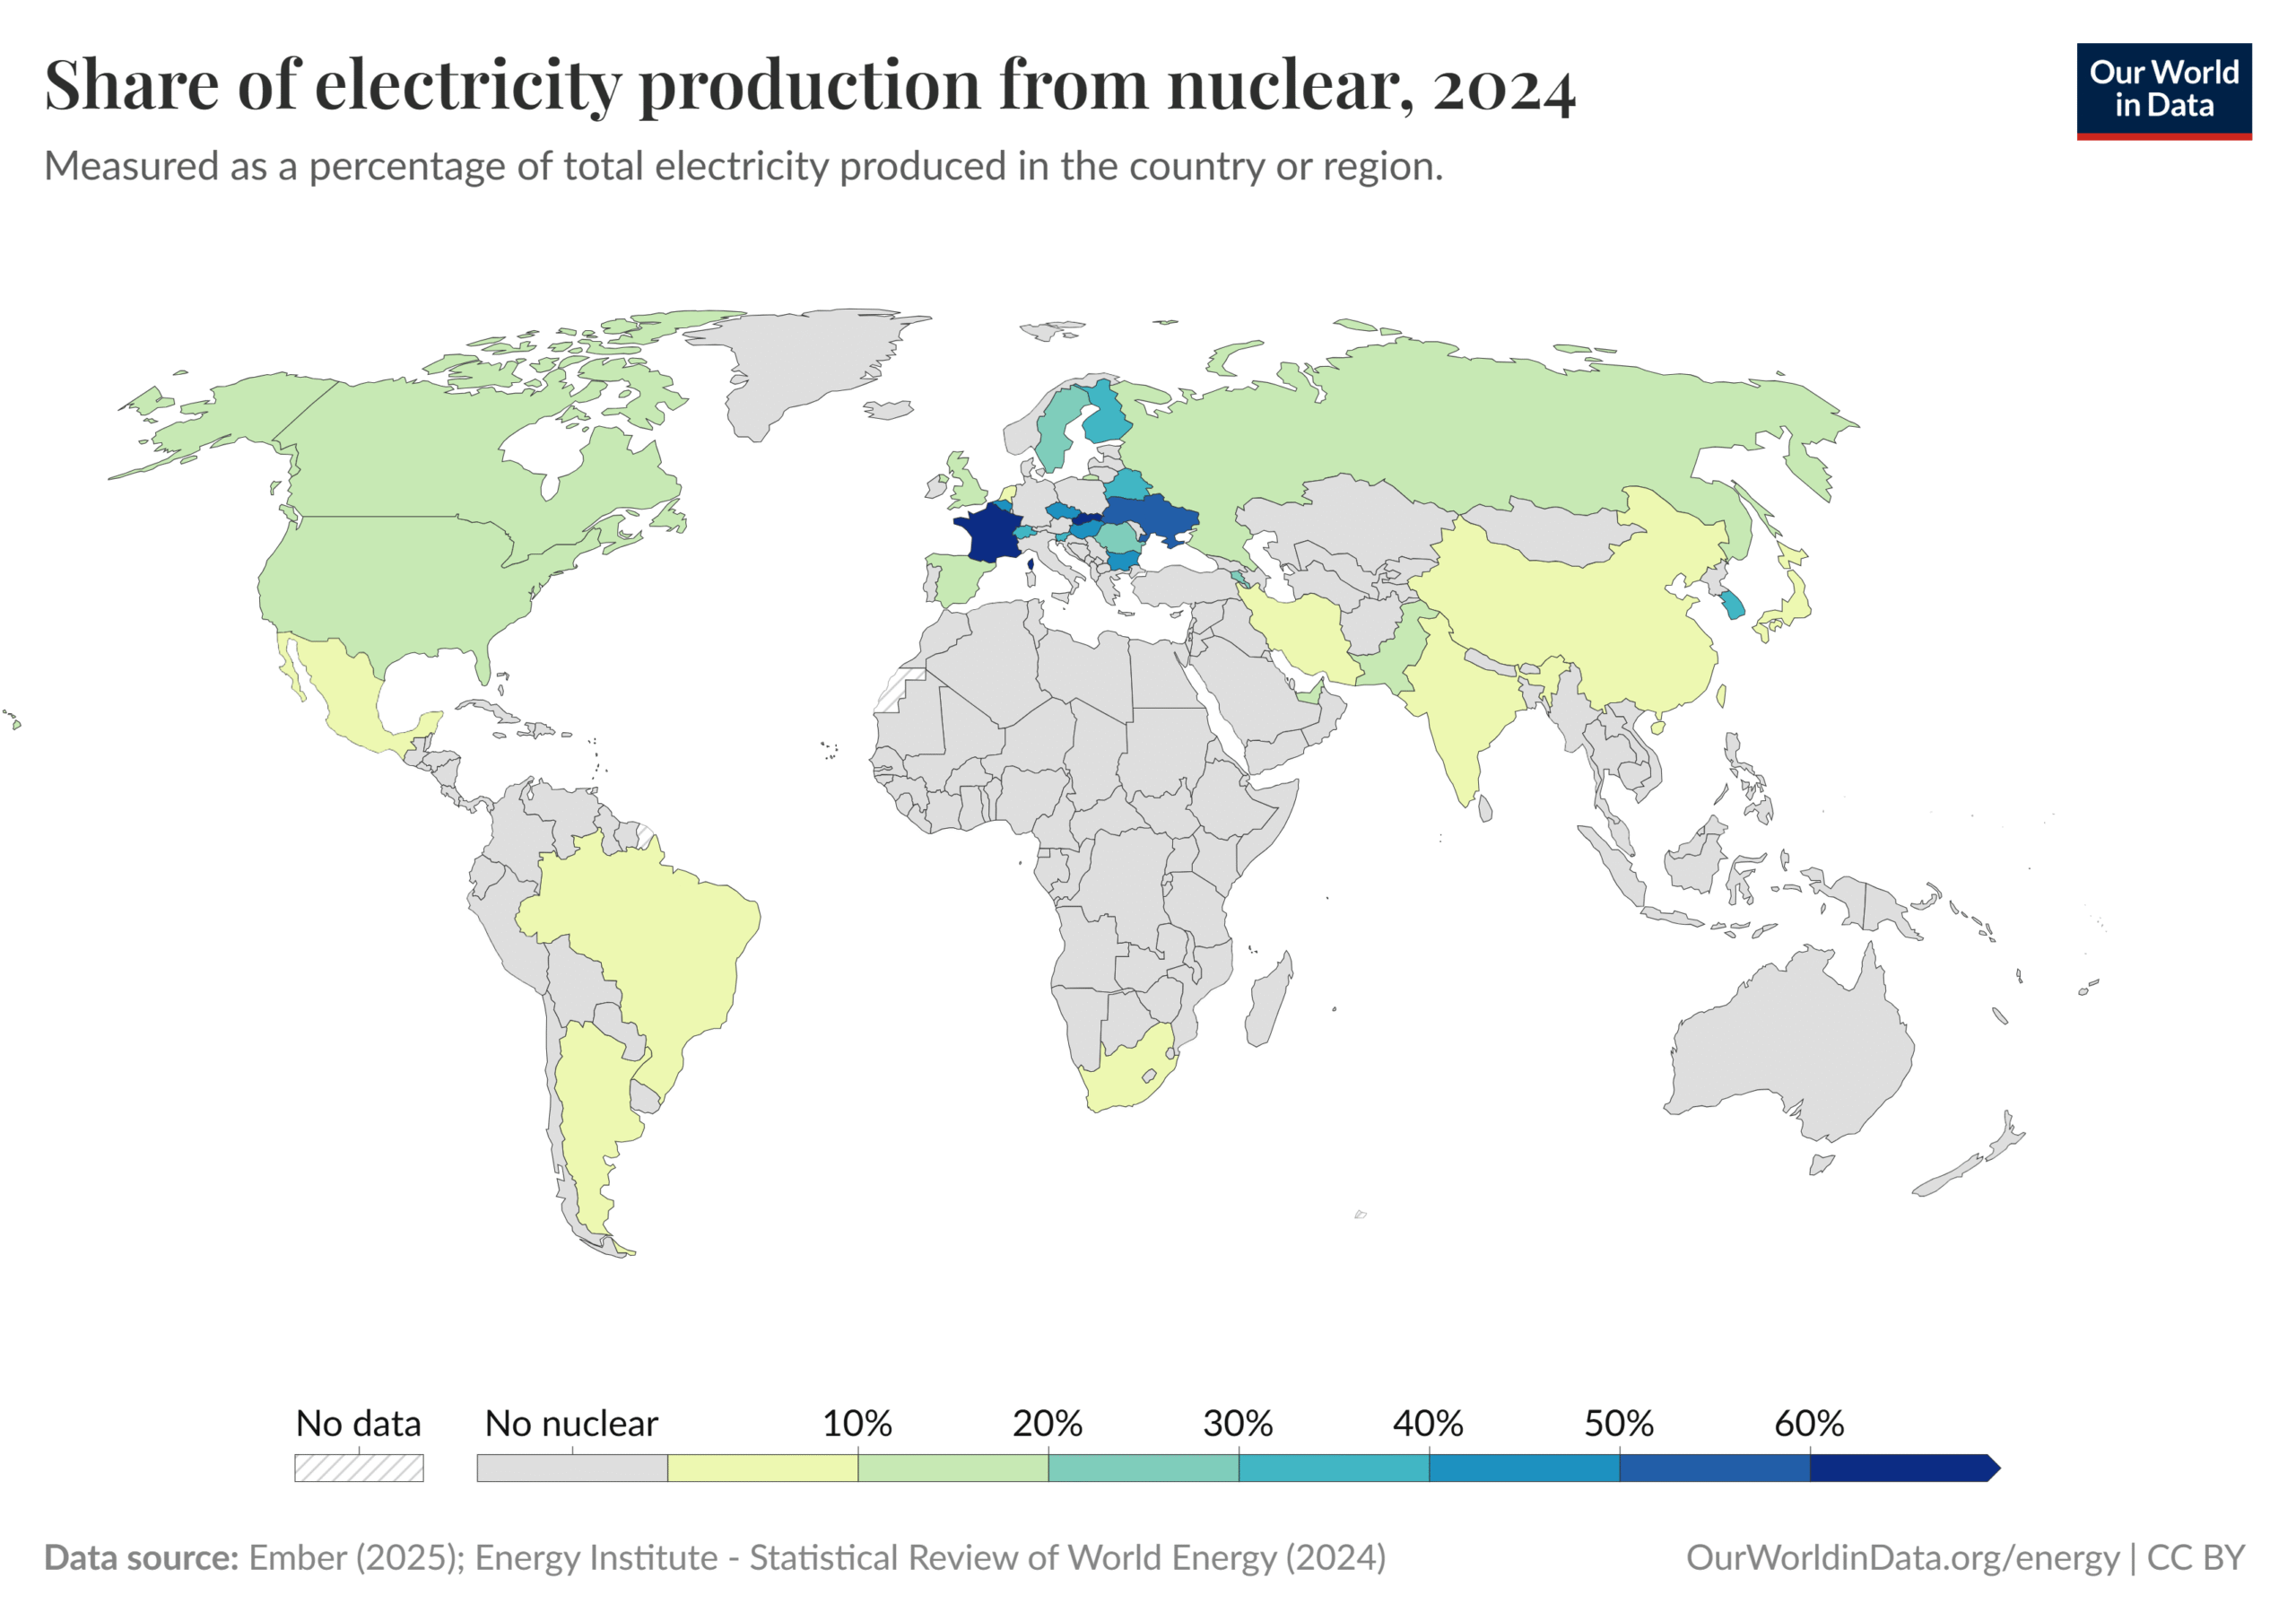
Globally, around 15% of data center energy comes from nuclear power. This number is growing as companies make long-term deals with nuclear providers. Renewables (wind and solar) also play a growing role, with their share expanding due to climate goals and cost declines.
Despite this growth, fossil fuels still supply a large share of data center power today — around 56% globally — leading to rising carbon emissions unless clean sources are scaled rapidly.
Many major tech companies have set ambitious targets for net‑zero emissions. These targets focus on three main goals:
Powering data centers with zero-carbon electricity.
Improving energy efficiency.
Adopting new technologies like nuclear energy or carbon capture.
Can Nuclear Keep Up with AI Growth?
Investments in nuclear energy are rising. In 2025, nuclear capacity is expected to grow by about 29 GW worldwide, with more than half of that expansion in China and India.
Some nations are doubling down on nuclear power to support digital growth and energy security. France, for example, gets over 70% of its electricity from nuclear and is pushing to power new AI facilities with low‑carbon energy.
SMRs are gaining attention because they can be located closer to industrial or urban centers. Full commercialization of SMR technology is expected around 2030, making it a key component for future data center energy strategies.
In the clean energy market overall, nuclear power’s share is expected to grow alongside wind and solar. The International Energy Agency says that nuclear, renewables, and other low-carbon sources must grow a lot. This growth is needed to meet increasing electricity demand and reduce emissions.
Cost, Regulation, and Public Trust
Despite these trends, challenges remain. Nuclear infrastructure is expensive and time‑intensive to build. Regulatory hurdles, licensing processes, and community acceptance can slow deployment. Public perception of nuclear safety also affects project timelines. Analysts say streamlined permitting and clear safety standards will be needed to scale nuclear for data center support.
Moreover, deploying nuclear‑powered AI factories requires long‑range planning. Construction can take years, and financing relies on government incentives and private investment. Nuclear projects often require large capital outlays upfront, which can slow adoption without policy support.
At the same time, data centers are rapidly evolving. Advanced cooling systems help reduce energy use. AI workload scheduling makes tasks more efficient. Energy-efficient hardware also cuts the sector’s footprint. These technologies can reduce overall energy demand, but they do not eliminate the need for stable, baseload power sources like nuclear.
The Convergence of Energy and Computing
The collaboration between AtkinsRéalis and NVIDIA points to a future where energy and computing strategies are tightly linked. As AI demand grows, the need for reliable, low‑carbon energy becomes more urgent. Nuclear energy offers a potential answer — one that can deliver power around the clock without emissions.
Big tech companies are already exploring nuclear solutions. For example, Meta has signed long‑term agreements to secure hundreds of megawatts of nuclear power for its data centers, and Google is building small modular reactors to power AI operations.
The integration of AI design tools with nuclear engineering can speed up planning, improve safety, and reduce cost risk. This is important if large‑scale AI infrastructure is to be built in a way that supports sustainability goals.
As the energy and tech sectors converge, nuclear‑powered AI factories may represent a new evolution in how computing hubs are powered and designed. If successful, this trend could reshape data center energy strategies and help meet the growing power demand of the AI era with low‑carbon solutions.
Google has signed a major deal to buy carbon removal credits from an affiliate of AMP Robotics. The agreement targets the removal of 200,000 metric tons of carbon dioxide equivalent (CO₂e) by 2030. It is one of Google’s largest carbon removal purchases to date.
The project uses artificial intelligence (AI) to sort municipal solid waste. Organic waste is separated before it reaches landfills. Instead of decomposing and releasing methane, the waste is turned into biochar. Biochar is a stable material that can store carbon for hundreds of years.
The deal shows how large companies are moving beyond simple offsets. They are now funding durable carbon removal solutions that can scale over time.
AI + Biochar: Turning Trash into Carbon Storage
The project’s approach tackles two problems at once. It reduces methane emissions in the short term. It also removes carbon dioxide for the long term. Methane is a powerful greenhouse gas. In the United States, landfilled waste is the third-largest source of human-caused methane emissions, according to the U.S. Environmental Protection Agency.
Reilly O’Hara, Program Manager, Carbon Removal at Google, remarked:
“Beyond the carbon removal itself, we are excited to explore the dual-action impact of AMP’s approach on methane – a superpollutant 80x more potent than CO2. By diverting organic matter before it decomposes and utilizing biochar in landfill soil covers to neutralize existing gases, this partnership could serve as a blueprint for eliminating emissions at the source, leveraging existing industry, and creating a scalable model for the circular economy.”
The AMP system uses AI to identify and sort materials from mixed waste streams. The company says its platform has already identified more than 200 billion items and processed 2.9 million tons of recyclables globally.
In this project, the system will process up to 540,000 tons of waste per year in Virginia. At least 50% of this waste will be diverted from landfills. Each ton of waste diverted can reduce or remove more than 0.7 tons of CO₂e. That adds up to over 378,000 tons of CO₂ avoided or removed each year. This is equal to taking about 88,000 cars off the road annually.
The project is backed by a 20-year contract with a regional waste authority serving 1.2 million people. Over time, AMP aims to convert 5 million tons of organic waste into biochar over 20 years.
image here….
Biochar also has added uses. It can be used in landfills to reduce odors and control pollution. It may also be used in construction and cement. This creates new value streams while storing carbon.
The deal reflects a wider shift in the carbon market. Companies are now focusing on carbon dioxide removal (CDR) instead of traditional offsets. Carbon removal captures CO₂ from the atmosphere and stores it for long periods.
The market is still small but growing fast. A coalition backed by major companies, including Google, has committed to spending $1 billion on carbon removal credits by 2030.
Recent deals show rising demand:
Google agreed to buy 100,000 tons of carbon removal credits from an agricultural biochar project in India.
It also signed a deal for 50,000 tons of removal credits using underground waste storage technology.
Prices for high-quality removal credits remain high. Some deals have reached around $362 per ton, reflecting early-stage technology and limited supply.
At the same time, developers are working to scale production and lower costs. Biochar is seen as one of the more practical options today because it uses existing waste streams and proven processes.
Methane Matters: Quick Wins for the Climate
One reason this deal matters is its focus on methane. Methane causes much faster warming than CO₂ in the short term. Reducing methane can deliver quick climate benefits.
Waste is a major methane source. When organic waste breaks down in landfills, it releases methane gas. By diverting this waste early, AMP’s system prevents methane from forming at all.
This makes waste-based carbon removal different from many other methods. It combines emissions avoidance and carbon removal in one process.
This dual benefit is attracting attention from companies and policymakers. Many climate strategies now include methane reduction as a priority. Technologies that can do both removal and avoidance may scale faster than single-purpose solutions.
Beyond market impact, the deal highlights how Google is managing its rising emissions.
How This Fits Google’s Climate Strategy
The deal is part of Google’s wider plan to reduce its climate impact. The company has set a goal to reach net-zero emissions across its operations and value chain by 2030. It also aims to run on 24/7 carbon-free energy by 2030, meaning every hour of electricity use is matched with clean energy.
Source: Google
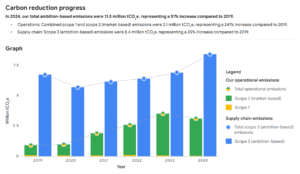
However, Google’s emissions have risen in recent years. In its 2024 environmental report, the company noted around 11.5 million tonnes of ambition-based CO₂e emissions. This marks an 11% rise from 2023 and is about 51% higher than in 2019. The increase shows ongoing growth in energy use, mainly from AI-powered data centers and expanded infrastructure.
Source: Google
Because of this, Google is using carbon removal to address emissions it cannot fully eliminate. The company has said it will rely on high-quality carbon removal credits instead of traditional offsets. These credits must remove carbon from the atmosphere and store it for long periods.
The tech giant is also a founding member of Frontier, a coalition of companies committed to spending $1 billion on carbon removal by 2030. The group helps fund early-stage technologies and scale supply.
This strategy reflects a broader shift among tech companies. As energy use grows, especially from AI and cloud computing, firms are investing more in carbon removal to meet climate targets.
Carbon Removal Demand Surges, But Supply Falls Short
The Google–AMP deal shows how fast the carbon removal market is growing. But the market is still far from the scale needed to meet climate goals. Today, global emissions remain high at about 38 gigatonnes of CO₂ in 2024, according to the International Energy Agency.
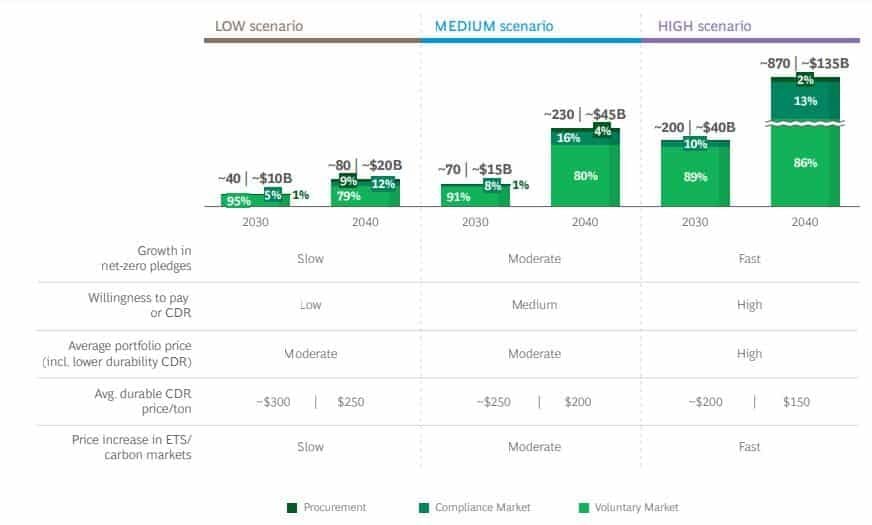
To balance these emissions, demand for carbon removal is rising quickly. Estimates show the market could reach 40 to 200 million tonnes of CO₂ removal per year by 2030, and as much as 80 to 900 million tonnes by 2040. This could create a $10 billion to $40 billion market by 2030, growing to as much as $135 billion by 2040.
Source: BCG analysis
At the same time, supply is still limited. Current announced projects may only deliver around 33 million tonnes by 2030, far below expected demand. This gap is one reason large buyers like Google are signing long-term deals early. These agreements help scale new technologies and secure future supply.
Long-term, carbon removal will play a major role in climate strategy. Some projections show that removal capacity must reach around 1.7 gigatonnes per year by 2050 to meet global climate targets. Carbon capture alone could deliver about 12% of total emissions reductions between 2030 and 2050, especially in heavy industries like cement and steel.
Source: DNV Report
Investment is also rising fast. In the past five years, the number of carbon removal startups has grown fivefold, and venture funding has increased sevenfold. This shows strong interest from both private investors and large companies.
Closing the Carbon Gap
Still, challenges remain. Costs are high, and standards are still evolving. Some forecasts suggest the market could reach up to $100 billion per year by the early 2030s, but only if policy support and financing improve.
In this context, the Google–AMP deal reflects a clear shift. Companies are moving early to secure high-quality carbon removal. They are also helping build the market from the ground up. Waste-based solutions like biochar may scale faster because they use existing systems and deliver both methane reduction and carbon storage.
Overall, carbon removal is moving from a niche idea to a core part of climate strategy. But the gap between current supply and future demand remains large. Closing that gap will require strong investment, clear rules, and continued innovation across the sector.
Thorium is making a strong comeback in the global energy conversation. For decades, it remained on the sidelines while uranium dominated nuclear power. Now, the shift toward net-zero emissions is changing that story. Countries need reliable, low-carbon energy that works around the clock. As a result, advanced nuclear technologies are gaining attention again—and thorium is leading that discussion.
At the same time, rapid innovation in reactor technologies is making thorium more practical. Designs such as molten salt reactors and small modular reactors are unlocking its potential. This combination of policy support, technological progress, and climate urgency is pushing thorium from theory toward reality.
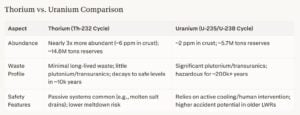
Thorium vs Uranium: A New Nuclear Equation
Thorium is a naturally occurring radioactive metal found in the Earth’s crust, but it works differently from uranium. It is not directly fissile, which means it cannot sustain a nuclear reaction on its own. Instead, thorium-232 absorbs neutrons inside a reactor and transforms into uranium-233. This new material then drives the nuclear reaction.
This process may sound complex, but it delivers clear benefits. Thorium reactors or thorium-based fuel systems are more stable under high temperatures. They also reduce the risk of catastrophic failure, such as meltdowns. In addition, they generate far less long-lived radioactive waste compared to conventional uranium reactors
Another factor is safety. Many thorium reactors use passive safety systems that rely on natural processes, which lowers the risk of accidents. Uranium reactors, especially older ones, depend more on active cooling and human control.
Geopolitics also plays a role. Uranium supply is concentrated in a few regions, creating risks. Thorium is more widely available, which improves energy security and reduces dependence on specific countries.
However, uranium still has a clear advantage today. Its infrastructure is already in place, and it has long powered nuclear energy. Often called “yellow gold,” it is well understood and widely used with a mature supply chain. Thorium still needs new reactor designs, fuel systems, and regulatory support, so it is more likely to complement uranium in the near term.
For many years, thorium remained underutilized because conventional reactors were not designed for it. Today, that is changing. New reactor technologies are making thorium more viable.
Molten Salt Reactors (MSRs): Use liquid fuel for better heat transfer and low pressure, improving safety, efficiency, and thorium utilization.
Advanced Heavy Water Reactors (AHWRs): Support mixed fuel use, enabling gradual thorium adoption; central to India’s nuclear strategy.
Small Modular Reactors (SMRs): Compact and flexible systems that are easier to deploy; increasingly designed to support thorium fuel cycles.
Liquid Fluoride Thorium Reactors (LFTRs): A type of MSR offering high efficiency and built-in safety, making them a leading thorium energy solution.
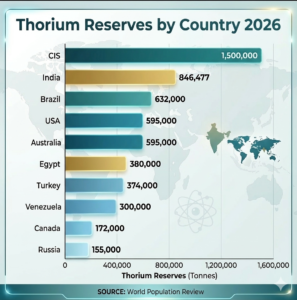
Global Thorium Reserves Highlight Long-Term Potential
Thorium’s abundance is one of its strongest advantages. According to geological assessments, these reserves could theoretically generate electricity for several centuries if fully utilized in advanced reactor systems. That makes thorium not just an alternative fuel, but a long-term energy solution.
Even when compared to rare earth elements, which total around 120 million tons globally, thorium remains highly competitive in terms of its energy potential, despite differences in extraction economics.
USGS data shows that the geographic spread of thorium further strengthens its appeal.
Major reserves are located in India, Brazil, Australia, and the United States. India leads with approximately 850,000 tons, followed by Brazil with 630,000 tons. Australia and the United States each hold around 600,000 tons.
In addition, countries within the Commonwealth of Independent States collectively hold about 1.5 million metric tons of thorium. This includes nations such as Kazakhstan, Uzbekistan, and Azerbaijan. This wide distribution supports global energy security by reducing reliance on a limited number of suppliers.
Regional Highlights
Asia-Pacific leads with over 55% of global share in 2025, supported by strong government backing, active research programs, and growing use of rare earth materials.
Countries like India and China are driving this growth. Rising energy demand and long-term policies are accelerating investment in thorium technologies. They are not just researching but actively preparing for deployment.
Meanwhile, North America is the fastest-growing region. Increased funding and private sector involvement are boosting innovation, especially in next-generation reactors that can use thorium fuel.
Together, this regional momentum is driving global competition and pushing the race for leadership in thorium energy.
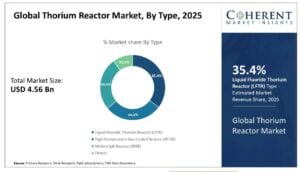
Thorium Market Size and Demand Drivers
Market research reports indicate that the global thorium reactor market is projected to grow from $4.56 billion in 2025 to $8.97 billion by 2032, with CGAR 10.1%. This growth reflects increasing demand for clean, reliable, and low-carbon energy.
At the same time, other broader market estimates suggest the thorium sector could reach $13 billion by 2033, growing at a more moderate 4% rate. These figures include not just fuel, but also materials, reactor development, and associated technologies.
Several factors drive this growth. Governments are increasing investments in clean energy technologies. Research institutions are advancing reactor designs. At the same time, the need for energy security and reduced carbon emissions is becoming more urgent.
These converging trends are positioning thorium as a strategic energy resource. While large-scale commercialization is still ahead, the direction of growth is clear.
Competitive Landscape: A Market Defined by Innovation
The thorium market is still in its early stages, and this is reflected in its competitive landscape. Unlike mature energy sectors, it is not dominated by large-scale commercial players. Instead, it is shaped by collaboration, research, and pilot projects.
Copenhagen Atomics’ Strategic Partnership with Rare Earths Norway
As the industry evolves, partnerships are becoming increasingly important. One notable example is Copenhagen Atomics, which has signed a Letter of Intent with Rare Earths Norway. This agreement aims to secure access to thorium from the Fensfeltet deposit in Norway.
This partnership highlights a key shift in how thorium is viewed. It is now being recognized as a valuable energy resource. By integrating thorium into supply chains, companies are laying the groundwork for future commercialization.
Copenhagen Atomics is also developing modular molten salt reactors designed for mass production. This approach requires not only technological innovation but also a reliable supply of materials. Partnerships like this are critical for building that ecosystem.
Thorium molten salt reactor, with the focus on low electricity price and fast installation
Source: Copenhagen Atomics
India’s Thorium Strategy Sets a Global Benchmark
India stands out as one of the most advanced players in the thorium space. Its nuclear program is built around a three-stage strategy designed to fully utilize its domestic thorium reserves.
The country’s Department of Atomic Energy and Atomic Energy Commission are leading this effort. Research institutions are developing advanced reactor designs, including the Advanced Heavy Water Reactor and molten salt systems.
One of the key milestones is the Prototype Fast Breeder Reactor at Kalpakkam, which is expected to play a crucial role in producing uranium-233 from thorium. This will enable a closed fuel cycle, improving efficiency and sustainability.
Private sector involvement is also growing. Clean Core Thorium Energy is supplying advanced fuel for testing in existing reactors. At the same time, companies like NTPC and Larsen & Toubro are supporting large-scale deployment and infrastructure development.
India’s long-term vision is ambitious. With its vast thorium reserves, the country aims to secure an energy supply for up to 200 years. This strategy not only strengthens energy security but also positions India as a global leader in thorium technology.
Thor Energy: Leading in Fuel Development
Companies like Thor Energy are leading the way in fuel development. Their work on thorium-plutonium mixed oxide fuel and ongoing irradiation testing provides valuable real-world data. Similarly,
Other players are taking different approaches:
Ultra Safe Nuclear Corporation is integrating thorium fuel cycles into its Micro Modular Reactor design. This approach focuses on creating a fully integrated energy system.
NRG in the Netherlands is conducting critical experiments that provide data on reactor performance and fuel behavior.
National laboratories also play a key role. Organizations such as Atomic Energy of Canada Limited provide the expertise and facilities needed to support research and development. Their contributions are essential for advancing the technology.
Overall, the market is best described as a technology race. Companies are not competing on volume yet. Instead, they are competing to prove that their solutions work at scale.
A Strong Fit for the Net-Zero Transition
The global push for carbon neutrality is a major driver behind thorium’s rise. More than 130 countries have set or are considering net-zero targets. Achieving these goals requires a mix of energy solutions.
As we may already know, renewables like solar and wind are essential, but they are not always reliable. Their output depends on weather conditions, which creates gaps in the electricity supply. These gaps must be filled by stable, low-carbon sources.
Thorium-based nuclear power offers exactly that. It provides consistent baseload electricity without producing greenhouse gas emissions during operation. At the same time, it addresses key concerns associated with traditional nuclear energy, such as safety and waste.
This alignment with climate goals is driving interest in thorium. Governments are exploring it as part of broader energy strategies. Investors are also paying attention, recognizing its long-term potential. Simply put, this phase can be seen as a technology race. The goal is to prove that thorium systems can operate safely, efficiently, and economically at scale. Success in this area will determine the pace of market growth.
The conflict in the Middle East is raising doubts about major carbon capture projects in the Gulf region. Carbon capture, utilization, and storage, known as CCUS, is a technology that prevents carbon dioxide (CO₂) from entering the atmosphere. It captures CO₂ from industrial sources and stores it underground or uses it in industrial processes. CCUS is seen as crucial for cutting hard‑to‑abate emissions from oil, gas, cement, and steel.
Gulf Ambitions Hit the Pause Button
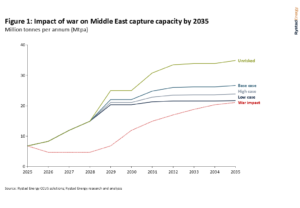
Before the conflict, Gulf plans aimed for about 20 million tonnes per year (Mtpa) of CCUS capacity by 2030. This would have positioned the region as a key global hub. But Rystad Energy says this is now unlikely. The pipeline may shrink closer to the lower case of around 12 Mtpa by 2035 due to delays and repriced risk.
Source: Rystad Energy
The Gulf’s CCUS buildout has strong logical drivers. The region has abundant oil and gas operations, and projects often connect to those facilities. However, when the upstream energy system is disrupted, CCUS plans can be delayed, pushed back, or re‑evaluated. This change affects investors’ view of CCUS as a near‑term investment in the region.
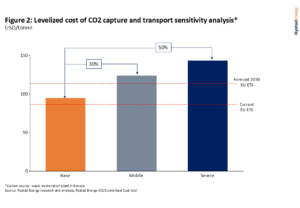
Rising Costs and Risk Reprice Carbon Capture
One major risk from prolonged conflict is rising energy costs. If energy prices jump — which often happens during regional conflict — the cost to capture and transport CO₂ also rises.
Rystad’s analysis shows that a 50 % rise in energy prices could increase capture and transport costs by about 30 %. That could push the cost of capturing a tonne of CO₂ well above the price range expected by 2030 in the European Union’s emissions trading system.
The analysis suggests an increase from $95 per tonne to $124 per tonne using a ‘middle impact’ case, where energy prices rise about 50%.
Source: Rystad Energy
Higher costs come from more expensive power, higher equipment prices, and slower supply chains. All these pressures hit CCUS projects hard because they are already more costly than conventional infrastructure.
Energy‑intensive capture systems need cheap, reliable supplies of power and materials. Rising inflation and disrupted supply chains could reduce availability and slow project build‑outs.
Longer project timelines may also raise the cost of capital. Investors typically demand higher returns when projects take longer or face greater uncertainty. In some cases, projects may only move forward if they are supported by governments or strategic partners, especially when the cost per tonne of CO₂ captured rises above key benchmarks.
While the Gulf faces near‑term risks, the global CCUS market has continued to grow. A large number of projects are being developed worldwide.
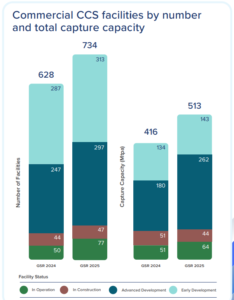
As of 2025, ~628 CCUS projects are tracked globally across all stages, with potential capture capacity exceeding 416 Mtpa if completed. Operational capacity reached 64 Mtpa from 77 facilities. The breakdown by number of facilities and total capture capacity is as follows:
Source: Global CCS Institute
The market is growing because many governments and companies have adopted emission‑reduction mandates. About 63 % of industries say these mandates accelerate CCUS deployment.
Nearly 55 % of new CCUS projects are integrated with other low‑carbon technologies like hydrogen or renewable energy.
Source: Global CCS Institute
North America leads global capacity, accounting for about 46 % of total CCUS project capacity. Europe holds around 26 %, Asia‑Pacific about 21 %, and the Middle East & Africa roughly 7 % of the total project pipeline.
The oil and gas sector remains the largest user of CCUS, making up about 53 % of the global captured CO₂. Industrial decarbonization in sectors like cement and steel now represents around 25 % of the planned capacity worldwide.
Source: IEA estimations
Market research also shows that the CCS market size was estimated at about USD 3.9 billion in 2025, growing at a compound annual growth rate (CAGR) of 7 % to reach USD 6.7 billion by 2033. This growth reflects rising investments in decarbonization technologies across industrial and power sectors.
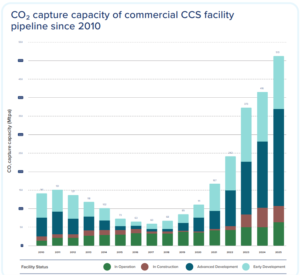
Long-Term Outlook: The Gigaton Challenge
CCUS projects are growing, but still fall far short of what climate models recommend. A recent Rystad Energy forecast suggests that global CCUS capacity could expand to more than 550 million tonnes per year by 2030. That’s more than a tenfold increase over today’s roughly 45 million tonnes per year of captured CO₂.
However, this projected expansion is still far below what many climate scenarios require. Limiting global warming to under 2 °C often needs CCUS to capture nearly 8 gigatonnes of CO₂ each year by 2050 in many energy transition models. That means growth must accelerate sharply after 2030 to meet climate goals.
The IDTechEx forecast shows a strong long‑term outlook for CCUS. It estimates global capture capacity will hit around 0.7 gigatonnes per year by 2036. This indicates rapid growth, with a CAGR over 20% from 2026 to 2036. This would place CCUS as a major technology in global decarbonization, if investment and deployment scale up quickly.
What This Means for the Gulf and the World
For the Gulf region, rising geopolitical risk is changing how CCUS projects are evaluated. Many planned build‑outs linked to oil and gas value chains may be slowed or repriced as risk premiums rise.
Some analysts now expect that Gulf CCUS capacity may align with a more cautious trajectory through the mid‑2030s rather than a rapid 2030 build‑out. Moreover, the 8 Mtpa shortfall equals 1.5% of the projected 550 Mtpa global capacity, placing intense pressure on North America and Europe to accelerate.
Rising costs from energy price shocks further complicate the equation. With Middle East & Africa capacity shrinking from 7% to ~4% of the total pipeline, US 45Q projects and EU ETS industrial clusters must find enough replacement capacity.
Still, global drivers for CCUS remain strong. Governments and companies worldwide continue to plan and build projects. New technologies and integrations with hydrogen, renewable energy, and industrial clusters could help spread costs and scale the technology.
As many countries expand their net‑zero plans, CCUS will play a key role in managing emissions that are difficult to eliminate through electrification or fuel switching alone.
In this evolving landscape, the CCUS market is poised for significant long‑term growth, but near‑term geopolitical disruptions and cost pressures will require careful planning, strong policy support, and sustained investment. Strategic partnerships and global cooperation will be key to ensuring that CCUS can meet both economic and climate goals.
Disseminated on behalf of Alaska Energy Metals Corporation.
nickel Price Analysis Today
Nickel advanced 1.12% to $17,326.97/ton globally and ¥119,588/ton in China, propelled by key supply and macroeconomic catalysts. The primary driver is Indonesia’s presidential approval of new nickel export tariffs, compounding existing supply tightness from restrictive RKAB production quotas. Furthermore, broader market sentiment strengthened following a U.S. proposal for a one-month Middle East ceasefire. The People's Bank of China also bolstered industrial demand expectations by injecting 500 billion yuan in liquidity via a medium-term lending facility.
As the global energy transition accelerates, access to critical minerals is becoming just as important as innovation itself. Among these materials, nickel plays a central role. It powers electric vehicle batteries, supports energy storage systems, and remains essential for industrial applications such as stainless steel. Yet, while demand continues to climb, supply risks are growing—largely due to Indonesia’s tightening control over global nickel production.
In this shifting landscape, Alaska Energy Metals Corporation (AEMC) is advancing its Nikolai Nickel Project in interior Alaska. The project is emerging as a potential domestic anchor for U.S. nickel supply at a time when geopolitical, environmental, and market pressures are reshaping the global nickel industry.
Indonesia’s Nickel Dominance—and Its Strategic Pullback
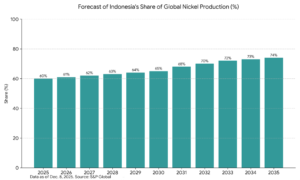
Indonesia currently dominates global nickel supply, accounting for nearly half of the world’s mined output. Over the past decade, the country expanded production rapidly, flooding the market and pushing prices lower. However, that era appears to be ending.
In January, Indonesia’s Ministry of Energy and Mineral Resources announced a sharp reduction in nickel ore production quotas. For 2026, the government set quotas at 250–260 million tonnes, down significantly from the 379 million tonnes approved for 2025. This shift represents one of the most aggressive supply controls the nickel market has seen in years.
At the same time, Indonesia changed the validity of its mining work plans (RKABs) from three years to one. As a result, the government now holds direct annual control over production levels, allowing it to adjust supply more tightly in response to prices, environmental pressures, and domestic processing capacity.
The policy pivot aims to preserve long-term reserves, stabilize prices, and push miners toward value-added processing such as nickel matte production for EV batteries. However, it also introduces uncertainty for global buyers that rely heavily on Indonesian supply.
Short-Term Surplus, Long-Term Risk
On the surface, the nickel market still appears well supplied. Analysts forecast a 261,000-tonne surplus in 2026, with global supply estimated at 3.78 million tonnes compared to demand of 3.52 million tonnes. Inventories remain elevated due to previous years of overproduction.
Yet this balance may prove fragile. Actual production in 2025 already fell short of approved quotas due to underutilized capacity and rising costs. If prices weaken further, high-cost operations could shut down, tightening supply faster than expected.
Meanwhile, demand continues to grow. The IEA projects that the use of nickel in EV batteries, renewables, and stainless steel will push nickel demand above 5.5 Mt by 2035. As Indonesia tightens output and China dominates downstream processing, Western economies face rising exposure to supply disruptions and geopolitical leverage.
Against this backdrop, the Nikolai Nickel Project represents a rare opportunity for the United States.
Located in interior Alaska, Nikolai hosts the Eureka deposit, now recognized as the largest nickel resource in the U.S. Beyond nickel, the deposit also contains copper, cobalt, chromium, platinum, and palladium—metals that play key roles in clean energy, defense systems, and advanced manufacturing.
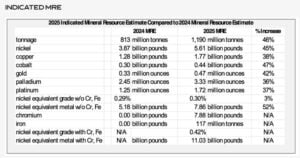
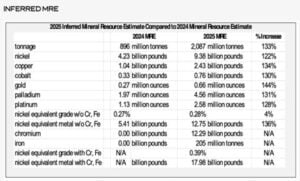
In March, AEMC released an updated 2025 Mineral Resource Estimate, which significantly upgraded the project’s scale and quality. The update increased both tonnage and metal content compared to the 2024 estimate.
Measured and Indicated Resources now include 61 billion pounds of nickel and 1.77 billion pounds of copper, representing a 46% increase. Inferred resources rose even more sharply, climbing over 120% to 9.38 billion pounds of nickel and 2.43 billion pounds of copper.
Importantly, the deposit remains open in three directions, suggesting additional expansion potential as exploration continues.
Here are the tables that show Nikolai’s 2025 mineral resource estimates:
Source: AEMCSource: AEMC
Geology That Supports Long-Term Development
Nikolai’s geological characteristics further strengthen its strategic appeal.
The Eureka deposit features highly consistent and continuous mineralization, reducing geological risk. A higher-grade core sits near the surface, which may lower mining costs during early production phases. In addition, a low strip ratio supports efficient material movement and long-term mine planning.
Equally important, Nikolai is dominated by sulfide mineralization, rather than lateritic ore. This distinction matters. Lateritic nickel, common in Indonesia, requires energy-intensive processing and often carries a higher carbon footprint. Sulfide deposits typically allow for more straightforward processing routes with lower emissions.
Source: AEMC
Cleaner Processing and On-Site Refining Potential
To build on this advantage, AEMC is actively exploring cleaner processing pathways.
Metallurgical testing is underway at SGS Laboratories in Lakefield, Ontario, where the company has conducted extensive work using magnetic separation and flotation techniques. A processing flow sheet has already been established, and a locked-cycle test is scheduled in the near term.
The current plan aims to produce:
A bulk nickel–copper–cobalt concentrate
A separate iron–chromium concentrate
Further testing will determine whether copper can be separated into its own concentrate to improve overall economics. The miner planned to publish metallurgical results in November 2025.
In parallel, the company signed a memorandum of understanding with RecycLiCo U.S. Mineral Recovery. This partnership will test hydrometallurgical refining methods that could be applied directly to Nikolai concentrates. If successful, this approach may allow semi-refined or refined nickel, copper, and cobalt to be produced on site in Alaska. Such a development would reduce reliance on foreign smelters, cut transportation emissions, and strengthen domestic battery supply chains.
Alongside, AEMC has also signed an MOU with Lucid Group, Inc (NASDAQ: LCID), maker of the world’s most advanced electric vehicles.
AEMC President & CEO Gregory Beischer commented on this development,
“By developing resilient automotive supply chains, we establish commercially viable mining operations that also help strengthen the American Defense Industrial Base. Sourcing minerals domestically enables better regulatory oversight, higher environmental standards, metal source traceability, and responsible sourcing. This approach mitigates harmful environmental and human rights risks often associated with foreign mining operations and provides an opportunity to improve the livelihoods of American communities.”
Strategic Importance for U.S. Supply Chains
The United States currently relies entirely on imported nickel, making it vulnerable to supply shocks, trade restrictions, and price volatility. In this context, Nikolai represents more than an economic opportunity—it carries strategic value.
A domestic nickel source could support:
EV battery manufacturing
Grid-scale energy storage
Defense and aerospace applications
Long-term clean energy deployment
As electrification expands and renewable energy integration accelerates, reliable access to nickel will become increasingly critical. Domestic production could help ensure that clean energy growth does not come at the cost of supply insecurity.
Permitting, Planning, and Federal Support
Nikolai’s inclusion on the U.S. FAST-41 Transparency Dashboard highlights its national significance. The program aims to improve coordination and transparency for major infrastructure and resource projects, potentially streamlining future permitting processes.
Meanwhile, AEMC continues to pursue U.S. government funding, noting recent federal support awarded to other critical minerals projects in Alaska. Public funding or strategic investment could help de-risk early development stages and accelerate timelines.
The company is also conducting an internal Options Study to assess potential mine development pathways and high-level economics. While results will not be published, the work will inform a formal Preliminary Economic Assessment planned for 2026.
Investment Takeaway
As Indonesia tightens supply and demand continues to grow, the nickel market is entering a new phase—one defined less by oversupply and more by security, jurisdiction, and processing control.
In this environment, Alaska Energy Metals’ Nikolai Project stands out as a long-duration strategic asset. Its scale, location, resource growth, and alignment with U.S. supply chain priorities position it well for long-term relevance.
For investors seeking exposure to nickel beyond Indonesia and China, Nikolai offers a differentiated opportunity—one that combines commodity upside with geopolitical and strategic optionality.
New Era Publishing Inc. and/or CarbonCredits.com (“We” or “Us”) are not securities dealers or brokers, investment advisers, or financial advisers, and you should not rely on the information herein as investment advice. Alaska Energy Metals. (“Company”) made a one-time payment of $75,000 to provide marketing services for a term of three months. None of the owners, members, directors, or employees of New Era Publishing Inc. and/or CarbonCredits.com currently hold, or have any beneficial ownership in, any shares, stocks, or options of the companies mentioned.
This article is informational only and is solely for use by prospective investors in determining whether to seek additional information. It does not constitute an offer to sell or a solicitation of an offer to buy any securities. Examples that we provide of share price increases pertaining to a particular issuer from one referenced date to another represent arbitrarily chosen time periods and are no indication whatsoever of future stock prices for that issuer and are of no predictive value.
Our stock profiles are intended to highlight certain companies for your further investigation; they are not stock recommendations or an offer or sale of the referenced securities. The securities issued by the companies we profile should be considered high-risk; if you do invest despite these warnings, you may lose your entire investment. Please do your own research before investing, including reviewing the companies’ SEDAR+ and SEC filings, press releases, and risk disclosures.
It is our policy that information contained in this profile was provided by the company, extracted from SEDAR+ and SEC filings, company websites, and other publicly available sources. We believe the sources and information are accurate and reliable but we cannot guarantee them.
CAUTIONARY STATEMENT AND FORWARD-LOOKING INFORMATION
Certain statements contained in this news release may constitute “forward-looking information” within the meaning of applicable securities laws. Forward-looking information generally can be identified by words such as “anticipate,” “expect,” “estimate,” “forecast,” “plan,” and similar expressions suggesting future outcomes or events. Forward-looking information is based on current expectations of management; however, it is subject to known and unknown risks, uncertainties, and other factors that may cause actual results to differ materially from those anticipated.
These factors include, without limitation, statements relating to the Company’s exploration and development plans, the potential of its mineral projects, financing activities, regulatory approvals, market conditions, and future objectives. Forward-looking information involves numerous risks and uncertainties and actual results might differ materially from results suggested in any forward-looking information. These risks and uncertainties include, among other things, market volatility, the state of financial markets for the Company’s securities, fluctuations in commodity prices, operational challenges, and changes in business plans.
Forward-looking information is based on several key expectations and assumptions, including, without limitation, that the Company will continue with its stated business objectives and will be able to raise additional capital as required. Although management of the Company has attempted to identify important factors that could cause actual results to differ materially, there may be other factors that cause results not to be as anticipated, estimated, or intended.
There can be no assurance that such forward-looking information will prove to be accurate, as actual results and future events could differ materially. Accordingly, readers should not place undue reliance on forward-looking information. Additional information about risks and uncertainties is contained in the Company’s management’s discussion and analysis and annual information form for the year ended December 31, 2025, copies of which are available on SEDAR+ at www.sedarplus.ca.
The forward-looking information contained herein is expressly qualified in its entirety by this cautionary statement. Forward-looking information reflects management’s current beliefs and is based on information currently available to the Company. The forward-looking information is made as of the date of this news release, and the Company assumes no obligation to update or revise such information to reflect new events or circumstances except as may be required by applicable law.
Disseminated on behalf of Surge Battery Metals Inc.
lithium Price Analysis Today
Global lithium markets advanced 3.78%, lifting global benchmarks to $22.1/kg and Chinese spot prices to ¥152,499/Ton. This bullish momentum is primarily driven by China's abrupt phase-out of VAT export rebates on battery products, triggering immediate supply chain realignments. Furthermore, surging demand for AI data center energy storage systems and tightening supply constraints—exacerbated by Zimbabwe’s raw lithium export ban—are compounding fears of a structural market deficit. Consequently, non-Chinese producers are securing a distinct competitive advantage.
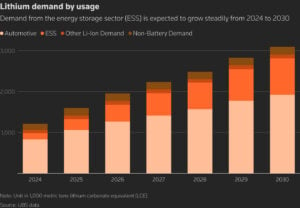
Electric vehicles (EVs) are central to the global shift away from fossil fuels. EV sales continue to rise each year. Analysts estimate that global lithium demand may grow to over 2.8 million tonnes of lithium carbonate equivalent (LCE) by 2030 as EVs and grid storage expand.
Battery energy storage systems (BESS) are another major source of demand. Shipments of stationary storage batteries are forecast to grow around 50% in 2025, driven by renewable energy and grid needs.
Growth in both EVs and energy storage is pushing demand for lithium and other battery minerals higher. Many forecasts suggest lithium demand could more than triple by 2030 versus today’s levels.
Source: Surge Battery Metals
These trends are visible in price movements. Lithium prices have risen sharply in recent years. They might hit high levels if demand keeps exceeding supply growth.
Despite some volatility in the market, long-term demand remains robust because EVs and BESS use large amounts of lithium per unit. Cell chemistries like lithium-iron-phosphate (LFP) are expanding, further increasing lithium use across applications.
Tight Supply, Rising Risk: The Global Lithium Bottleneck
Global lithium supply is strained by rapid growth in demand. Supply forecasts have shifted from a modest surplus in 2024 to potential deficits as early as the mid-2020s.
BESS is a key factor. It could account for 30–36% of total lithium demand by 2030, according to major banking forecasts.
At the same time, much of the world’s lithium refining and battery production capacity remains concentrated outside the U.S., especially in China. This concentration raises supply chain risks for North American manufacturers and automakers.
Domestic supply development has not kept pace with demand. Historically, the U.S. produced only a small fraction of the total lithium supply, even though it sits on large known lithium resources.
These factors have pushed companies and governments to speed up new projects and improve local production skills.
Federal Strategy: Building a Domestic Supply Chain
The U.S. government has passed several policies to strengthen the EV supply chain and domestic critical minerals base. Key federal actions include incentives, regulations, and strategic planning. These efforts involve several agencies, like the Department of Energy (DOE) and the Department of Defense (DoD).
Programs like the Inflation Reduction Act (IRA) provide tax incentives for EV manufacturing and battery production. These incentives emphasize sourcing from the U.S. and allied countries to reduce reliance on foreign supply chains. The DOE also funds energy storage research, materials processing, and efforts to scale domestic industrial capacity.
TheFY26 National Defense Authorization Act (NDAA) includes provisions that support critical materials production and supply chain resilience in the defense sector. It broadens the Defense Industrial Base Fund’s authority. Now, it includes support for domestic production and modernization projects, including batteries and related infrastructure.
The law sets rules on buying certain key minerals and advanced batteries from non-allied foreign sources. Over a phased timeline, DoD must avoid sourcing these materials from “foreign entities of concern,” such as those linked to China and other designated countries. They must expedite the qualification of compliant domestic and allied suppliers.
The NDAA also requires the Department of Defense to assess weaknesses in key material supply chains. It promotes programs for stockpiling, recycling, and reuse to reduce reliance on imports. These federal actions support U.S. projects that provide lithium, nickel, and other battery materials. They boost confidence for investors and the industry in the domestic supply chain.
Inside the Battery Metals Economy
Lithium’s role in the EV supply chain is clear: it is a core input for lithium-ion batteries. Long-term demand forecasts for lithium reflect this central position. Some market forecasts project global lithium demand to rise to 3–4 million tonnes LCE by 2030, depending on EV market growth assumptions.
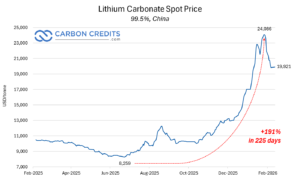
Price forecasts vary but generally reflect tightening supply. Some analysts estimate lithium prices could continue to rise if supply fails to match demand growth. Lithium carbonate spot prices recently jumped to $24,086, a 191%+ increase from July 2025.
Nickel and cobalt remain important for certain battery chemistries, even as some EV makers move toward low-cobalt or cobalt-free chemistries. All these metals are part of the broader battery metals ecosystem that underpins the EV supply chain.
Beyond EVs, electric grid storage, industrial batteries, and portable electronics all contribute to long-term demand. Even conservative estimates show sustained growth in battery-grade materials over the coming decade.
Nevada’s Lithium Anchor: NILI and Its Role in the U.S. Supply Chain
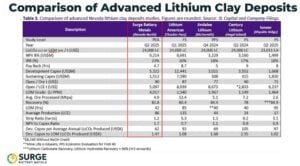
Surge Battery Metals (TSX-V: NILI; OTCQX: NILIF; FRA: DJ5) stands out as a lithium exploration and development company focused on the Nevada North Lithium Project (NNLP).
NNLP hosts one of the highest-grade lithium clay resources in the United States. Its inferred resource of approximately 11.2 million tonnes of LCE at an average grade above 3,000 ppm positions it well above many domestic peers.
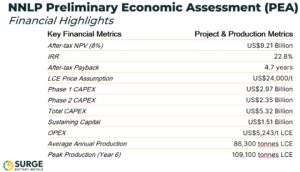
This high quality makes the resource attractive for future development. A Preliminary Economic Assessment (PEA) indicates strong economics. It shows a net present value of about US$9.2 billion and an internal rate of return of over 22%. This reflects the project’s strong potential.
The project’s operating cost metrics are also competitive, with estimated costs significantly lower than those of many North American rivals.
NNLP’s shallow geology and proximity to infrastructure help keep capital and processing costs down. The project sits near power lines, highways, and existing mining hubs in Nevada.
Recent drilling programs continue to show promising results. In 2025, the focus was on infill drilling and core sampling. These efforts aim to upgrade resources and prepare for prefeasibility work. Results show thick lithium clay layers, which boost confidence in the project’s size and consistency.
More recently, Surge reported additional strong drill results from Nevada North. The company announced a 31-meter intercept grading 4,196 ppm lithium from surface in a 640-meter step-out hole to the southeast. This step-out extends mineralization about 640 meters beyond the current resource footprint, confirming the strong continuity of high-grade lithium.
The intercept grade is well above the project’s current average resource grade of about 3,000 ppm lithium. Near-surface mineralization also reduces stripping requirements and supports efficient future development. These results strengthen the project’s scale and reinforce its role as a growing domestic lithium source.
Source: Surge Battery Metals
Surge has also secured strategic partnerships. A joint venture with Evolution Mining will speed up exploration and development. This partnership will increase land holdings by over 21,000 acres of promising land.
The company has been recognized for performance in the market, including being named a Top 50 performer on the TSX Venture Exchange in 2024.
Surge Battery Metals plans to improve metallurgical testing for lithium chemicals with over 99% purity. This will help supply battery makers and energy storage companies with high-quality products.
Its management team brings both industry and policy experience, including executives with track records in lithium development and the energy sectors.
Live Nickel Spot Price
Unit: USD/kg
---
---
Loading Chart...
The New Energy Reality: Demand, Security, and Strategic Supply
Surge Battery Metals’ project aligns well with broader U.S. efforts to strengthen domestic supply chains for critical battery metals. With rising demand for lithium, NNLP provides a high-quality, near-surface resource. This could greatly benefit the EV and energy storage battery markets.
Domestic projects, such as NNLP, reduce reliance on imports. They can also gain from federal incentives that promote U.S.-based production and processing. This strategic fit makes the project more relevant to policymakers, investors, and supply chain planners.
For policymakers, projects such as NNLP help diversify sources of critical minerals and build resilience against global market disruptions. For investors, strong project economics and top-quality resources offer a way to create value as market demand increases.
The U.S. EV supply chain race centers on securing reliable sources of battery metals. Lithium remains at the heart of this transition, driven by both EV and energy storage demand. Strong long-term demand forecasts and tighter supply show the need for new domestic sources.
The federal strategy backs this shift with policy incentives, funding, and programs. These focus on resilient, locally sourced materials. This environment favors projects that are high quality, well-positioned, and strategically relevant.
Surge Battery Metals and its Nevada North Lithium Project represent one such opportunity within the U.S. critical minerals strategy. NILI has solid resources, low costs, and important partnerships. This enables the company to strengthen the U.S. supply chain for lithium and other battery metals. This alignment shows how market forces and policy priorities shape the future of EVs, energy storage, and clean energy infrastructure.
New Era Publishing Inc. and/or CarbonCredits.com (“We” or “Us”) are not securities dealers or brokers, investment advisers, or financial advisers, and you should not rely on the information herein as investment advice. Surge Battery Metals Inc. (“Company”) made a one-time payment of $75,000 to provide marketing services for a term of three months. None of the owners, members, directors, or employees of New Era Publishing Inc. and/or CarbonCredits.com currently hold, or have any beneficial ownership in, any shares, stocks, or options of the companies mentioned.
This article is informational only and is solely for use by prospective investors in determining whether to seek additional information. It does not constitute an offer to sell or a solicitation of an offer to buy any securities. Examples that we provide of share price increases pertaining to a particular issuer from one referenced date to another represent arbitrarily chosen time periods and are no indication whatsoever of future stock prices for that issuer and are of no predictive value.
Our stock profiles are intended to highlight certain companies for your further investigation; they are not stock recommendations or an offer or sale of the referenced securities. The securities issued by the companies we profile should be considered high-risk; if you do invest despite these warnings, you may lose your entire investment. Please do your own research before investing, including reviewing the companies’ SEDAR+ and SEC filings, press releases, and risk disclosures.
It is our policy that the information contained in this profile was provided by the company, extracted from SEDAR+ and SEC filings, company websites, and other publicly available sources. We believe the sources and information are accurate and reliable, but we cannot guarantee them.
CAUTIONARY STATEMENT AND FORWARD-LOOKING INFORMATION
Certain statements contained in this news release may constitute “forward-looking information” within the meaning of applicable securities laws. Forward-looking information generally can be identified by words such as “anticipate,” “expect,” “estimate,” “forecast,” “plan,” and similar expressions suggesting future outcomes or events. Forward-looking information is based on current expectations of management; however, it is subject to known and unknown risks, uncertainties, and other factors that may cause actual results to differ materially from those anticipated.
These factors include, without limitation, statements relating to the Company’s exploration and development plans, the potential of its mineral projects, financing activities, regulatory approvals, market conditions, and future objectives. Forward-looking information involves numerous risks and uncertainties and actual results might differ materially from results suggested in any forward-looking information. These risks and uncertainties include, among other things, market volatility, the state of financial markets for the Company’s securities, fluctuations in commodity prices, operational challenges, and changes in business plans.
Forward-looking information is based on several key expectations and assumptions, including, without limitation, that the Company will continue with its stated business objectives and will be able to raise additional capital as required. Although management of the Company has attempted to identify important factors that could cause actual results to differ materially, there may be other factors that cause results not to be as anticipated, estimated, or intended.
There can be no assurance that such forward-looking information will prove to be accurate, as actual results and future events could differ materially. Accordingly, readers should not place undue reliance on forward-looking information. Additional information about risks and uncertainties is contained in the Company’s management’s discussion and analysis and annual information form for the year ended December 31, 2025, copies of which are available on SEDAR+ at www.sedarplus.ca.
The forward-looking information contained herein is expressly qualified in its entirety by this cautionary statement. Forward-looking information reflects management’s current beliefs and is based on information currently available to the Company. The forward-looking information is made as of the date of this news release, and the Company assumes no obligation to update or revise such information to reflect new events or circumstances except as may be required by applicable law.
Carboncredits.com receives compensation for this publication and has a business relationship with any company whose stock(s) is/are mentioned in this article.
Additional disclosure: This communication serves the sole purpose of adding value to the research process and is for information only. Please do your own due diligence. Every investment in securities mentioned in publications of carboncredits.com involves risks that could lead to a total loss of the invested capital.
Industrial heat production makes up a large share of global emissions. About 18% of all greenhouse gas emissions come from heat used in factories, plants, and manufacturing processes. This type of heat is hard to decarbonize because it often requires high temperatures that are still powered by fossil fuels like natural gas.
To tackle this challenge, AstraZeneca, together with Secaro and ERM, launched the Clean Heat Program. The initiative helps companies measure, plan, and reduce industrial heat emissions across their supply chains.
Rob Williams, Senior Director of Sustainable Procurement at AstraZeneca, said:
“It’s clear that a programme like this is the fastest and most effective way to decarbonise heat in our supply chain. We are long-term partners with Secaro and ERM, and now we’re expanding relationships with peers, buyers from other industries and suppliers to plan, fund and launch the projects that will make heat decarbonisation a reality.”
Industrial Heat: The Hidden Carbon Giant
Fossil fuels still supply most industrial heat energy today. Cleaner alternatives like electrification, hydrogen, or biofuels often cost more. They also require new technology and infrastructure.
Despite its importance, industrial heat has received less focus than clean electricity or transport. In many industries, heat drives fundamental operations, from making chemicals to processing food. Because of this, experts say improving how heat is produced is key to cutting industrial emissions.
Clean Heat Program: Turning Plans into Action
In March 2026, AstraZeneca teamed up with ERM and Secaro to launch the Clean Heat Program. This initiative aims to help companies reduce emissions tied to industrial heat across their supply chains.
By combining data tools, technical support, and financing options, the program aims to make it easier for industrial facilities to adopt low-carbon heat solutions and accelerate decarbonization.
AstraZeneca is joining as a founding partner. The company has its own near‑term climate goals. By 2026, it aims to cut 98% of its Scope 1 and 2 emissions from operations compared to a 2015 baseline.
Source: Astrazeneca
The pharma giant has already achieved 88.1% reduction by the end of 2025. Its long‑term target is to reach net zero by 2045, including deep cuts in emissions across its suppliers and partners.
The Clean Heat Program is designed to go beyond simple planning. It aims to help companies move from studying options to actually acting on decarbonizing heat.
The program combines:
Supply chain data tools that show where heat is used and emitted.
Technical support to find practical ways to reduce emissions.
Financing options to help companies afford projects that cut heat emissions.
Secaro maps heat emissions across supply chains while ERM designs bankable projects, heat pumps, biomass conversion, and electrification upgrades. Notably, financing leverages EU funds and carbon credit revenue to de-risk upfront costs, moving companies from analysis to implementation.
Unlike many efforts that focus on one plant or site, the program looks at supplier networks. This broader view helps companies pinpoint where changes will have the biggest impact.
Why High-Temperature Heat Is Hard to Replace
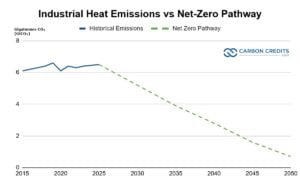
Industrial heat is one of the largest sources of industrial emissions. According to the International Energy Agency, around 70% of industrial energy demand goes to producing heat for processes such as steel, cement, and chemicals.
Estimates based on industrial CO₂ emissions data from the International Energy Agency. Around 70–75% of industrial energy use is for heat, according to IEA analysis.
Estimates from IEA data show that heat-related emissions are about 6.5 gigatonnes of CO₂ each year. This underscores the significant decarbonization needed.
The same analysis suggests that these emissions must drop to less than 1 gigatonne by 2050. This pathway needs quick action from various industries. It also requires strong investment in technology and changes in supply chains to cut emissions in high-temperature processes.
Industrial heat often uses natural gas or other fossil fuels. While electricity can now come from wind or solar, renewable options for high‑temperature heat are still emerging. Solutions such as electrification, biomass fuels, or hydrogen require new equipment and deep planning.
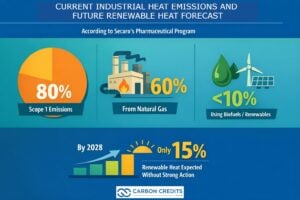
Electrification technologies work for low-temperature heat below 200°C. But industries that need higher heat still rely on fossil fuels. Secaro’s data show that 80% of industrial energy consumption is tied to heat, and 60% of these come from natural gas.
This complexity makes industrial heat one of the hardest parts of decarbonization — even for companies with net‑zero goals. In many cases, heat emissions make up a large share of a company’s direct emissions, known as Scope 1 emissions.
Currently, less than 10% of sites use biofuels or other renewable energy. Industry forecasts suggest that renewable heat may reach only 15% of industrial use by 2028 unless strong action is taken.
Pressure’s On: Regulators, Investors, and Rising Energy Costs
Pressure to cut heat emissions is growing from both regulators and investors. New rules such as the European Union’s Carbon Border Adjustment Mechanism (CBAM) and updated disclosure requirements from the U.S. Securities and Exchange Commission (SEC) require more detailed emissions reporting and climate risk disclosure.
Companies that ignore their emissions might face penalties. They could also lose contracts with buyers who want cleaner supply chains.
Energy price volatility also plays a role. Firms that rely on fossil fuels for heat may face wide swings in energy costs. Decarbonizing heat can help companies stabilize fuel expenses and reduce exposure to price shocks, which investors increasingly watch closely.
Tools and Support for Heat Decarbonization
Secaro’s data platform is central to the program. It now offers heat-specific insights, which show where emissions are highest and highlight chances for change. The platform links buyers, suppliers, and solution providers to highlight high‑impact decarbonization actions.
ERM steps in with its technical expertise. It helps companies assess options and build project plans to attract investment.
Adopting new technologies, like high-temperature heat pumps
Financing is also part of the program. Many industrial heat projects stall because of upfront costs. The initiative aims to connect companies with financing options, including funds based in the European Union and other mechanisms that help lower financial barriers.
Markets Are Warming Up: Forecasts for Industrial Decarbonization
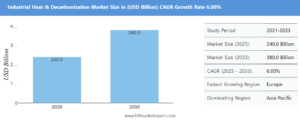
Efforts like the Clean Heat Program are significant as the market for industrial decarbonization is growing. A recent market outlook projects that global industrial heat decarbonization could grow steadily over the next decade.
From 2025 to 2033, the market is expected to expand at a compound annual growth rate (CAGR) of about 6%, reaching an estimated $380 billion by 2033.
Technologies such as industrial heat pumps are also gaining traction. These devices can reuse waste heat and reduce energy losses. A market forecast shows that the global industrial heat pump market will rise to over 13,150 units by 2035. Revenues may exceed $9.1 billion by that time.
Even though many low‑carbon heat solutions exist, adoption has been slow. For example, only a small share of industrial sites in some sectors currently use renewable heat sources. Without stronger action, forecasts suggest renewable heat may reach only around 15% of industrial heat use by 2028.
A Clear Path for Companies and Supply Chains
The Clean Heat Program offers companies a way to close the gap between their climate goals and the real challenges of industrial heat. It helps companies move beyond early analysis and toward real projects that reduce emissions, improve energy security, and meet investor and regulatory expectations.
For supply chain partners and smaller suppliers, the program can lower barriers to entry. Many small and mid‑tier suppliers struggle to access data, technical support, or financing. This initiative aims to change that by giving a clearer path to decarbonization. If widely adopted, this approach could help reduce significant emissions from industrial heat worldwide and support broader climate goals.
The artificial intelligence (AI) boom has entered a new phase. It is no longer just about innovation or market dominance. Instead, it is now deeply tied to energy demand, emissions, and capital discipline. As a result, the rapid expansion of AI infrastructure is pushing Big Tech into an uncomfortable position—balancing climate commitments with rising environmental costs.
Data compiled for CNBC by carbon management platform Ceezer shows a sharp rise in carbon credit purchases across the sector. Companies are scaling AI aggressively, yet at the same time, they are leaning more heavily on carbon markets to offset the emissions they cannot yet avoid.
This shift is not happening in isolation. It reflects a broader structural tension between growth, sustainability, and financial performance.
AI Expansion Is Driving Both Emissions and Offsets
Tech giants such as Alphabet, Microsoft, Meta, and Amazon are collectively expected to spend close to $700 billion this year to scale their AI capabilities. This includes building hyperscale data centers, deploying advanced chips, and expanding global cloud infrastructure.
However, these investments come with a high environmental cost. AI systems require vast computing power, which in turn demands continuous electricity and cooling. Water use is also rising, particularly in large data center clusters. Consequently, emissions are increasing even as companies reaffirm their net-zero ambitions.
This is where carbon credits play a growing role. Each credit represents one metric ton of carbon dioxide either reduced or removed from the atmosphere. By purchasing these credits, companies aim to offset emissions that remain difficult to eliminate in the short term.
Yet this approach raises a fundamental question. Are carbon credits acting as a bridge to decarbonization—or becoming a substitute for it?
A Market Surge Signals Structural Dependence
The scale of growth in carbon credit purchases suggests a structural shift rather than a temporary adjustment.
In 2022, permanent carbon removal purchases across these companies stood at just over 14,000 credits. Within a year, that figure jumped dramatically to 11.92 million. The momentum did not slow. Purchases increased to 24.4 million in 2024 and then surged to 68.4 million in 2025.
This exponential rise highlights how quickly AI-driven emissions are feeding into carbon markets. More importantly, it shows that demand for high-quality removal credits is accelerating faster than supply.
At the same time, companies are not relying on a single solution. Their portfolios include nature-based projects such as forestry and soil carbon, alongside engineered approaches like direct air capture. Long-term offtake agreements are also becoming more common, helping secure future credit supply while supporting project development.
However, the rapid increase in demand raises concerns about market depth. High-integrity carbon removal credits remain scarce, and scaling them is both capital-intensive and time-consuming.
Microsoft Sets the Pace—but Questions Remain
Among its peers, Microsoft has taken a clear lead in carbon removal efforts. The company reported a 247% increase in credit purchases between fiscal 2022 and 2023, followed by a further 337% jump in 2024. Growth continued into the next fiscal year, roughly doubling again.
More notably, Microsoft expanded its carbon removal agreements to 45 million metric tons of CO₂ in 2025, up from 22 million tons the previous year. These agreements span multiple geographies and technologies, reflecting a diversified approach to carbon removal.
The company is now a top climate leader, intending to become carbon-negative by 2030. Its strategy emphasizes reducing emissions first and then removing what cannot be avoided.
However, a key gap remains. It has not explicitly tied its carbon credit strategy to its AI expansion. While the correlation is clear, the lack of direct disclosure leaves room for interpretation.
This ambiguity is not unique to Microsoft. It reflects a broader issue across the sector, where sustainability narratives are evolving faster than reporting frameworks.
Free Cash Flow Pressures Are Becoming Harder to Ignore
While environmental concerns are rising, financial pressures are also building.
The CNBC report further highlighted that the scale of AI investment is unprecedented. As companies ramp up spending, free cash flow is beginning to decline. The four largest U.S. tech firms generated a combined $237 billion in free cash flow in 2024. That figure dropped to $200 billion in 2025, and further declines are expected.
This trend signals a shift in capital allocation. Companies are prioritizing long-term growth over short-term financial efficiency. However, this comes at a cost. Lower cash generation reduces flexibility and may increase reliance on external financing.
For instance, Alphabet raised $25 billion through a bond sale in late 2025, while its long-term debt rose sharply to $46.5 billion. This move underscores how even cash-rich companies are turning to debt markets to sustain their AI ambitions.
For investors, the implications are significant. The AI story remains compelling, but it now comes with margin pressure, delayed returns, and increased financial risk.
Despite the rise in emissions, the increase has not been as steep as some feared. This is largely due to the rapid adoption of renewable energy.
Hyperscalers have expanded their clean energy portfolios, securing power purchase agreements and investing in renewable projects. As a result, they have been able to offset part of the additional demand created by AI workloads.
Ceezer’s data suggest that while emissions rose alongside AI growth, the increase was relatively moderate. This indicates that companies are responding quickly by integrating renewable energy into their operations.
However, this strategy has limits. Renewable energy can reduce operational emissions, but it cannot fully eliminate the impact of rapid infrastructure expansion. As AI demand continues to grow, the gap between emissions and reductions may widen.
Stricter Rules Are Reshaping Carbon Credit Use
At the same time, the regulatory landscape for carbon credits is becoming more stringent. New frameworks are redefining how companies can use offsets within their climate strategies.
Initiatives such as the VCMI Scope 3 Action Code now allow limited use of high-quality credits, but only under strict disclosure conditions. Meanwhile, the Science Based Targets initiative (SBTi) continues to refine its guidance, particularly as Scope 3 emissions remain difficult to reduce.
The challenge is substantial. The global Scope 3 emissions gap is estimated at 1.4 billion tonnes and could increase significantly by 2030. This creates pressure on companies to find credible solutions without over-relying on offsets.
In parallel, disclosure frameworks such as CSRD are pushing companies to provide detailed explanations of their carbon credit strategies. This includes justifying project selection, verifying credit quality, and demonstrating measurable impact.
The direction is clear. Carbon credits are no longer a simple compliance tool. They are becoming part of a broader accountability framework.
The carbon removal market is growing rapidly, yet it remains constrained.
MSCI Projections suggest the global carbon credit market could exceed $30 billion by 2030. Corporate demand for carbon removal credits may surpass 150 million metric tons annually within the same timeframe.
However, supply is struggling to keep pace. High costs remain a major barrier, particularly for advanced technologies such as direct air capture, where prices often exceed $100 per ton.
In 2025, offtake agreements reached $13.7 billion, reflecting a strong corporate commitment. Yet these agreements will deliver only 78 million credits over the next decade. Actual durable carbon removal credits retired in the same year remained below 200,000.
This mismatch highlights a key issue. While demand is accelerating, real-world deployment is lagging. As a result, the market faces both growth potential and structural limitations.
Source: Sylvera
The Bottom Line: A Delicate Balancing Act
Big Tech’s AI expansion is reshaping both the digital economy and the carbon market. On one side, companies are investing heavily in future growth. On the other hand, they are navigating rising emissions, tighter regulations, and increasing financial pressure.
Carbon credits are playing a critical role in bridging this gap. However, they are not a long-term solution on their own.
The path forward will require a more balanced approach—one that combines technological innovation with real emissions reductions and transparent reporting. Companies must prove that their climate commitments are more than offset strategies.
At the same time, investors will need to adjust expectations. The AI boom promises strong returns, but it also introduces new risks. Lower cash flow, higher capital intensity, and evolving climate obligations are all part of the equation.
Ultimately, the success of this transition will depend on execution. The companies leading the AI race must now show they can scale responsibly—without compromising either financial stability or climate credibility.
India’s clean energy transition is entering a new phase. Reliance Industries Limited (RIL) has signed a long-term green ammonia supply agreement with Samsung C&T Corporation. The deal, worth over $3 billion, will run for 15 years starting in the second half of FY2029.
This agreement reflects a structural shift in global energy markets. India is positioning itself not just as a clean energy producer, but as a future exporter of green fuels.
At the same time, the deal highlights a growing global race to secure long-term supplies of low-carbon energy. As industries look to decarbonize, green hydrogen and ammonia are becoming critical building blocks of the future energy system.
India’s Hydrogen Vision Meets Global Demand Reality
The agreement aligns with India’s broader policy push. Led by the Ministry of New and Renewable Energy, the National Green Hydrogen Mission aims to turn the country into a global hub for hydrogen production and exports.
The government has proposed around $2.2 billion in funding through 2030. Its targets are ambitious. India plans to build at least 5 million metric tonnes of annual green hydrogen capacity, supported by 125 GW of new renewable energy.
The economic and environmental impact could be substantial. Investments may exceed ₹8 lakh crore. The mission could create over 600,000 jobs while cutting fossil fuel imports by ₹1 lakh crore. In addition, it aims to reduce around 50 million tonnes of greenhouse gas emissions each year.
However, market realities remain complex. As of August 2025, about 158 hydrogen projects were under development. While announced capacity is already more than double the government’s target, only a small fraction is under construction or operational. This gap highlights execution risks.
Reliance Builds a Fully Integrated Green Energy Platform
To capture this opportunity, Reliance is building a deeply integrated clean energy ecosystem. The company is not only producing green hydrogen but also controlling the entire value chain.
This includes renewable power generation, energy storage, hydrogen production, and downstream products like green ammonia. A key focus is domestic manufacturing of critical technologies such as solar modules, battery systems, and electrolysers.
This strategy serves two purposes:
First, it reduces costs by localizing supply chains.
Second, it strengthens India’s position as a manufacturing hub for clean energy technologies.
At the center of this ecosystem is the Dhirubhai Ambani Green Energy Giga Complex in Jamnagar. Spread across 5,000 acres, it will house multiple gigafactories producing solar panels, batteries, electrolysers, fuel cells, and power electronics.
Source: Reliance
In parallel, Reliance is developing a large renewable energy project in Kutch. By combining solar, wind, and storage, the project will provide round-the-clock clean electricity. This power will feed into hydrogen and ammonia production facilities in Jamnagar.
The company has also committed to achieving net-zero emissions by 2035, placing it among the more aggressive corporate climate targets globally.
Samsung’s Offtake Deal Brings Stability to the Green Hydrogen Market
The partnership with Samsung C&T plays a crucial role in addressing one of the hydrogen sector’s biggest challenges—demand uncertainty.
By securing a 15-year offtake agreement, Reliance gains revenue visibility. This makes it easier to finance large-scale projects. At the same time, Samsung C&T Corporation benefits from a stable and cost-competitive supply of green ammonia.
The company operates across more than 40 countries and is active in trading industrial materials and developing renewable energy projects. Access to green ammonia strengthens its ability to decarbonize operations and expand its clean energy portfolio.
This is particularly important as global companies face rising pressure to meet environmental, social, and governance (ESG) targets. Green ammonia can be used in fertilizers, as a hydrogen carrier, and even as a shipping fuel. Therefore, securing supply early provides a strategic advantage.
From Slow Start to Rapid Scale: McKinsey and PwC Map Hydrogen Growth
Global demand trends add another layer to the story. According to McKinsey & Company, clean hydrogen demand could reach between 125 and 585 million tonnes per year by 2050. This is a sharp increase from today’s levels, where nearly 90 million tonnes of hydrogen are still produced using fossil fuels.
In the near term, demand growth is expected to remain gradual. McKinsey notes that traditional sectors like fertilizers and refining will drive early adoption as they switch from grey to cleaner hydrogen. However, newer applications—such as steelmaking, synthetic fuels, and heavy transport—will likely scale up after 2030, accelerating overall demand.
Source: McKinsey
While long-term demand looks strong, short-term growth is expected to be gradual. Insights from PwC suggest that hydrogen demand will remain limited until 2030.
There are several reasons for this. First, most current projects are still in early stages and operate at relatively small scales. Many electrolyser facilities today have capacities below 50 MW. Even planned projects, which may exceed 100 MW, are still small compared to existing fossil-based hydrogen plants.
Second, infrastructure development takes time. Building pipelines, storage systems, and export terminals can take seven to twelve years. Without this infrastructure, large-scale hydrogen trade cannot take off.
As a result, PwC expects stronger demand growth after 2030, with a more rapid acceleration after 2035. This timeline aligns with broader climate goals and the need to scale clean energy systems globally.
Source: PwC
Challenges Still Loom Over the Sector
Despite growing momentum, the green hydrogen sector faces several hurdles. High production costs remain a major barrier. In many regions, green hydrogen is still more expensive than fossil-based alternatives.
In addition, global standards are still evolving. Different countries use different definitions for “green” or “low-emission” hydrogen. This creates uncertainty and complicates international trade. Demand visibility is another concern. Although many projects have been announced, actual uptake depends on policy support, pricing mechanisms, and technological progress.
These challenges explain why only a small portion of announced capacity has moved into construction or operation so far.
In conclusion, the Reliance-Samsung deal highlights a key turning point. It shows how large-scale, long-term agreements can unlock investments and accelerate project development.
At the same time, it signals India’s growing role in the global hydrogen economy. With strong policy backing, rising investor interest, and integrated industrial strategies, the country is building a foundation for large-scale exports of green fuels.
To provide the best experiences, we use technologies like cookies to store and/or access device information. Consenting to these technologies will allow us to process data such as browsing behavior or unique IDs on this site. Not consenting or withdrawing consent, may adversely affect certain features and functions.
Functional
Always active
The technical storage or access is strictly necessary for the legitimate purpose of enabling the use of a specific service explicitly requested by the subscriber or user, or for the sole purpose of carrying out the transmission of a communication over an electronic communications network.
Preferences
The technical storage or access is necessary for the legitimate purpose of storing preferences that are not requested by the subscriber or user.
Statistics
The technical storage or access that is used exclusively for statistical purposes.The technical storage or access that is used exclusively for anonymous statistical purposes. Without a subpoena, voluntary compliance on the part of your Internet Service Provider, or additional records from a third party, information stored or retrieved for this purpose alone cannot usually be used to identify you.
Marketing
The technical storage or access is required to create user profiles to send advertising, or to track the user on a website or across several websites for similar marketing purposes.