$2 Trillion Debut Highlights the Growing Value of Climate Data")
Elon Musk’s SpaceX (SPCX) made history with its stock market debut. The company raised a record $75 billion in its initial public offering (IPO), the largest IPO ever. The offering valued SpaceX at $1.77 trillion. Within its first day of trading, its market value surged past $2 trillion, placing it among the world’s most valuable companies.
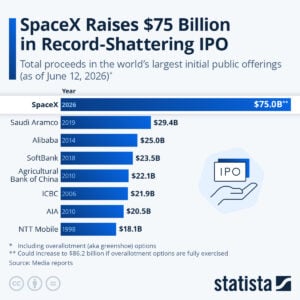
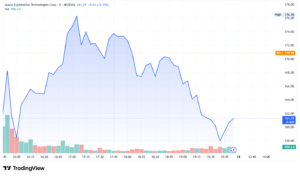
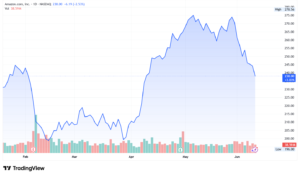
Most headlines focused on rockets, satellites, Elon Musk, and SpaceX stock, SPCX, highly speculating. SPCX stock moved sharply above its IPO price today: it opened at $150, hit an intraday high of $176.52, and closed at $160.95, which was up 19.2% from the $135 IPO price.
Behind all the financial hype, the IPO also highlights another trend. Investors are placing growing value on technologies that collect, process, and deliver data at a global scale.
That trend matters for the net-zero transition. As companies, investors, and governments work to cut emissions, demand for climate data is rising rapidly.
Carbon markets, emissions reporting, and climate risk management all depend on accurate information. Increasingly, satellite networks and artificial intelligence (AI) are helping provide that information.
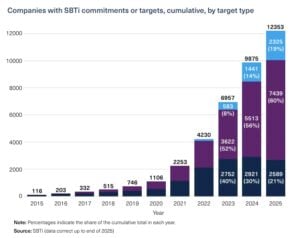
The demand for environmental data has grown sharply in recent years.
According to CDP, over 22,700 companies disclosed environmental data through its platform in 2024. Companies representing more than two-thirds of global market capitalization reported through the system.
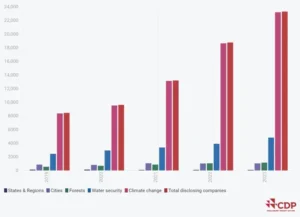
CDP also works with more than 700 financial institutions representing over $142 trillion in assets. This growth reflects a major shift in business.
Investors now use emissions data to assess climate risks. Regulators increasingly require climate disclosures. Companies use carbon data to identify risks, improve efficiency, and track progress toward climate goals. As a result, environmental information is becoming as important as many traditional business metrics.
The Space-Based Tools Powering Carbon Markets
Carbon credit markets depend on measurement. Whether a company reports emissions or a carbon project claims climate benefits, investors need reliable data to verify results. This is where satellite technology plays an important role.
The connection is simple. Organizations cannot manage what they cannot measure. They need reliable data.
SpaceX’s Starlink network was designed primarily to provide internet connectivity. However, the rapid growth of satellite infrastructure is also helping create the digital foundation needed for better environmental monitoring and climate data collection.
How AI Is Turning Climate Data Into Actionable Insights
Collecting environmental data is no longer the main challenge. The real value comes from turning that data into decisions that can be acted on quickly and with confidence. This is where artificial intelligence is playing a growing role.
AI systems can process vast volumes of satellite imagery in minutes, spotting patterns that would take humans far longer to detect. They are now used to identify deforestation, monitor land-use change, track methane leaks, and improve emissions measurement across industries.
In methane detection, a Stanford study shows AI-powered models can reach accuracy levels above 95% in some cases. This makes them highly effective for pinpointing emissions sources.
Beyond emissions tracking, AI-driven analytics platforms are also being deployed to monitor mining activity, ecosystem loss, and habitat disruption. This allows companies and regulators to move from delayed reporting to near real-time environmental awareness. This, in turn, strengthens carbon accounting and improves the reliability of climate reporting.
The broader trend is clear. Climate management is becoming faster, more automated, and increasingly predictive. As reporting standards tighten and investor expectations rise, organizations will depend more on AI and satellite intelligence to turn raw environmental data into clear, actionable insights.
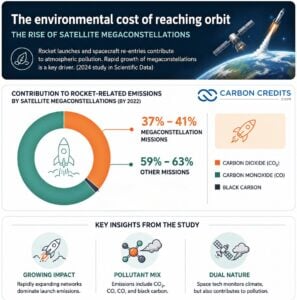
The Environmental Cost of Reaching Orbit: Carbon Emissions
While space technology can support climate monitoring, rocket launches also have environmental impacts. Researchers are paying increasing attention to emissions from launches and spacecraft re-entries.
A 2024 study published in Scientific Data found that the rapid growth of satellite megaconstellations is contributing to rising rocket-related carbon dioxide emissions and other atmospheric pollutants. By 2022, satellite megaconstellation missions accounted for 37% to 41% of rocket-related carbon dioxide, carbon monoxide, and black carbon emissions.
SpaceX is now the world’s most active launch provider. As a result, discussions about the environmental footprint of the space industry often focus on the company.
At the same time, SpaceX has helped popularize reusable rockets. Reusability reduces the need to manufacture entirely new launch vehicles for every mission. Many experts view this approach as an important step toward improving efficiency in the space sector.
However, emissions from rocket fuel remain a challenge for the broader industry. As launch activity continues to increase, balancing the benefits of satellite-based climate monitoring with the environmental impact of launches will become increasingly important.
Climate Intelligence Could Be the Next Growth Market
Climate data is becoming a strategic asset. Companies need it to comply with regulations. Investors need it to assess risk. Carbon markets need it to verify outcomes.
As these needs grow, demand for climate intelligence is likely to increase as well.
Climate intelligence combines environmental data, satellite monitoring, AI, and analytics to help organizations make better decisions. It supports carbon accounting, climate reporting, emissions reductions, and sustainability planning.
This trend is creating new opportunities across multiple industries.
While SpaceX is not a carbon credit company and has not publicly announced a company-wide net-zero target, its technologies are increasingly connected to the systems that support climate monitoring and environmental transparency.
Looking Beyond the IPO
SpaceX’s record-breaking debut is primarily a financial story. Yet, it also reflects a larger shift taking place across global markets.
The transition to a low-carbon economy requires more than emissions reductions. It also requires accurate data, strong digital infrastructure, and better monitoring systems. SpaceX’s satellites, communications networks, and launch capabilities are helping expand that infrastructure.
The road to net zero will be built on data. Increasingly, some of that data will come from space.


 Stock Slips as It Opens Carbon Credits to UK Firms and Secures $17.5B Loan for AI")

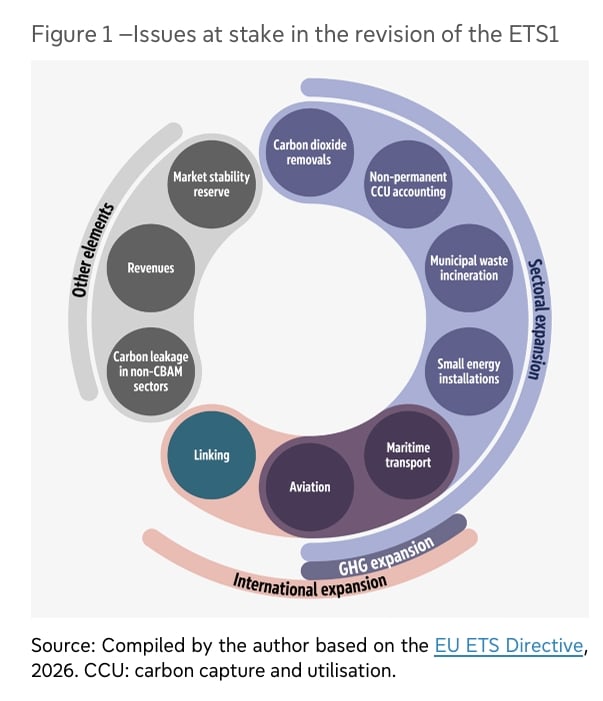
 Under Pressure Ahead of Landmark 2026 Review")
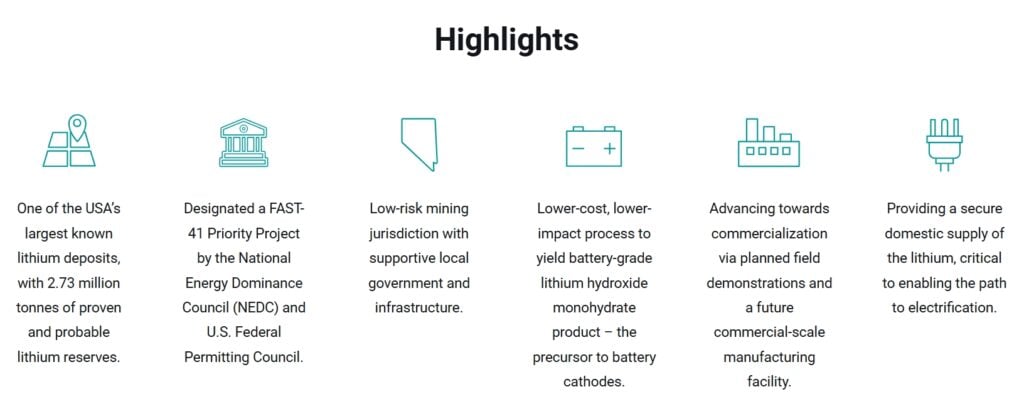
 Wins Back $115M DOE Grant as Tonopah Lithium Project Moves Forward")