Vistra Corp. (NYSE: VST) closed 2025 with strong operational and financial momentum. Headquartered in Irving, Texas, the Fortune 500 power producer operates one of the largest competitive electricity portfolios in the United States.
Last year, the company expanded its fleet, strengthened long-term partnerships, and delivered record operational performance. At the same time, it positioned itself to benefit from rising electricity demand driven by data centers, electrification, and AI growth.
It now owns and operates roughly 44,000 megawatts (MW) of generation capacity across natural gas, nuclear, coal, solar, and battery storage assets. That capacity can power about 22 million homes.
Financial Performance Shows Underlying Strength
For the year ended December 31, 2025, Vistra reported GAAP net income of $944 million. This figure included an $808 million unrealized pre-tax loss from commodity hedges expected to settle in future years.
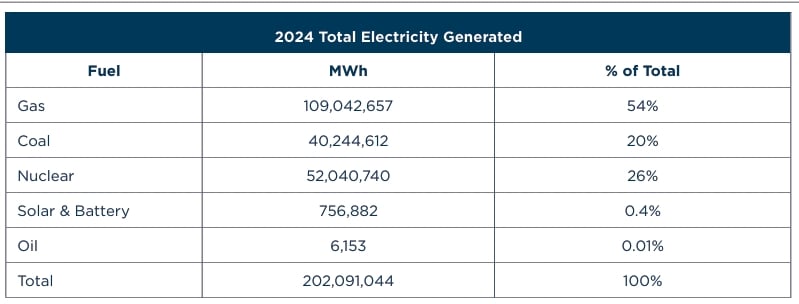
Source: Vistra
Although net income declined compared to 2024, the drop mainly reflected accounting impacts from rising forward power prices. Higher forward prices typically increase the long-term value of Vistra’s generation portfolio. As a result, the underlying business remains strong.
Ongoing Operations Adjusted EBITDA reached $5.9 billion, up $269 million year over year. Stronger retail margins and contributions from newly acquired assets supported the increase. Cash flow from operations totaled $4.07 billion, reinforcing liquidity and balance sheet strength.
2026 Expectations
For 2026, Vistra expects its adjusted EBITDA to range between $6.8 billion and $7.6 billion, while its adjusted free cash flow before growth is projected between $3.93 billion and $4.73 billion.
Importantly, these projections exclude potential impacts from the pending Cogentrix acquisition and recently signed nuclear agreements.
Meta and Amazon Anchor Vistra’s Nuclear Growth Strategy
The company operates the second-largest competitive nuclear fleet in the United States, providing steady, carbon-free baseload electricity that supports both grid reliability and corporate decarbonization goals.
In early 2026, the company signed 20-year power purchase agreements with Meta, covering more than 2,600 megawatts of nuclear energy across its PJM facilities. As Meta expands its AI capabilities and data center footprint, it needs dependable, around-the-clock power. These agreements secure long-term access to emissions-free electricity while giving Vistra predictable revenue streams.
Importantly, the structure of the contracts goes beyond traditional energy sales. They include capacity payments and plant uprates, allowing higher output from existing nuclear units. This approach improves asset efficiency for Vistra while ensuring price stability and supply certainty for Meta.
Vistra also strengthened its clean energy partnerships in Texas. Last year, it signed a separate 20-year agreement with Amazon Web Services for up to 1,200 megawatts of nuclear power from the Comanche Peak Nuclear Power Plant. The deal supports Amazon’s growing data operations with firm, carbon-free electricity and locks in long-term value for the company.
Together, these agreements reinforce the long-term viability of Vistra’s nuclear fleet. Long-term license renewals for the PJM units extend the life of critical zero-carbon infrastructure and strengthen grid reliability. At the same time, they position Vistra to meet rising corporate demand for clean, dependable power in the AI-driven economy.
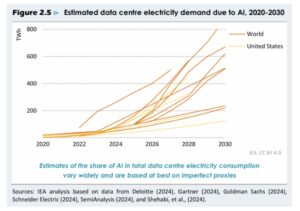
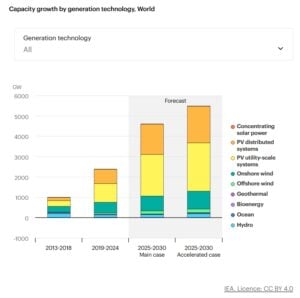
Source: IEA
Expanding Solar and Natural Gas
Vistra also commissioned the 200-MW Oak Hill Solar Facility on a reclaimed coal mine site. The project includes a PPA with AWS, expanding the clean energy collaboration.
In November 2025, it closed a 2,600-MW acquisition from Lotus Infrastructure Partners. Shortly after, it announced plans to acquire Cogentrix Energy, adding approximately 5,500 MW of gas-fired capacity. The transaction is expected to close in mid-to-late 2026.
Additionally, it has also begun construction on two new gas units totaling 860 MW at its Permian Basin plant, effectively tripling that site’s capacity. In addition, it executed uprates across its Texas gas fleet to increase efficiency and output.
These investments reflect a balanced approach. As renewable penetration increases, flexible gas generation helps stabilize the grid and manage peak demand.
Advancing Emissions Reduction Goals
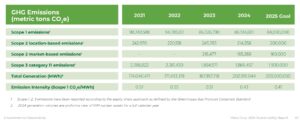
Vistra’s Scope 1 greenhouse gas emissions declined for the third consecutive year in 2024, primarily due to reduced coal generation. Scope 1 includes carbon dioxide, methane, and nitrous oxide, with carbon dioxide representing the largest share.
The company targets a 60% reduction in Scope 1 and 2 emissions by 2030 compared to 2010 levels. It also aims to achieve net-zero emissions by 2050.
Corporate sustainability efforts extend beyond generation. The company’s headquarters operates on 100% Green-e Wind renewable energy certificates. Nuclear-based emissions-free energy certificates also support fleet electricity usage. Together, these certificates covered more than 30% of corporate electricity consumption in 2024.
Source: Vistra
Positioned for Long-Term Value Creation
Vistra enters 2026 with strong momentum. Long-term nuclear PPAs with Meta and Amazon, expanded gas capacity, disciplined hedging, and growing renewable assets provide earnings visibility.
As electricity demand rises from AI, electrification, and digital infrastructure, companies with scale and reliability will benefit. Vistra’s integrated model of combining retail operations, nuclear baseload, flexible gas assets, and renewables positions it to capture that growth.
With projected EBITDA exceeding $7 billion in 2026 and potential upside from acquisitions, Vistra is not only adapting to the evolving energy market. It is actively shaping its future.
Spanish energy company Moeve approved more than €1 billion ($1.2 billion) for the first phase of its Andalusian Green Hydrogen Valley. The final investment decision cleared the way for construction to begin in the coming weeks. Significantly, Moeve will hold a 51% majority stake. The remaining share will be owned by Masdar and Enalter.
Enalter is majority controlled by Enagás Renovable, a pioneer in renewable gas development. Meanwhile, Masdar brings global clean energy expertise from Abu Dhabi.
This first phase, called Onuba, will install 300 megawatts (MW) of electrolyser capacity in southern Spain. Moreover, the company kept the option to expand the project by another 100 MW, subject to grid access and board approval.
Onuba: A Strategic Project With European Backing
The Onuba project will be the largest green hydrogen facility in southern Europe once operational. It carries a total investment of over €1 billion. That includes related infrastructure and a dedicated solar power plant for self-consumption.
Importantly, the project secured strong public support. The European Commission classified it as a Project of Common European Interest (PCI). In addition, the Spanish government awarded €304 million in funding under its Recovery, Transformation and Resilience Plan. This support came through the EU’s NextGenerationEU program under the Hydrogen Valleys scheme.
Such backing places the project at the center of Europe’s industrial decarbonization strategy. Brussels aims to reduce dependence on imported fossil fuels while scaling domestic clean energy production.
Ownership Mix Boosts Financing
This ownership mix reflects a wider shift in global capital. Gulf and European investors are increasingly channeling funds into hydrogen infrastructure. Notably, Moeve itself is owned by Mubadala, Abu Dhabi’s sovereign fund, and U.S. private equity firm Carlyle. As a result, the project benefits from deep financial backing and international reach.
Production Capacity and Climate Impact
At 300 MW, Onuba will produce about 45,000 tonnes of green hydrogen per year. This output will help avoid around 250,000 tonnes of CO₂ annually.
Simply put, the emissions reduction equals more than the total emissions generated by passenger vehicles with internal combustion engines in the Spanish cities of Huelva, Cádiz, and Jaén.
The hydrogen produced will serve multiple sectors. It will support aviation fuels, road transport, and marine fuels. In addition, it will help decarbonize chemical and fertilizer industries. Therefore, the project directly targets hard-to-abate sectors.
Solving the Grid Bottleneck
Grid access has slowed many hydrogen projects across Europe. However, Moeve recently secured a connection to the Spanish electricity grid. This approval came at a crucial time.
Besides grid power, the project will use a dedicated solar plant. This hybrid model will stabilize the electricity supply and improve the plant’s carbon intensity profile.
Access to renewable electricity remains essential. Green hydrogen only delivers climate benefits when powered by clean energy. Therefore, Andalusia’s strong solar resources give the region a clear advantage.
Furthermore, the region’s port infrastructure could support exports of hydrogen derivatives such as ammonia to northern European markets. This strengthens Spain’s ambition to become a renewable energy exporter.
Moeve’s Broader €8 Billion Transition Plan
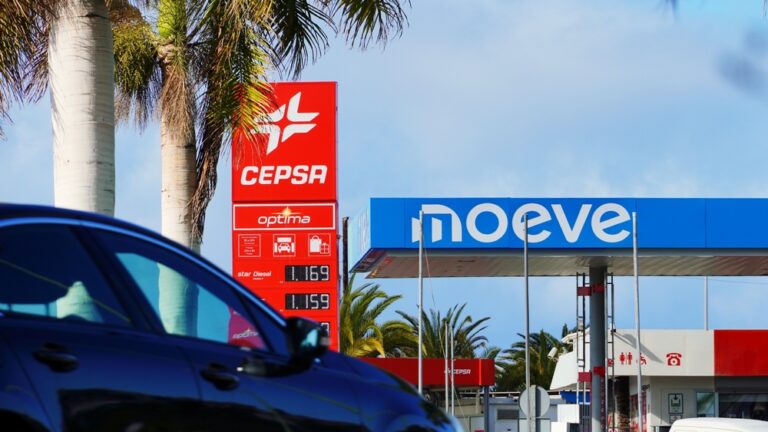
The hydrogen valley forms part of Moeve’s broader €8 billion transition strategy. Formerly known as Cepsa, the company rebranded in 2024 to signal its shift toward low-carbon businesses.
Since 2022, Moeve sold most of its oil production assets, including operations in Abu Dhabi and South America. It redirected that capital into renewables, biofuels, and hydrogen.
This capital reallocation marks a clear pivot. Instead of expanding oil production, the company invested in long-term clean infrastructure.
Financially, the company strengthened its position before making this move. Net profit rose to €341 million last year, compared to €92 million in 2024. This improved profitability provided internal funding capacity for large-scale energy transition projects.
At the same time, Moeve entered non-binding talks with Portuguese energy firm Galp. The companies are exploring a combination of refining, chemicals, and fuel retail businesses. They aim to complete due diligence and possibly reach an agreement by mid-2026.
If successful, consolidation could free up more capital. It could also stabilize legacy businesses during the transition period.
Low-carbon hydrogen plays a critical role in cutting emissions from industry and transport. The European Union set ambitious goals under its hydrogen strategy and REPowerEU plan. The bloc aims to produce 10 million tonnes of renewable hydrogen and import another 10 million tonnes by 2030.
However, the path remains complex.
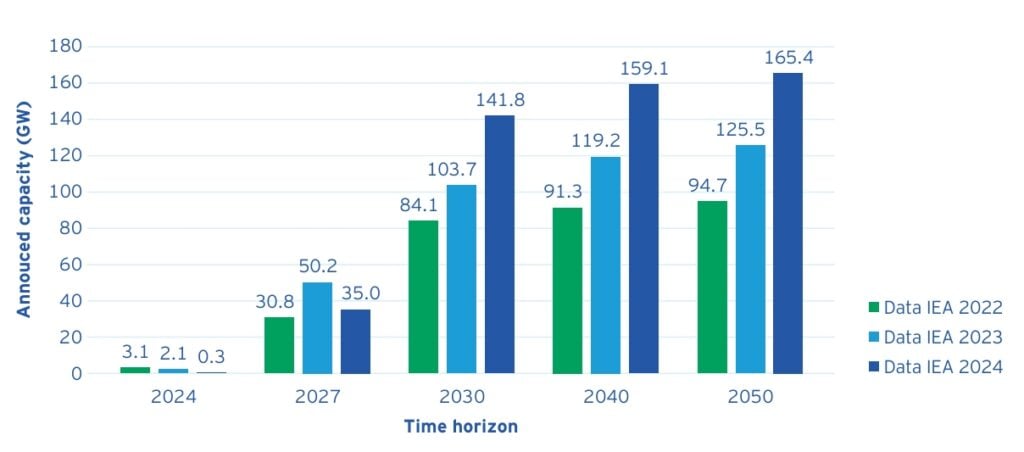
Analysts say that by 2030, Europe would need at least 100 gigawatts (GW) of installed electrolyser capacity to meet REPowerEU targets. That implies annual capacity growth of roughly 150% between 2025 and 2030. By comparison, growth between 2020 and 2024 averaged around 45%.
European renewable hydrogen production capacity announced
Source: EY
In addition, regulatory rules for renewable hydrogen, such as strict temporal and geographical correlation requirements, increase development costs. Projects often require extra storage and grid adjustments.
Funding remains another bottleneck. Although the EU structured many subsidies and incentives, approval processes can take 12 to 24 months. These delays risk slowing deployment.
As of December 2024, about 60% of Europe’s renewable hydrogen production ambition was covered by national targets. Member states must better align policies and accelerate ramp-up if the EU hopes to meet 2030 goals.
A Fast-Growing Market
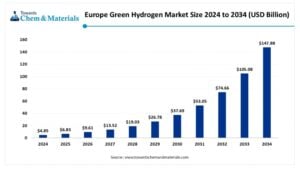
Despite challenges, market growth remains strong. The European green hydrogen market was valued at around $4.85 billion in 2024. Analysts expect it to reach nearly $147.88 billion by 2034. This implies a compound annual growth rate (CAGR) of about 40.7% between 2025 and 2034.
Several factors drive this expansion:
Rising demand for net-zero solutions
Decarbonization pressure on heavy industry
Expanding renewable energy capacity
Policy incentives and carbon pricing
By technology, alkaline electrolysers dominated the market in 2024, holding about 45% share. These systems remain cost-competitive and proven at scale.
Why This Project Matters
Moeve’s Andalusian Green Hydrogen Valley signals more than a single investment. It highlights three broader trends. First, capital is shifting from oil to clean infrastructure. Second, Europe is backing hydrogen with serious public funding. Third, Spain is emerging as a strategic clean energy exporter.
If executed successfully, Onuba could become a cornerstone of Europe’s hydrogen economy. More importantly, it shows that large-scale projects are moving from ambition to action. Thus, in a decade defined by energy transition, this €1 billion decision may mark a turning point for southern Europe’s clean industrial future.
Disseminated on behalf of Surge Battery Metals Inc.
Grade matters because it affects how much lithium a project can produce and how costly it is to operate. Higher grades generally mean more lithium can be recovered with lower costs. This matters for projects that want to compete in the fast‑growing electric vehicle (EV) and energy storage markets.
Let’s explore why grade is essential for lithium clay projects and learn how it affects economics, operations, and investor interest. More notably, we highlight how Surge Battery Metals’ Nevada North Lithium Project (NNLP) stands out in this context.
What “Grade” Means in Lithium Projects
In mining, “grade” refers to how much lithium is present in a deposit. It is usually reported in parts per million (ppm) or as lithium carbonate equivalent (LCE). A higher grade means there is more lithium per tonne of rock.
For lithium clay, grades can vary widely. Some clay deposits have grades below 1,000 ppm. Others reach several thousand ppm. The higher the grade, the more lithium metal is available to extract.
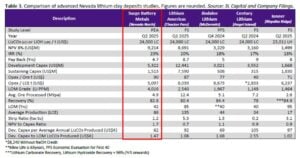
U.S. lithium clay peers usually range from 800 to 2,540 ppm Li. Some areas are lower, at 120 to 766 ppm, like American Lithium’s Tonopah claims. Others can reach 1,690 to 2,900 ppm in drilling. Common cutoffs start at 1,000–1,250 ppm for economic viability, far above the <500 ppm in some global clays like Australia’s Kaolin resources.
Grade affects several key project factors:
Revenue potential – Higher grade means more lithium output per tonne of material moved.
Cost efficiency – Projects with a higher grade may spend less on mining and processing per unit of lithium produced.
Product quality – Higher-grade feedstock can result in higher‑purity lithium products, which are valuable in battery markets.
Investors and developers pay close attention to grade because it is a strong indicator of future project performance.
The global lithium market is changing fast. EV production is growing quickly. Energy storage systems are expanding. Demand for lithium is outpacing supply in many markets. This puts pressure on producers and developers to find the most competitive resources.
In this environment, grade has become a key differentiator among lithium clay projects. Several market trends explain why grade now matters more than ever:
Rising Demand for Battery‑Grade Lithium
Battery manufacturers require consistent, high‑purity lithium feedstock. Higher-grade deposits can deliver more lithium for refining into battery materials. They can also reduce the amount of waste material that needs to be processed.
Global lithium demand is forecast to reach 2.4–3.1 Mt LCE by 2030 (from ~0.7 Mt in 2022), with batteries driving >90% growth. High-grade clays minimize waste in refining to meet this.
Cost Pressures in Battery Supply Chains
Global competition in battery manufacturing pushes producers to lower costs. Projects with higher grades can reduce lithium production costs. This improves project economics and makes supply chains more resilient.
Higher grades cut opex by reducing tonnage processed. For instance, >3,000 ppm clays enable <US$6,000/t LCE vs. lower-grade brine equivalents >US$10,000/t.
Shift Toward Domestic Supply Security
Countries like the United States are prioritizing domestic lithium production. This is part of a broader energy and industrial policy.
U.S. holds ~115 Mt lithium resources, per USGS 2025 data, up from 98 Mt in 2024. However, production is <1% global. IRA mandates 80% domestic or allied sourcing by 2027, favoring high-grade projects for faster permitting/offtakes.
Projects with strong grades are more likely to secure investment, permit approvals, and supply agreements. They offer clearer pathways to sustainable production.
In this landscape, projects with both good size and high grade stand out. They can produce more lithium with fewer inputs. They also attract stronger interest from investors and manufacturers looking for reliable sources of battery metals.
Nevada North: High-Grade Lithium in Action
Among lithium clay projects in the United States, Surge Battery Metals’ (TSX-V: NILI | OTCQX: NILIF) Nevada North Lithium Project (NNLP) is a standout example of why grade matters. NNLP hosts one of the highest‑grade lithium clay resources in the country. It also shows strong potential for expansion and future development.
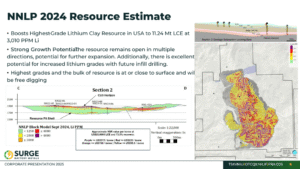
According to the 2024 resource estimate, NNLP now has an inferred resource of 11.24 million tonnes (Mt) of LCE at an average grade of 3,010 ppm lithium using a 1,250 ppm cutoff. This represents a significant increase in both size and quality compared to earlier estimates. It also positions NNLP as one of the highest‑grade lithium clay deposits in the United States.
Within that total resource, a core portion of 7.43 Mt of LCE grades 3,843 ppm lithium at a higher cutoff level. Higher cutoffs generally indicate more concentrated lithium zones, which are especially valuable for economic studies and future mine planning.
NNLP’s strong grades have grown progressively through drilling campaigns. In 2023, early drilling returned exceptionally high lithium values, including intervals that ranged up to 8,070 ppm lithium in specific clay horizons. These high grades were encountered close to the surface, which could simplify mining logistics.
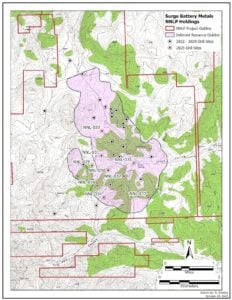
Surge recently reinforced this grade advantage with new drilling results at NNLP. The company reported a 31-meter intercept grading 4,196 ppm lithium from surface in a 640-meter step-out hole to the southeast. This intercept is nearly 40% higher than the project’s current average grade of 3,010 ppm lithium.
The 640-meter extension also confirms that high-grade mineralization continues well beyond the existing resource boundary. Near-surface grades above 4,000 ppm further support low stripping ratios and efficient future development.
Mr. Greg Reimer, CEO, President, and Director of Surge, said,
“These drill holes materially enhance the scale of the Nevada North Lithium Project. Intersecting nearly 4,200 ppm lithium in a 640‑meter step-out to the southeast in NNL‑037 is a significant achievement. Not only is the system continuous, but we are encountering some of our highest grades at the very edges of the known footprint. It is increasingly clear that we have only begun to tap the true potential size of this premier lithium asset.”
NNLP’s resource is also shallow and laterally extensive. The deposit extends over kilometers of strike and remains open for expansion in several directions. This suggests that further drilling could add more tonnes or improve the average grade even further.
These characteristics give NNLP a competitive advantage. High grades can translate into lower production costs per tonne of lithium. They can also support strong economic outcomes as the project progresses toward prefeasibility and eventual development.
Economics Speak for Itself
High lithium grades help improve the economic profile of a project. For developers like Surge Battery Metals, this means stronger project metrics in studies such as preliminary economic assessments (PEAs).
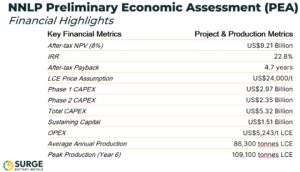
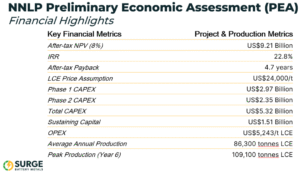
In the case of NNLP, the high-grade and large resource support robust economic results. A recent PEA shows an after‑tax net present value (NPV) of US$9.21 billion and an internal rate of return (IRR) of 22.8% at a lithium price of US$24,000 per tonne LCE. These figures reflect the project’s ability to generate strong cash flows over its lifespan.
High grade also means that a project can produce significant lithium volumes without requiring excessively large mining operations. This can reduce environmental footprint, capital cost, and permitting complexity. The Nevada North deposit’s grades help make future processing and extraction more efficient.
For investors, grade is a key signal of potential project strength. Projects with grades well above the global average often trade at premium valuations relative to peers with lower grades.
NNLP’s resource quality has attracted notable attention from analysts and market observers because it combines a strong grade with domestic location in a mining‑friendly jurisdiction.
The Strategic Edge in a Competitive Market
The lithium market will continue to evolve over the next decade. Global EV adoption and energy storage deployment are expected to drive demand for lithium to new highs. This will require reliable supply sources that can deliver consistent volume and quality.
In this context, grade will remain a core metric for comparing lithium clay projects. Deposits with higher grades are more likely to attract the capital, partnerships, and offtake agreements needed to advance through development phases. They also offer clearer economic paths compared to lower‑grade alternatives.
For Surge Battery Metals and its Nevada North Project, high grade is more than a number on a chart. It is a core advantage that differentiates NNLP from many peer projects. It supports strong resource economics, efficient processing potential, and a compelling narrative for domestic supply chain relevance in electric vehicle and battery markets.
As global competition for lithium intensifies, projects with both size and quality will stand out. NNLP’s high‑grade resource positions it as a leading example of how grade can influence outcomes in modern lithium clay development.
New Era Publishing Inc. and/or CarbonCredits.com (“We” or “Us”) are not securities dealers or brokers, investment advisers, or financial advisers, and you should not rely on the information herein as investment advice. Surge Battery Metals Inc. (“Company”) made a one-time payment of $75,000 to provide marketing services for a term of three months. None of the owners, members, directors, or employees of New Era Publishing Inc. and/or CarbonCredits.com currently hold, or have any beneficial ownership in, any shares, stocks, or options of the companies mentioned.
This article is informational only and is solely for use by prospective investors in determining whether to seek additional information. It does not constitute an offer to sell or a solicitation of an offer to buy any securities. Examples that we provide of share price increases pertaining to a particular issuer from one referenced date to another represent arbitrarily chosen time periods and are no indication whatsoever of future stock prices for that issuer and are of no predictive value.
Our stock profiles are intended to highlight certain companies for your further investigation; they are not stock recommendations or an offer or sale of the referenced securities. The securities issued by the companies we profile should be considered high-risk; if you do invest despite these warnings, you may lose your entire investment. Please do your own research before investing, including reviewing the companies’ SEDAR+ and SEC filings, press releases, and risk disclosures.
It is our policy that information contained in this profile was provided by the company, extracted from SEDAR+ and SEC filings, company websites, and other publicly available sources. We believe the sources and information are accurate and reliable but we cannot guarantee them.
CAUTIONARY STATEMENT AND FORWARD-LOOKING INFORMATION
Certain statements contained in this news release may constitute “forward-looking information” within the meaning of applicable securities laws. Forward-looking information generally can be identified by words such as “anticipate,” “expect,” “estimate,” “forecast,” “plan,” and similar expressions suggesting future outcomes or events. Forward-looking information is based on current expectations of management; however, it is subject to known and unknown risks, uncertainties, and other factors that may cause actual results to differ materially from those anticipated.
These factors include, without limitation, statements relating to the Company’s exploration and development plans, the potential of its mineral projects, financing activities, regulatory approvals, market conditions, and future objectives. Forward-looking information involves numerous risks and uncertainties and actual results might differ materially from results suggested in any forward-looking information. These risks and uncertainties include, among other things, market volatility, the state of financial markets for the Company’s securities, fluctuations in commodity prices, operational challenges, and changes in business plans.
Forward-looking information is based on several key expectations and assumptions, including, without limitation, that the Company will continue with its stated business objectives and will be able to raise additional capital as required. Although management of the Company has attempted to identify important factors that could cause actual results to differ materially, there may be other factors that cause results not to be as anticipated, estimated, or intended.
There can be no assurance that such forward-looking information will prove to be accurate, as actual results and future events could differ materially. Accordingly, readers should not place undue reliance on forward-looking information. Additional information about risks and uncertainties is contained in the Company’s management’s discussion and analysis and annual information form for the year ended December 31, 2025, copies of which are available on SEDAR+ at www.sedarplus.ca.
The forward-looking information contained herein is expressly qualified in its entirety by this cautionary statement. Forward-looking information reflects management’s current beliefs and is based on information currently available to the Company. The forward-looking information is made as of the date of this news release, and the Company assumes no obligation to update or revise such information to reflect new events or circumstances except as may be required by applicable law.
Carboncredits.com receives compensation for this publication and has a business relationship with any company whose stock(s) is/are mentioned in this article.
Additional disclosure: This communication serves the sole purpose of adding value to the research process and is for information only. Please do your own due diligence. Every investment in securities mentioned in publications of carboncredits.com involves risks that could lead to a total loss of the invested capital.
Disseminated on behalf of Surge Battery Metals Inc.
Surge Battery Metals (TSX-V: NILI | OTCQX: NILIF | FRA: DJ5C) delivered two strong updates from its Nevada North Lithium Project (NNLP) in February 2026. Together, these results confirm expansion potential, reinforce high-grade continuity, and advance technical work needed for the upcoming Pre-Feasibility Study (PFS).
On February 17, Surge reported a major step-out success. The company drilled a 31-meter intercept grading 4,196 ppm lithium from surface in a hole located 640 meters southeast of the existing resource boundary. This intercept sits well above the current resource average grade of 3,010 ppm lithium. The wide step-out confirms that high-grade mineralization extends significantly beyond the defined resource footprint.
Just one week later, on February 25, Surge released the final batch of results from its 2025 core drilling program. These infill holes focused on upgrading inferred resources to higher confidence categories and collecting technical data for the PFS. The results returned some of the strongest intercepts drilled to date.
Together, these two updates strengthen the project’s scale, quality, and development readiness.
Infill Drilling Confirms a Thick, High-Grade Core
The February 25 news highlighted Hole NNL-030 as a standout result. The hole intersected 116 meters, averaging 3,752 ppm lithium. Within that interval, a 32.1-meter zone graded 4,521 ppm lithium. These grades exceed the project’s current average and confirm the presence of a thick, ultra-high-grade core.
Hole NNL-032 also delivered strong results, returning 82.29 meters, averaging 3,664 ppm lithium. Hole NNL-036 intersected 78.63 meters, averaging 3,141 ppm lithium, including a deep 9.4-meter zone grading 4,580 ppm lithium.
Source: Surge Battery Metals
These intercepts show both lateral and vertical continuity. They show that high-grade lithium persists across wide widths and at depth. Importantly, most of these zones occur near the surface. Near-surface mineralization reduces stripping requirements and can improve early-year mine economics.
The infill drilling supports resource upgrading efforts. It helps convert Inferred resources into Indicated and Measured categories. Higher confidence categories are critical for mine planning, financing, and permitting.
The results confirm that Nevada North’s high-grade core is consistent, thick, and scalable.
Mr. Greg Reimer, President & Chief Executive Officer and Director of Surge, stated,
“This infill drilling is doing exactly what it was designed to do: upgrade the resource, confirm continuity of some of our best lithium intercepts, and de-risk the early years of a potential mine plan at Nevada North. Coupled with a robust PEA economic profile, we believe Nevada North is strongly positioned as we move forward with the development of our PFS. We look forward to updating the Mineral Resource Estimate as our next key milestone.”
Expansion Beyond the Current Resource Boundary
The February 17 step-out result adds a new dimension to the project story. The 31-meter intercept grading 4,196 ppm lithium occurred 640 meters beyond the existing resource area. This large extension demonstrates strong mineral continuity outside the current pit-constrained model.
Step-out drilling is important because it tests the limits of a deposit. A successful 640-meter extension suggests the deposit remains open and may support future resource growth.
Nevada North already hosts a pit-constrained Inferred Resource of 11.24 million tonnes of lithium carbonate equivalent (LCE) grading 3,010 ppm lithium at a 1,250 ppm cutoff. High-grade step-out intercepts increase confidence that future resource updates may expand both tonnage and overall contained lithium.
Highly anomalous soil values and geophysical surveys also suggest the clay horizons could extend even further. The mineralized zone currently spans more than 4,300 meters in strike length and over 1,500 meters in width. Continued drilling could increase the overall scale of the project.
This combination of strong infill and wide step-out success strengthens Nevada North’s long-term growth profile.
The 2025 drilling program did more than confirm grade. It also collected critical technical data required for the upcoming PFS and environmental permitting.
Hole NNL-035 was strategically positioned near Texas Spring to gather hydrogeological data. The hole successfully installed the Vibrating Wire Piezometers (VWPs) to monitor groundwater conditions. This data will help model basin hydrology and support environmental approvals.
The company also completed detailed geotechnical logging across all holes. High-resolution televiewer surveys mapped fault structures. Representative samples from each rock unit are now undergoing rock strength testing. These tests will help determine safe pit wall angles for future mine planning.
Remarkably, quality control procedures were rigorous. Of the 806 total samples analyzed, 134 were QA/QC samples. Certified reference standards, blanks, and duplicates were systematically inserted.
Standards are performed within acceptable limits. Duplicate samples fell within 10% tolerance. These results confirm strong analytical accuracy and reproducibility.
This technical work reduces development risk. This, in turn, ensures that the PFS is built on high-quality geological and engineering data.
Strategic Upside: By-Products and Strong Economics
In addition to lithium, the infill drilling consistently returned elevated cesium and rubidium values. Cesium reached up to 163 ppm and rubidium up to 349 ppm in association with the lithium core. Surge is evaluating the deportment of these elements in ongoing metallurgical studies.
If recoverable, these critical minerals could add value to the project economics. By-product potential can improve revenue streams and enhance overall project returns.
Nevada North already shows strong economic metrics from its Preliminary Economic Assessment. The PEA reports an after-tax NPV (8%) of approximately US$9.17 billion and an after-tax IRR of 22.8% at a lithium price of US$24,000 per tonne LCE. Operating costs are estimated at roughly US$5,243 per tonne LCE.
High grades play a central role in these economics. Thick intervals averaging 3,500–4,500 ppm lithium reduce the tonnage required to produce each unit of lithium. This supports lower operating costs and stronger early cash flow potential.
The joint venture with Evolution Mining also strengthens the project’s development pathway. Evolution is a globally recognized mining company with operational expertise. This partnership adds technical depth and financial strength to the Nevada North project.
A Strengthened Position in the U.S. Lithium Landscape
The United States is working to strengthen its domestic lithium supply chain. Federal incentives and policy measures emphasize secure, locally sourced battery materials. Projects that combine high grade, large scale, and technical readiness are well-positioned in this environment.
Nevada North now demonstrates three key strengths at once:
Proven high-grade core through infill drilling,
Expansion potential through 640-meter step-out success, and
Advancing technical data for PFS and permitting.
These updates reinforce Nevada North as one of the highest-grade lithium clay projects in the United States. They show both growth and de-risking in the same drilling campaign.
As global demand for lithium continues to rise, supply sources with strong grade, scale, and development momentum will stand out. Surge Battery Metals’ recent results highlight meaningful progress on all three fronts.
The company’s Nevada North Lithium Project is not only expanding. It is advancing toward higher confidence resources, improved technical definition, and future development milestones. These combined achievements strengthen Surge’s position within the evolving North American lithium supply chain.
New Era Publishing Inc. and/or CarbonCredits.com (“We” or “Us”) are not securities dealers or brokers, investment advisers, or financial advisers, and you should not rely on the information herein as investment advice. Surge Battery Metals Inc. (“Company”) made a one-time payment of $50,000 to provide marketing services for a term of two months. None of the owners, members, directors, or employees of New Era Publishing Inc. and/or CarbonCredits.com currently hold, or have any beneficial ownership in, any shares, stocks, or options of the companies mentioned.
This article is informational only and is solely for use by prospective investors in determining whether to seek additional information. It does not constitute an offer to sell or a solicitation of an offer to buy any securities. Examples that we provide of share price increases pertaining to a particular issuer from one referenced date to another represent arbitrarily chosen time periods and are no indication whatsoever of future stock prices for that issuer and are of no predictive value.
Our stock profiles are intended to highlight certain companies for your further investigation; they are not stock recommendations or an offer or sale of the referenced securities. The securities issued by the companies we profile should be considered high-risk; if you do invest despite these warnings, you may lose your entire investment. Please do your own research before investing, including reviewing the companies’ SEDAR+ and SEC filings, press releases, and risk disclosures.
It is our policy that information contained in this profile was provided by the company, extracted from SEDAR+ and SEC filings, company websites, and other publicly available sources. We believe the sources and information are accurate and reliable but we cannot guarantee them.
CAUTIONARY STATEMENT AND FORWARD-LOOKING INFORMATION
Certain statements contained in this news release may constitute “forward-looking information” within the meaning of applicable securities laws. Forward-looking information generally can be identified by words such as “anticipate,” “expect,” “estimate,” “forecast,” “plan,” and similar expressions suggesting future outcomes or events. Forward-looking information is based on current expectations of management; however, it is subject to known and unknown risks, uncertainties, and other factors that may cause actual results to differ materially from those anticipated.
These factors include, without limitation, statements relating to the Company’s exploration and development plans, the potential of its mineral projects, financing activities, regulatory approvals, market conditions, and future objectives. Forward-looking information involves numerous risks and uncertainties and actual results might differ materially from results suggested in any forward-looking information. These risks and uncertainties include, among other things, market volatility, the state of financial markets for the Company’s securities, fluctuations in commodity prices, operational challenges, and changes in business plans.
Forward-looking information is based on several key expectations and assumptions, including, without limitation, that the Company will continue with its stated business objectives and will be able to raise additional capital as required. Although management of the Company has attempted to identify important factors that could cause actual results to differ materially, there may be other factors that cause results not to be as anticipated, estimated, or intended.
There can be no assurance that such forward-looking information will prove to be accurate, as actual results and future events could differ materially. Accordingly, readers should not place undue reliance on forward-looking information. Additional information about risks and uncertainties is contained in the Company’s management’s discussion and analysis and annual information form for the year ended December 31, 2024, copies of which are available on SEDAR+ at www.sedarplus.ca.
The forward-looking information contained herein is expressly qualified in its entirety by this cautionary statement. Forward-looking information reflects management’s current beliefs and is based on information currently available to the Company. The forward-looking information is made as of the date of this news release, and the Company assumes no obligation to update or revise such information to reflect new events or circumstances except as may be required by applicable law.
Carboncredits.com receives compensation for this publication and has a business relationship with any company whose stock(s) is/are mentioned in this article.
Additional disclosure: This communication serves the sole purpose of adding value to the research process and is for information only. Please do your own due diligence. Every investment in securities mentioned in publications of carboncredits.com involves risks that could lead to a total loss of the invested capital.
Battery energy storage has entered a new era. Costs have fallen to historic lows, and deployments are accelerating across major markets. According to BloombergNEF’s (BNEF) Levelized Cost of Electricity 2026report, the economics of grid storage shifted dramatically in 2025 — even as other clean energy technologies became more expensive.
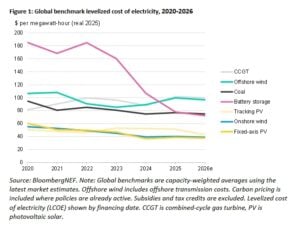
The global benchmark cost for a four-hour battery storage project dropped 27% year-on-year to $78 per megawatt-hour (MWh) in 2025.
That marks the lowest level since BNEF began tracking the data in 2009. As a result, batteries are now reshaping how power systems balance renewable energy and meet rising electricity demand.
At the same time, solar and wind projects faced cost pressures. Supply chain constraints, weaker resource quality in some regions, and policy reforms in mainland China pushed up benchmark costs. However, despite these short-term headwinds, BNEF expects long-term clean energy costs to continue declining through 2035.
Source: BNEF
Battery Storage Breaks Records While Solar and Wind Stall
In 2025, battery storage clearly stood out. The $78/MWh benchmark for a four-hour system reflected a steep and rapid decline. Lower battery pack prices, stronger competition among manufacturers, and better system design all helped drive the drop.
By contrast, solar and wind moved in the opposite direction. The global benchmark cost for a fixed-axis solar farm rose 6%, reaching $39/MWh. Onshore wind increased to $40/MWh. Offshore wind climbed sharply to $100/MWh due to tight supply chains and financing challenges.
Thermal power also became more expensive. The levelized cost of electricity (LCOE) for new combined cycle gas turbine (CCGT) plants jumped 16% to $102/MWh — the highest level recorded. Equipment price increases and strong demand for gas turbines, partly fueled by data center expansion, kept costs elevated. Coal plants also faced higher capital expenses.
Yet even with solar and wind costs rising in 2025, BNEF projects that innovation and scale will push prices down again over the next decade. By 2035, the firm expects:
Solar LCOE to fall 30%
Battery storage to decline 25%
Onshore wind to drop 23%
Offshore wind to decrease 20%
These projections suggest the current cost increases are temporary rather than structural.
China’s Cost Advantage
Wind energy told a more mixed story.
Mainland China retained a cost advantage. However, projects built in lower wind-speed regions pushed up the global benchmark. Onshore wind projects outside mainland China saw a 4% cost decline, but the global average rose 2% due to Chinese market dynamics.
Offshore wind faced deeper challenges. Supply chain bottlenecks increased turbine and installation costs across major markets. In the United Kingdom, recently financed offshore wind projects now cost 69% more than they did five years ago. BNEF expects offshore wind costs to remain elevated until at least 2030.
Still, in the United States, wind power regained its position as the cheapest source of new electricity generation in 2025. Rising gas turbine costs pushed wind ahead of gas for the first time since 2023.
EV Overcapacity Slashes Battery Prices
One major factor behind the storage cost collapse is manufacturing overcapacity in the electric vehicle (EV) sector.
China’s lithium-ion battery production capacity surpassed 2 terawatt-hours in 2024. That was about 60% higher than total battery demand. As a result, manufacturers competed aggressively on price, which benefited grid-scale storage buyers.
Battery pack prices for EVs fell 8% in 2025 to a record low of $108 per kilowatt-hour, according to BNEF’s December survey. Lower pack prices directly reduced the cost of large storage projects. Meanwhile, system-level improvements — including better integration and optimized engineering — improved performance and reduced overall project expenses.
According to Amar Vasdev, senior energy economics associate at BNEF and lead author of the report, manufacturing overcapacity and better system designs are transforming the economics of large energy storage projects. In six markets, the LCOE of a four-hour battery system has already dropped below $100/MWh.
That threshold is critical. At those levels, battery storage becomes highly competitive with fossil fuel peaking plants.
Lower Battery Costs Drive Renewables Plus Storage Boom Worldwide
Lower battery costs are accelerating hybrid renewable development. In 2025 alone, developers added 87 gigawatts of co-located solar and storage projects worldwide. These combined systems delivered electricity at an average cost of $57/MWh.
This model solves one of solar’s biggest challenges — intermittency. Batteries allow solar farms to store excess daytime generation and dispatch it later when demand peaks. As storage becomes cheaper, solar-plus-storage projects become more financially attractive and reliable.
BNEF expects annual global energy storage additions to reach 220 GW by 2035, growing at a compound annual rate of nearly 15%. If that projection holds, batteries will become central to grid balancing worldwide.
Source: IEA
The U.S. Storage Boom Accelerates
The United States is emerging as a key growth engine for battery deployment.
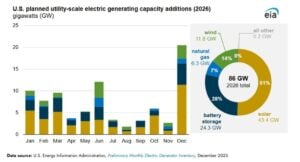
According to the February 2026 Electric Power Monthly report from the U.S. Energy Information Administration (EIA), 86 GW of new utility-scale capacity is expected to come online in 2026. Of that total, 26.3 GW will come from battery storage.
That represents the largest single-year capacity expansion in more than two decades. Solar and battery storage together account for nearly 79% of planned additions.
Texas has become a hotspot for battery development. As of July 2025, the state had 12.2 GW of storage capacity operating. Developers rushed projects online ahead of summer peak demand, including nearly 1 GWh brought online by esVolta across three projects.
California continues to lead nationally, with more than 12 GW of operational storage capacity. Projects such as the Rexford solar-plus-storage facility in Tulare County strengthened the state’s position as a grid storage pioneer.
Meanwhile, New England expanded its footprint with large-scale additions to the ISO New England grid. These projects demonstrate that battery storage is no longer confined to a few early-adopter markets.
Australia’s Breakout Year
Australia also delivered a major milestone in 2025. The country commissioned 4.9 GWh of utility-scale battery storage during the year — more than the combined total installed between 2017 and 2024.
In the fourth quarter alone, over 1,000 MW of new capacity came online. Large projects, including the 500 MW Liddell battery system in New South Wales, highlighted the rapid pace of expansion.
Australia’s experience shows how quickly storage can scale once policy support, market design, and financing align.
Data Centers Drive the “Race for Electrons”
A powerful new demand driver is reshaping electricity markets: data centers.
The rapid expansion of AI and cloud computing has triggered strong demand for reliable power. Gas turbine orders surged as operators sought firm capacity. This demand doubled U.S. turbine capital costs in just two years.
However, higher gas costs are improving the competitiveness of renewables and storage. In regions like California and parts of Texas, co-located solar and four-hour battery systems can already meet a significant share of data center demand at lower cost than new gas plants.
Grid interconnection queues and gas turbine supply constraints are also slowing fossil fuel projects. In contrast, solar and storage systems can often deploy more quickly.
As Vasdev explained, the world is in a “race for electrons” to meet rising demand from electrification and data centers. In many markets, renewables are not only cheaper for new builds — they are now undercutting the operating costs of existing fossil fuel plants.
Solar beats new coal and gas across most Asia-Pacific markets. Wind is the lowest-cost new generation source in the U.S. and Canada. Solar consistently outcompetes fossil fuels in Southern Europe, while wind dominates in Northern Europe.
From Niche Technology to Grid Backbone
Battery storage has moved beyond its early-stage niche. It is now central to power system planning.
As storage costs fall, batteries strengthen renewable energy revenues, stabilize grids, and reduce reliance on fossil-fuel peaking plants. Instead of building new gas capacity for short-duration peaks, operators can increasingly rely on storage-led balancing.
BNEF’s annual LCOE report analyzed more than 800 recently financed projects across over 50 markets and 28 technologies. Its expanded coverage of the Middle East and Africa highlights how storage economics are improving globally, not just in mature markets.
The broader message is clear. While 2025 delivered mixed signals for clean power costs, battery storage emerged as the clear winner. Manufacturing overcapacity, technological learning, and intense competition have driven prices to record lows.
Looking ahead, continued cost declines could accelerate the global shift toward renewable-dominated grids supported by flexible storage. In that transition, batteries are no longer optional. They are becoming the backbone of a reliable, low-carbon electricity system.
The Mercedes-AMG PETRONAS F1 Teamhas stepped up its climate action strategy with a major expansion of its global carbon dioxide removal (CDR) portfolio. The team has added seven new projects across multiple carbon removal pathways, making it one of the most diverse portfolios in global sport.
This move is a long-term, multi-year investment designed to support high-integrity, science-backed climate solutions. While emissions reduction remains the top priority, the team recognizes that some emissions cannot be eliminated. That is where durable carbon removals come in.
The expansion marks another milestone in Mercedes’ broader Net Zero journey — one built on practical solutions, data transparency, and industry collaboration.
A Clear Net Zero Roadmap
Mercedes tracks its carbon footprint in two ways. First, it measures Race Team Control emissions (RTCe). These include Scope 1, Scope 2, and selected Scope 3 emissions that the team can influence directly. Second, it reports its total emissions across Scopes 1, 2, and 3.
Unlike many companies that only focus on direct emissions, Mercedes extends its control boundary to include upstream transport, waste, fuel-related activities, business travel, employee commuting, and energy use. This broader approach aligns with Formula 1’s 2030 Net Zero commitment.
For its 2030 goal, Mercedes plans to cut 75% of RTC emissions compared to its 2022 baseline. The remaining 25% will be addressed through high-quality carbon removals, following the Oxford Offsetting Principles.
Progress so far is significant. By 2024, the team had already reduced its Race Team Control emissions by 35% compared to 2022.
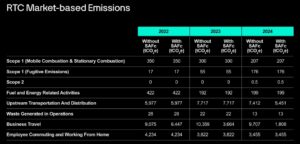
Source: Mercedes
Where the Emissions Cuts Came From
The 35% reduction came from targeted operational changes. During the European race season, 98% of logistics used HVO100 biofuel. This low-carbon fuel helped slash transport emissions. Meanwhile, 68% of aviation emissions were addressed through Sustainable Aviation Fuel certificates (SAFc).
At its Brackley factory in the UK, Mercedes reduced gas consumption and improved energy efficiency. The team also continued electrifying its company vehicle fleet.
However, not everything went smoothly. In 2024, an F-gas leak at the factory temporarily increased Scope 1 emissions. F-gases have high global warming potential, so even small leaks can have an outsized impact. While the team has already transitioned to lower-impact refrigerants where possible, some cooling systems still rely on high-impact gases. Mercedes has tightened monitoring systems and plans to shift to better alternatives as soon as viable options become available.
Despite this setback, the overall emissions trend remains downward. The team now aims to fully eliminate Scope 1 and 2 emissions by 2026, with any small residual amounts neutralized through removals.
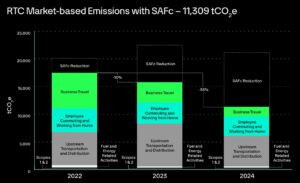
Source: Mercedes
Building a Long-Term Carbon Removal Strategy
Even with aggressive cuts, some emissions remain hard to eliminate — especially across global supply chains. Purchased goods and services represent a large share of Scope 3 emissions. These are complex and often outside direct control.
That is why Mercedes is investing in durable, verifiable, and scalable carbon removals.
Source: Mercedes
In total, the team is investing in roughly 18,900 tonnes of CO2 equivalent across nature-based, hybrid, and engineered removal projects. These investments support the 2030 Race Team Control Net Zero goal.
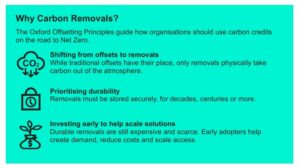
Importantly, the strategy follows the Oxford Offsetting Principles. This means prioritizing permanent removals and gradually shifting from short-term nature-based offsets toward long-term engineered solutions.
A Diverse Portfolio Across Technologies
To reduce risk and build resilience, Mercedes has spread its investments across several technologies and geographies. The portfolio now spans:
Frontier: One key partner is Frontier, supporting durable removal technologies. Through this agreement, Mercedes backs solutions such as direct air capture and enhanced weathering. These technologies aim to store carbon for more than 1,000 years and eventually reduce costs below $100 per tonne. The team expects to begin receiving credits from Frontier-backed projects as early as 2027.
Blaston Farm: In the UK, Mercedes works with Blaston Farm near Silverstone to support regenerative agriculture. This project removes carbon while restoring soil health and boosting biodiversity. The team signed a three-year agreement and used 2,000 tonnes of removals from the project against its 2024 footprint. Advanced soil monitoring combines direct sampling with AI-driven image analysis, improving both accuracy and scalability.
Chestnut Carbon: In the US, Mercedes partnered with Chestnut Carbon to restore degraded agricultural land in the southeastern region. The first project will convert 200 hectares into biodiverse forests by planting more than 260,000 native trees. Since 2022, Chestnut Carbon has planted over 17 million trees across 30,000 acres. The collaboration is expected to deliver 1,000 to 1,500 tonnes of carbon removals annually starting in 2027.
The broader portfolio also includes projects in Brazil, Canada, Denmark, and India. This geographic spread reflects the team’s goal to create impact in regions connected to the Formula One race calendar.
All projects are curated and verified by CUR8, a carbon removal marketplace that assesses durability, transparency, and methodology. This adds an extra layer of credibility to the portfolio.
Mercedes understands it cannot solve climate challenges alone. The team actively collaborates within and beyond motorsport.
It participates in the F1 ESG Working Group, sharing best practices across the grid. Internally, its Sustainability Working Group connects team partners to exchange ideas and tackle shared challenges.
Notably, Mercedes was the first motorsport team to sign The Climate Pledge, committing to Net Zero across total emissions by 2040.
Team partners such as Signify, UBS, and Nasdaq support high-integrity climate solutions as well. Meanwhile, companies like Meta and Microsoft have played a major role in scaling the carbon removals industry, helping create demand for early-stage technologies.
Speaking at Economist Impact’s Sustainability Week, Head of Sustainability Alice Ashpitel emphasized that emissions reduction remains the priority. However, she stressed that high-quality removals are essential for dealing with residual emissions. By investing early across different technologies and regions, the team aims to help scale durable climate solutions while delivering benefits to communities and ecosystems.
Engineering Change On and Off the Track
Formula One has committed to Net Zero by 2030. As one of the sport’s most prominent teams, Mercedes is positioning itself at the forefront of that transition.
The team’s approach combines aggressive emission reductions, early investment in permanent carbon removal technologies, and strong governance. Instead of relying on short-term offsets, it is helping build a long-term carbon removal market capable of delivering climate impact at scale.
This strategy reflects the same engineering mindset that drives success on the track: test, refine, optimize, and scale.
By cutting emissions where it has control and investing in durable removals where it does not, Mercedes is shaping a credible path toward Net Zero. The goal is not just to meet targets but to help raise standards across motorsport and beyond.
In a sport defined by speed and precision, Mercedes is proving that climate leadership also requires bold action and long-term thinking.
Climate investor and billionaire Tom Steyer is scaling up efforts to cut emissions from buildings. His firm, Galvanize Climate Solutions, has raised $370 million for a new strategy focused on decarbonizing commercial real estate.
The new vehicle, Galvanize Real Estate Fund I, will invest in aging commercial properties and upgrade them with clean energy and efficiency technologies. The goal is to reduce emissions while increasing building value and operating income.
The fund secured commitments from a broad group of institutional investors. These include pension funds, foundations, family offices, banks, and registered investment advisers.
From Hedge Fund Billionaire to Climate Investor
Galvanize was launched in 2022 by Tom Steyer and investment executive Katie Hall. The firm focuses entirely on climate and energy transition investments.
The company’s strategy reflects a growing shift in climate finance. Investors are recognizing energy efficiency and building electrification as both a climate solution and a profitable business opportunity.
Katie Hall, Co-Chair & CEO of Galvanize, said:
“GRE’s strategy demonstrates a different role for sustainability, one that places it at the center of profit generation and product differentiation. In an environment where the combined impact of rising electricity prices and market volatility is accelerating, there is a large and ongoing opportunity for the team to leverage decarbonization as a driver of value creation.”
Galvanize plans to use the funds to buy and improve properties in high-growth U.S. markets. These areas have rising demand and increasing energy costs.
Steyer is best known for founding Farallon Capital Management, a global hedge fund that grew to tens of billions of dollars in assets. He later became a prominent climate advocate and ran for U.S. President in 2020 on a climate policy platform.
At Galvanize, Steyer and Hall built a platform that invests across multiple asset classes. These include venture capital, growth equity, public equities, private credit, and real estate.
The firm’s strategy focuses on sectors that must transform to reach net-zero emissions. These include power generation, transportation, industry, agriculture, and buildings. Buildings are a major priority because they represent one of the largest sources of global emissions.
The fund also builds on Galvanize’s earlier capital raises. In 2023, the firm closed its first venture and growth fund with more than $1 billion in commitments to climate technology companies.
Why Buildings Are One of the Biggest Climate Targets
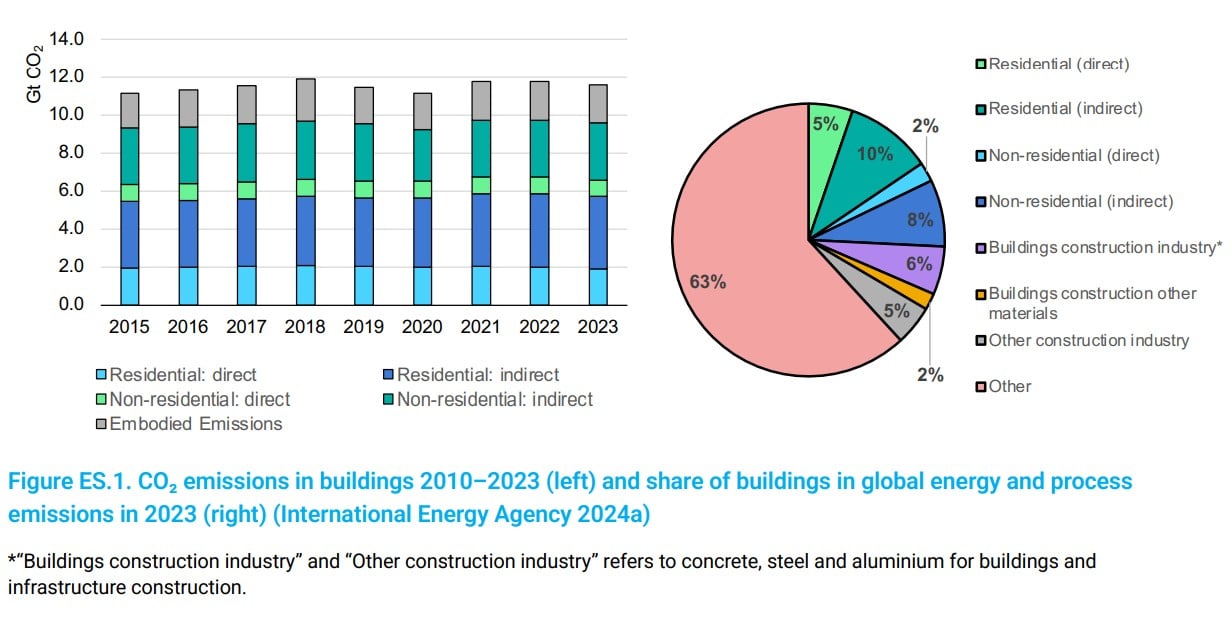
Buildings are responsible for a large share of global emissions. The International Energy Agency says that buildings use about 30% of global energy. They also produce around 26% of energy-related CO₂ emissions.
Source: UNEP
Commercial buildings in particular consume huge amounts of electricity and fossil fuel energy for heating, cooling, lighting, and data and equipment. Many older buildings were built decades ago. They lack modern efficiency technologies or electrified heating systems.
This creates a large opportunity for investors.
Installing solar panels, energy-efficient HVAC systems, heat pumps, and smart energy management systems helps building owners lower energy costs. This also cuts emissions.
Galvanize’s strategy targets properties where energy upgrades boost net operating income. This approach goes beyond simply lowering carbon footprints.
That investment model reflects a broader shift in climate finance. Investors increasingly see decarbonization projects as value-creating infrastructure upgrades rather than simple compliance costs.
Inside Galvanize’s First Real Estate Portfolio: 15 Buildings Across 11 U.S. Cities
Galvanize has already begun deploying capital through the new strategy. So far, the fund has completed five investments covering 15 buildings across 11 U.S. cities. The properties represent about 2.4 million square feet of real estate.
The firm expects large emissions reductions from upgrades in this initial portfolio. Their planned improvements include:
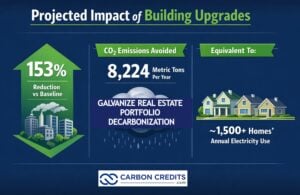
Together, these measures are expected to deliver portfolio-level decarbonization of about 153% compared with baseline emissions. They could also avoid roughly 8,224 metric tons of carbon dioxide emissions each year.
For comparison, that amount of emissions is roughly equal to the annual electricity use of more than 1,500 U.S. homes, based on U.S. Environmental Protection Agency estimates.
How Energy Retrofits Turn Climate Action Into Profit
A key feature of the fund is its focus on profitability. Traditional climate policies often treat emissions reduction as a regulatory burden. Galvanize instead frames decarbonization as a driver of real estate value creation.
Energy upgrades can increase property income in several ways, including:
Lower energy bills for tenants
Higher building occupancy rates
Higher rent for energy-efficient space
Protection from rising electricity prices
Katie Hall said the strategy places sustainability “at the center of profit generation and product differentiation.” Energy markets also support this investment thesis.
Electricity demand is rising in many U.S. regions due to data centers, electrification of transport, industrial electrification, and population growth in urban areas.
At the same time, energy price volatility has increased. Buildings with on-site generation or lower energy demand can protect owners from rising costs. That makes energy upgrades financially attractive for property investors.
The Trillion-Dollar Opportunity in Building Decarbonization
The opportunity in building decarbonization is enormous. Buildings are one of the largest sources of global emissions, as the IEA data shows.
The building and construction sector, together, is responsible for about 37% of global CO₂ emissions. This includes emissions from materials like cement, steel, and aluminum.
Operational emissions from buildings alone reached about 9.8 gigatonnes of CO₂ in 2023, according to global building sector reports.
At the same time, demand for buildings continues to grow. The United Nations Environment Programme (UNEP) says that from 2015 to 2023, cities grew and added 51 billion square meters of new floor space worldwide.
This means much of the world’s building stock still needs upgrades. Efficiency improvements, electrification, and renewable energy can cut building emissions by 80–90% in some areas, says UN climate assessments.
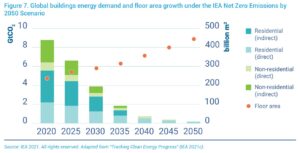
The IEA data reveals how much this sector should grow under the net-zero scenario. For investors, this creates a massive market. Retrofitting commercial properties with clean technologies can reduce emissions. It also lowers energy costs and boosts property value.
Source: IEA
Galvanize’s strategy fits squarely into that trend. The firm believes that energy upgrades can transform older properties into high-performance climate assets.
Climate Capital Is Flooding Into Real Estate
The $370 million real estate fund reflects the rapid growth of climate-focused investment firms. Across the broader market, investment in clean energy infrastructure is expected to grow rapidly.
Analysts estimate that more than $5 trillion could be invested globally in energy transition infrastructure by 2030, covering areas such as renewables, grid systems, electrification, and efficiency. Buildings will be a major part of that spending.
Galvanize has also launched a new $1.3 billion credit and capital solutions strategy. This will help finance energy transition projects, along with its venture and growth funds.
As cities and companies pursue net-zero goals, commercial properties are under pressure to reduce emissions. Investors who can upgrade buildings quickly may capture significant financial value.
For Tom Steyer and Galvanize, the new fund represents another step in scaling climate capital. If successful, it could show that cutting emissions and generating investment returns can happen at the same time.
On February 16, Hirono Townsigned a comprehensive partnership agreement with Fager Co., Ltd. to promote decarbonized agriculture and strengthen the local rice brand. The agreement focused on cutting greenhouse gas emissions while improving rice quality and farmer incomes.
Hirono’s mayor, Kazuma Komatsu, and Fager’s CEO, Takahiro Ishizaki, formalized the deal at a ceremony marking a new step toward linking climate action with rural economic revival.
A Climate Challenge Turns Into Opportunity
Rice farmers across Japan have struggled with extreme heat in recent years. High temperatures during the growing season have reduced grain quality and increased the risk of damage. In Fukushima’s coastal Hamadori region, growers have felt this pressure directly.
At the same time, Japan’s agricultural sector has begun to see decarbonization not just as an environmental duty but also as a business opportunity. Farmers can now generate carbon credits by reducing emissions from rice paddies and other farm activities. These credits create a new income stream while supporting national climate targets.
Hirono Town had already declared its ambition to become a Zero Carbon City by 2050. This partnership aligned with that goal. It aimed to make local agriculture more resilient, profitable, and climate-friendly.
Source: Fager Inc.
How the Carbon Credit Model Works
Under the agreement, farmers in Hirono will adopt proven methods to reduce methane emissions from rice paddies. One key technique involves extending the mid-season drainage period. Farmers temporarily drain water from paddy fields during cultivation. This process lowers methane emissions, which normally form in flooded conditions.
Growers will also consider using biochar, a carbon-rich material that stores carbon in soil and improves soil health. Together, these measures can generate government-certified J-Credits.
Japan’s J-Credit system is a national carbon offset program. It certifies emission reductions or removals from activities such as renewable energy use, energy efficiency, forest management, and low-emission farming. Companies buy these credits to offset their emissions or meet climate goals. As a result, farmers and local governments gain a new source of revenue.
Fager has built strong experience in this field. The company supports J-Credit creation in 36 prefectures across Japan. In 2024 alone, it generated about 136,000 tons of CO₂ credits from agricultural projects. Now, it will bring that expertise to Hirono.
Reinventing “Hirono Rice”
Beyond carbon markets, the initiative aims to build a strong premium brand. Farmers will market locally grown Koshihikari rice as “Hirono Rice.” The brand will highlight three features: environmentally friendly cultivation, heat resilience, and high quality.
As extreme heat becomes more common, Japanese consumers are paying closer attention to how food is produced. Climate-smart branding could give Hirono’s rice a competitive edge.
One participating farmer, Toshirei Suzuki, already extended the mid-season drainage period in his paddies. He reported no negative impact on yield or grain quality. In fact, his rice ranked first in taste within Hirono Town, and all of his harvest met first-class standards. He said he joined the program smoothly and wants to continue if it benefits the environment.
His experience offered early proof that emission reductions and quality improvements can go hand in hand.
Digital Tools and Heat Countermeasures
The agreement goes beyond carbon credits as it also promotes agricultural digital transformation, often called agricultural DX.
Hirono and Fager will explore installing water-level and water-temperature sensors in paddy fields. These tools help farmers monitor conditions in real time. With better data, growers can respond quickly to heat stress and water management challenges.
Revenue from carbon credits will fund these upgrades. The partners aim to create a circular model. Farmers reduce emissions, generate credits, sell them, and reinvest the proceeds into better cultivation systems and climate adaptation measures.
This cycle connects environmental action directly to farm income and resilience.
A Model Linked to National Reconstruction
The partnership also fits into broader reconstruction efforts in Fukushima. Fager joined the national “Fukushima Reconstruction Living Lab” initiative led by Japan’s Reconstruction Agency. The program matches private firms with local governments to solve regional challenges.
In this case, agriculture stood at the center. By combining decarbonization, branding, and digital tools, Hirono aims to strengthen its rural economy while supporting recovery in the Hamadori area.
If successful, the model could expand beyond Hirono to other parts of Fukushima and eventually across Japan.
Japan Scales Up Carbon Markets to Hit 2050 Net Zero
Japan has pledged to achieve carbon neutrality by 2050. It also aims to cut greenhouse gas emissions by 46 percent from 2013 levels by 2030. To reach these goals, the government has steadily expanded carbon markets and sector-based policies.
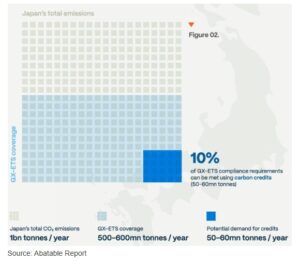
In April 2026, Japan will introduce a full-scale emissions trading scheme (ETS). Around 300 to 400 companies that emit more than 100,000 tons of greenhouse gases per year must participate. The system is expected to cover roughly 60 percent of national emissions.
To support this shift, the government launched the Green Transformation (GX) Promotion Strategy. The plan outlines more than 150 trillion yen in public and private climate investment over the next decade. It includes a 20 trillion yen early-stage package backed by GX Economic Transition Bonds. The goal is to stimulate new markets while keeping economic growth stable.
Japan has taken a cautious and pragmatic approach. Policymakers design climate rules that businesses can realistically follow. The Japan Business Federation, known as Keidanren, plays a key role in shaping legislation. Its involvement helps ensure that new climate policies remain practical and economically viable.
The Role of the J-Credit Scheme
The J-Credit Scheme plays a central role in Japan’s domestic carbon market. Three ministries jointly manage it: the Ministry of the Environment, the Ministry of Economy, Trade and Industry, and the Ministry of Agriculture, Forestry and Fisheries.
As of May 2025, the scheme had registered 1,262 projects. It had certified a total of 12.08 million tons of CO₂ credits. The government now targets 15 million tons of certified J-Credits by fiscal year 2030.
Source: offset8capital
Projects can register individually or as programmatic bundles that group many small activities into one larger project. This structure makes it easier for small farmers to participate.
Hirono’s rice initiative fits well within this framework. It visualizes emission reductions measurably and links them directly to local economic benefits.
A Blueprint for Sustainable Rural Growth
The Hirono–Fager partnership showed how climate policy can work on the ground. It connected national carbon markets with everyday farming practices. It turned methane reduction into income. It funded heat countermeasures with carbon revenue. And it built a premium rice brand around sustainability.
If the project delivers as planned, Hirono Town could become a model for climate-smart agriculture in Japan. The town’s rice would stand not only for taste and quality, but also for environmental responsibility and resilience in a warming world.
A new regulatory filing in the European Union shows that several major carmakers will not join the 2026 carbon credit pool led by Tesla. The filing lists Stellantis, Toyota Motor Corporation, and Subaru Corporation as absent from the Tesla-led alliance for the coming compliance year.
The change highlights an important shift in the European auto market. Carbon credit trading has become a major financial lever for electric vehicle makers, especially Tesla. At the same time, legacy automakers are investing heavily in electric and hybrid vehicles to reduce their dependence on regulatory credits.
EU Filing Reveals Breakup in Tesla’s Carbon Credit Alliance
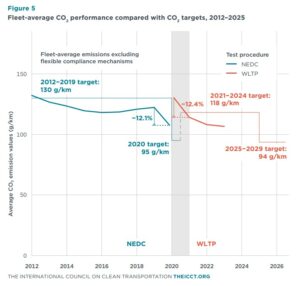
The European Union allows automakers to join “emissions pools” to meet strict fleet-wide carbon targets, as shown below. In these alliances, companies combine their fleets when regulators calculate average CO₂ emissions.
Source: ICCT
Carmakers with high emissions can offset them by joining a pool led by a low-emission manufacturer such as Tesla.
According to an EU filing dated February 27, 2026, Tesla is recreating its carbon credit pool for the year. However, Stellantis, Toyota, and Subaru are not currently listed as members.
The absence marks a change from 2025. That year, the Tesla pool included a large group of automakers: Tesla, Stellantis, Toyota, Subaru, Ford, Honda, Mazda, Suzuki, and Leapmotor. These partnerships helped companies comply with EU emissions targets while their EV production ramped up.
For 2026, the pool appears smaller. Current participants include Tesla alongside Ford Motor Company, Honda Motor Company, Mazda Motor Corporation, and Suzuki Motor Corporation.
However, companies can still join later. Automakers are allowed to enter pooling agreements until December 2026, leaving the door open for changes during the year.
How Tesla Turns Carbon Credits Into Billions in Revenue
Tesla’s role in carbon pools comes from its all-electric lineup. Since the company sells only zero-emission vehicles, its fleet emissions are far below EU regulatory limits. This creates excess regulatory credits. Tesla can sell those credits to other automakers that struggle to meet the limits.
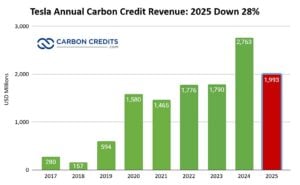
Globally, Tesla has earned nearly $2 billion in 2025 from emissions credits, according to its report filings. The EV maker has earned a total of around $12.4 billion since 2017.
These revenues have historically played an important role in Tesla’s profitability. In several earlier years, regulatory credits accounted for a large share of the company’s net income.
In Europe alone, analysts previously estimated that Tesla’s pooling arrangements could generate more than €1 billion in annual credit revenue. For traditional automakers, buying credits is often cheaper than paying regulatory fines.
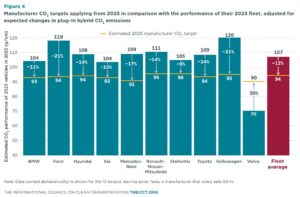
Under EU rules, companies that fail to meet emissions targets face penalties of €95 per gram of CO₂ above the limit for every car sold. This can add up quickly for large manufacturers selling millions of vehicles each year.
Source: ICCT
Carbon credit pooling, therefore, acts as a compliance bridge while companies transition their fleets to electric vehicles.
Why Some Automakers Are Leaving the Pool
The absence of Stellantis, Toyota, and Subaru from the 2026 pool may reflect several strategic changes across the industry.
First, the European Commission adjusted the compliance timeline. Instead of assessing emissions strictly for 2025, regulators now allow compliance based on the average emissions between 2025 and 2027.
This change gives automakers more flexibility. Companies that expect their emissions to fall in the next two years may decide they no longer need to buy credits immediately.
Second, many legacy manufacturers have expanded their production of hybrid and electric vehicles. For example:
Toyota has one of the world’s largest hybrid fleets.
Stellantis has expanded its EV lineup across brands such as Peugeot, Opel, Fiat, and Jeep.
Subaru sells hybrid vehicles and is developing more EV models with Toyota.
These changes could reduce their reliance on Tesla’s credits in the short term. There are also corporate partnerships reshaping the market. Stellantis has a joint venture with Leapmotor, which sells EVs in Europe and could help offset emissions within the group.
Europe’s Strict Climate Rules Are Reshaping the Auto Market
The EU has some of the world’s strictest vehicle climate rules. Under the bloc’s current standards, automakers must steadily cut average fleet emissions. These targets support the EU’s broader climate goal of reducing greenhouse gas emissions 55% by 2030 compared with 1990 levels.
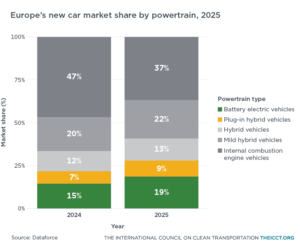
The long-term objective is even more ambitious. The EU plans to phase out sales of new gasoline and diesel cars by 2035, effectively shifting the market toward zero-emission vehicles.
As a result, the European EV market has grown rapidly. Battery-electric vehicles (BEVs) accounted for 15% in 2024. In 2025, this share rose to 19%, reflecting continued EV market growth amid stricter emissions rules.
Source: ICCT
Hybrid vehicles also play a large role in the transition. Many manufacturers use hybrids to reduce fleet emissions while EV adoption grows.
Tesla’s EV Dominance Still Anchors the Carbon Credit Market
Despite changes in the credit market, Tesla remains one of the most influential players in the global EV industry. The company delivered about 1.81 million vehicles in 2024, making it one of the largest electric car producers worldwide. However, deliveries dropped to 1.6 million in 2025.
Tesla’s main models include: Model 3, Model Y, Model S, and Model X.
The carmaker also continues to expand its production footprint. Major factories operate in the United States, China, and Germany. The company’s Gigafactory Berlin-Brandenburg plays a key role in supplying EVs to the European market.
As EV adoption rises, the role of regulatory credits may gradually shrink. More automakers will meet emissions targets using their own electric vehicles rather than buying credits. Yet, credits still provide a useful financial buffer for Tesla during the transition period.
Are Carbon Pools a Temporary Bridge for the Auto Industry?
Carbon credit pooling reflects the uneven pace of the automotive transition. Some companies, like Tesla, moved early into fully electric vehicles. Others are still shifting large gasoline and diesel fleets toward cleaner technology.
Pooling allows the industry to comply with regulations while maintaining vehicle supply and avoiding sudden price increases.
Yet, the system may evolve. As more automakers scale EV production, fewer companies will need to buy credits. This could gradually reduce the value of Tesla’s carbon credit business, as the 2025 sales drop shows.
At the same time, tightening climate policies and rising EV demand could create new market dynamics.
For now, Tesla remains at the center of the regulatory credit ecosystem. The 2026 EU filing shows that alliances are shifting, but the underlying system still plays an important role in the global transition to low-carbon transportation.
The coming years will reveal whether carbon pools remain a major financial tool or become a temporary bridge as the auto industry moves toward fully electric fleets.
The United States is stepping up its push for small modular reactors (SMRs) in the Philippines. In mid-February 2026, the U.S. Trade and Development Agency (USTDA) announced $2.7 million in technical assistance for Meralco PowerGen Corp. (MGEN). The work will review advanced U.S. SMR designs and create an implementation roadmap for what could become the country’s first SMR nuclear power plant.
USTDA framed the project as “vendor-neutral” evaluation support that can help the Philippines compare options and plan the steps needed to move from concept to construction. The goal is to speed early planning, such as technical screening and sequencing, before major capital decisions.
This is not a power plant approval. It is a funded study and planning effort. Still, it signals stronger U.S. backing for nuclear cooperation at a time when the Philippines is looking for more reliable, low-carbon power sources.
Meralco Chairman Manuel Pangilinan remarked:
“Through the generosity of the US government, we are laying the groundwork for the responsible integration of nuclear into our energy mix through small modular reactors. This offers a safe and responsible pathway towards energy security for generations to come.”
Coal Dependence and Rising Demand Drive the Debate
The Philippines still relies heavily on fossil fuels for electricity. Official DOE data show that in 2024, total power generation reached 126,941 GWh. Coal produced 79,359 GWh, which is about 62.5% of the country’s electricity that year.
Source: CEIC
Natural gas produced 18,047 GWh (about 14%). Renewable energy produced 28,193 GWh (about 22%). Oil produced 1,342 GWh (about 1%).
On the capacity side, the DOE reported 29,706 MW of total installed generating capacity in 2024, with the following breakdown:
Coal capacity was 13,006 MW (about 44%);
Renewable energy capacity was 9,520 MW (about 32%);
Natural gas was 3,732 MW (more than 12%); and
Oil was 3,448 MW (almost 12%).
Demand growth also shapes this debate. In the DOE’s power planning materials, the country’s peak demand is projected to rise from 16,596 MW in 2022 to 68,483 MW by 2050, which the DOE notes equals an average annual growth rate of 5%.
These numbers help explain why policymakers and utilities are reviewing many options at once. They include grid upgrades, energy efficiency, renewables, storage, gas, and now nuclear.
SMRs Explained: Smaller Reactors, Big Expectations
An SMR is a nuclear reactor designed to be smaller than traditional large reactors. The International Atomic Energy Agency (IAEA) defines SMRs as reactors with a capacity of up to 300 MW(e) per unit. That is roughly one-third of the size of many conventional reactors.
The image is an example of an SMR design by NuScale Power, an American SMR company.
Source: NuScale
Supporters point to three practical features. First, SMRs aim for modular construction. Developers may build parts in factories and assemble them on site. Second, SMRs can be scaled by adding modules over time. Third, SMRs can provide steady output that does not depend on weather, which can help a grid manage variability from wind and solar.
At the same time, SMRs do not remove hard requirements. Any nuclear project still needs a strong regulator, safe site selection, trained staff, emergency planning, fuel and waste plans, and long-term financing. These items often drive timelines and costs, especially for a first plant in a country that is new to commercial nuclear power.
Small Reactors, Big Global Ambitions
Around the world, interest in small modular reactors is growing fast. Designers have created more than 120 SMR designs in recent years, with dozens in early review or licensing stages.
The global market for SMRs is also expanding. Analysts estimate the value of SMR markets at several billion U.S. dollars today, and rising over the next decade. Some forecasts show markets increasing to roughly double or more by the early 2030s, around $10–16 billion.
Installed SMR capacity is also expected to rise. Industry reports project several hundred megawatts of capacity by 2030, with further growth as more designs reach construction, up to 2.0 GW per IEA forecast.
Countries in North America, Europe, and the Asia Pacific are leading deployment and planning. Many governments see SMRs as a way to add reliable, low-carbon power alongside renewables.
Global forecasts to 2050 show SMRs could play a bigger role in clean energy systems, especially under scenarios that aim for low emissions and stable power. However, real deployment depends on licensing, investment, and supply chain development.
The 123 Agreement: Legal Groundwork for Nuclear Cooperation
A key reason U.S. firms can offer nuclear technology is the U.S.–Philippines Agreement for Cooperation in the Peaceful Uses of Nuclear Energy, often called a “123 Agreement.” The U.S. State Department said the agreement entered into force on July 2, 2024. It sets the legal framework for civil nuclear cooperation and can support exports of nuclear material, equipment, and components under U.S. rules.
In practice, this type of agreement is one building block. It does not select a reactor design and does not guarantee financing. It does create the conditions for deeper technical engagement, training, and potential commercial activity, as long as both sides meet non-proliferation and regulatory requirements.
From Planning to Licensing: Mapping the Nuclear Timeline
The Philippines began its nuclear journey after the 1973 oil crisis. It built the 621 MWe Bataan Nuclear Power Plant in 1984 at a cost of USD460 million. However, safety and financial concerns stopped it from operating. The plant was never fueled but has been maintained.
The DOE has publicly set nuclear targets in its 2022 planning. Reporting around the Philippine Energy Plan has cited a pathway that aims for at least 1,200 MW of nuclear capacity by 2032, rising to 2,400 MW by 2035, and 4,800 MW by 2050.
The DOE has also discussed regulatory readiness. In a November 2025 media release, the DOE said the Philippines aims to begin accepting nuclear power plant license applications by 2026, linked to the creation of the country’s nuclear safety regulator under Republic Act No. 12305.
International reviews add more context. In December 2024, the IAEA reported that the Philippines was making progress on nuclear infrastructure development, while still working through the many steps needed for a full nuclear power program.
Against that timeline, the USTDA-MGEN work looks like an “early stage” accelerator. It helps narrow design choices and map steps. It does not replace the national licensing process.
Geothermal’s Role in a Future Nuclear Mix
The Philippines already has a major source of steady renewable power: geothermal energy. DOE statistics list 1,952 MW of geothermal installed generating capacity in 2024. Geothermal generation reached 10,789 GWh in 2024.
Source: National Geothermal Association of the Philippines, Inc. (NGAP)
This matters for the SMR discussion because many people describe nuclear as “baseload,” meaning it can run day and night. In the Philippines, geothermal already provides a similar kind of steady output in many areas. The challenge is that geothermal expansion depends on location, drilling success, and up-front exploration risk.
This is why planners often look at a mix. They can expand renewables like geothermal, hydro, wind, and solar, while adding storage and grid upgrades. They can also evaluate nuclear for future reliability needs, especially if coal plants retire over time.
For the U.S. side, the near-term goal is clear. It wants U.S. designs and services to be part of the shortlist. For the Philippines, the task is also clear. It must match any technology choice to national needs, grid limits, safety rules, and long-term affordability.
To provide the best experiences, we use technologies like cookies to store and/or access device information. Consenting to these technologies will allow us to process data such as browsing behavior or unique IDs on this site. Not consenting or withdrawing consent, may adversely affect certain features and functions.
Functional
Always active
The technical storage or access is strictly necessary for the legitimate purpose of enabling the use of a specific service explicitly requested by the subscriber or user, or for the sole purpose of carrying out the transmission of a communication over an electronic communications network.
Preferences
The technical storage or access is necessary for the legitimate purpose of storing preferences that are not requested by the subscriber or user.
Statistics
The technical storage or access that is used exclusively for statistical purposes.The technical storage or access that is used exclusively for anonymous statistical purposes. Without a subpoena, voluntary compliance on the part of your Internet Service Provider, or additional records from a third party, information stored or retrieved for this purpose alone cannot usually be used to identify you.
Marketing
The technical storage or access is required to create user profiles to send advertising, or to track the user on a website or across several websites for similar marketing purposes.