The voluntary carbon market (VCM) lets companies buy carbon credits to offset their greenhouse gas emissions. AlliedOffsets, a data and technology firm for carbon offsetting, tracks this market closely. Their database covers more than 36,000 projects, over 28,000 buyers, and billions of tons of carbon that have been issued or retired.
The VCM is growing fast. Over the last five years, most buyers have come from technology, telecommunications, and energy. Other sectors, like industrials, manufacturing, financial services, and aviation, also participate, though in smaller amounts.
The United States, the United Kingdom, France, Germany, and Japan have the most buyers, showing that developed countries lead the market.
As the market grows, new companies and sectors are expected to join. AlliedOffsets studied over 130,000 companies to predict who will likely buy carbon credits next. This helps sellers, project developers, and policymakers focus their efforts where demand is likely.
LtB Model: Predicting the Next Wave of Credit Buyers
AlliedOffsets uses a model called Likelihood to Buy (LtB). It looks at companies active before and since 2024, and even those that have never bought credits publicly. The company stated:
“Ranking specific companies’ likelihoods and identifying patterns in their unifying traits informs market suppliers and intermediaries about who to pivot engagement towards. Understanding the features that play the greatest roles in determining companies’ likelihoods, meanwhile, is vital for highlighting wider drivers for the growth of the market, which serve as levers for policymakers and signals for companies themselves.”
The model includes data from 36 global registries, covering both non-anonymous purchases and retirements. It looks at several key factors that affect a company’s likelihood to buy, including:
- Abatement potential – how easy it is for the company to reduce emissions.
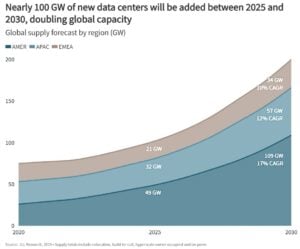
- Data center usage – companies with large data centers use more energy and may buy more credits.
- Headquarters country – companies in the US, UK, and China lead predicted purchases.
- Internal carbon pricing – companies with higher carbon costs buy more credits.
- Net-zero targets – companies with short-term or long-term climate goals are more likely to buy.
- Sector – aviation, energy, and tech tend to buy more due to rules and public pressure.
- Annual profit or loss – profitable firms are more able to purchase carbon credits.
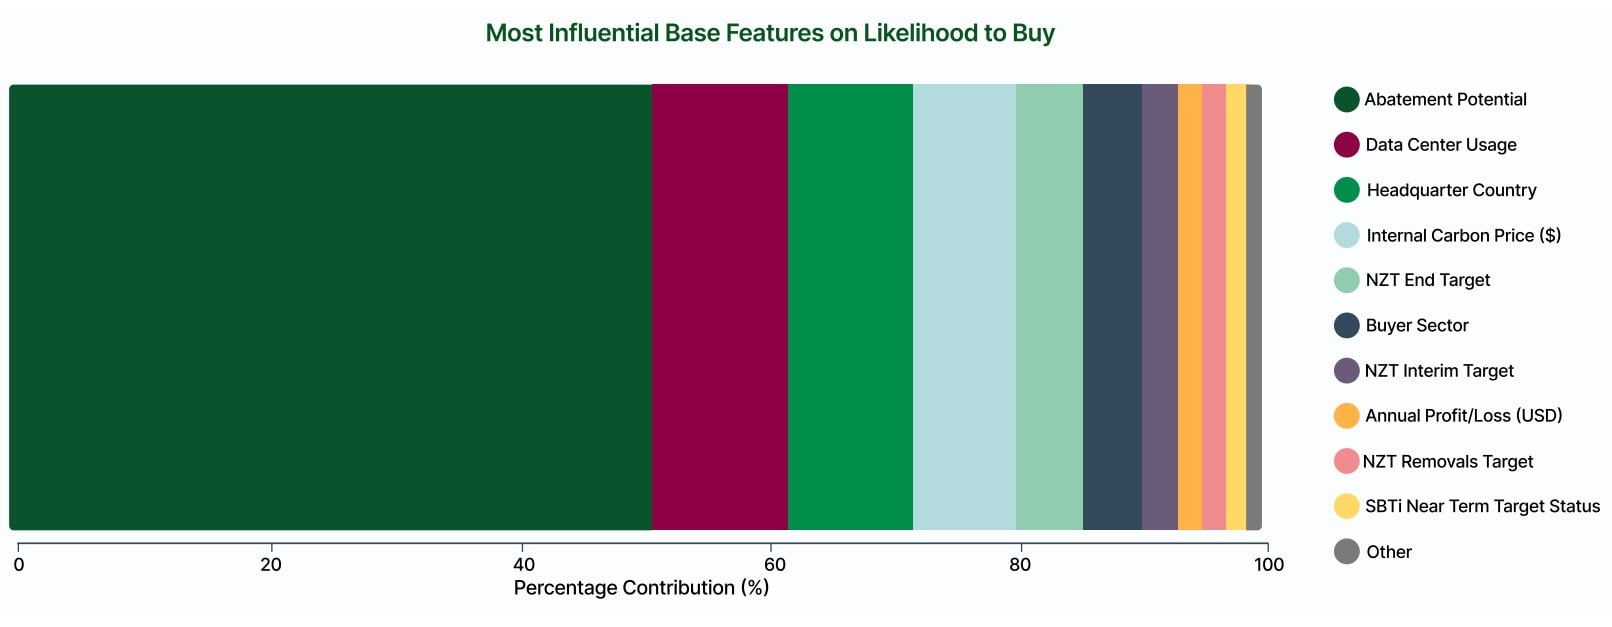
The model also uses SHAP analysis to show which factors influence predicted buying the most. Companies that recently bought credits are weighted higher. Some sectors, like aviation, are manually marked as high-likelihood because of rules like CORSIA, which requires airlines to offset emissions.
AlliedOffsets also separates companies into new entrants and returning buyers, helping track demand trends.
Forecasted Carbon Credit Demand
AlliedOffsets predicts that new and returning buyers will need about 281 million credits per year. This comes from over 11,500 companies with characteristics similar to current buyers.
The demand by project type is expected to have this composition:
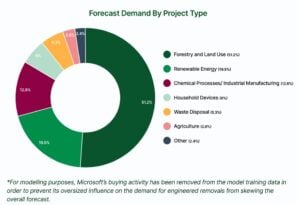
Demand for forestry projects is rising, partly because of forward contracts, which made up 55% of the 147 million credits negotiated in 2025.
By country, the greatest demand will come from the U.S., China, UK, France, Germany, and Brazil.
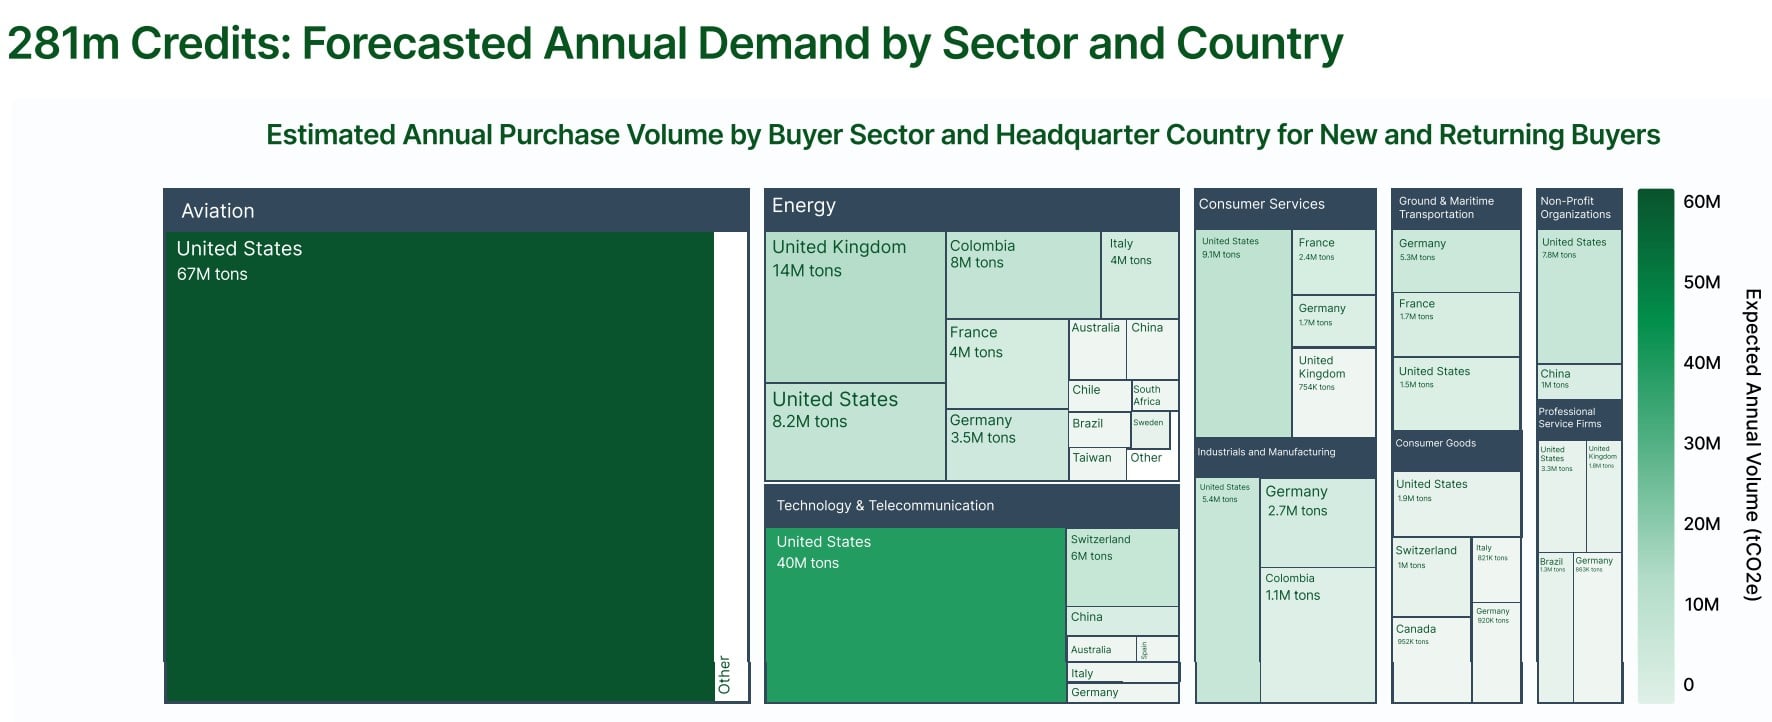
Aviation will be a big factor because airlines must offset emissions under CORSIA rules. Energy and technology companies in the US, like AT&T, IBM, and Ingram Micro, are likely to enter or re-enter the market.
Moreover, new entrants will expand the buyer base, per AlliedOffsets analysis. These include consumer goods, professional services, healthcare, and industrial firms. Many come from countries with fewer buyers so far, like Turkey and Belgium.
Financial Impact of Returning and New Buyers
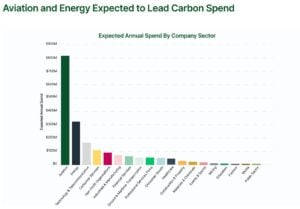
AlliedOffsets estimates that new and returning buyers will spend around $2.27 billion per year. Sector contributions are expected as follows, with aviation and energy leading the pack:
- Aviation: over $800 million per year (about one-third of total).
- Energy and Technology & Telecommunications: substantial ongoing purchases, over $300 million a year.
- Consumer services, industrials, financial services, professional services: smaller but steady spend.
Returning buyers bought nearly 7 million credits in previous years. ExxonMobil accounted for 66% of these purchases through both forward contracts and OTC deals. Other companies, like ArcelorMittal, invest in low-emission technology, reducing the need to buy credits.
New entrants, especially airlines, will increase activity. Credits purchased for CORSIA compliance must match emissions for international flights to and from ICAO member states.
Overall, growth in both returning and new buyers shows that corporate demand for carbon credits is likely to rise sharply. Companies that belong to initiatives like RE100, SBTi, Race to Zero, or NZBA are more likely to participate in the voluntary carbon market.
A Turning Point and Future Forecasts: Supply, Demand, and Policy Drivers
In 2025, the voluntary carbon credit market saw big changes. Total retirements fell to about 168 million tonnes, and new issuances dropped to around 270 million tonnes, the lowest since 2020.
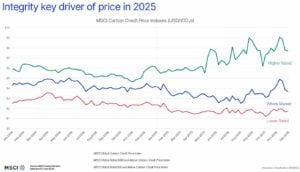
Despite this, spending rose to roughly $1.04 billion, up from $980 million in 2024. The average price per credit also climbed to about $6.10, showing that buyers are paying more for high-quality, trusted credits rather than just buying large amounts.
Companies are now choosing credits with strong monitoring and real climate impact. Nature-based projects, like afforestation and reforestation, did better than older REDD+ credits.
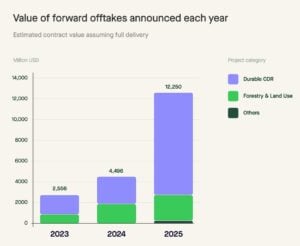
Forward contracts also grew, with over $12 billion signed in 2025, even though these will deliver only about 10 million credits a year through 2035. This shows that many companies want to secure the future supply of trusted credits. These trends match forecasts from AlliedOffsets, where demand is expected to rise for durable, high-quality carbon credits.
AlliedOffsets keeps expanding its database, now covering over 60,000 companies. Adding historical emissions data and checking with initiatives like the Forest Stewardship Council and Science Based Targets will improve forecasts.
Analysts expect supply limits may appear in forestry and land use projects as demand grows. Engineered removals, chemical processes, and industrial projects will also get more attention. Large investments by companies like Google and Amazon, which pledged $100 million to superpollutant removal projects by 2030, are expected to drive this.
Returning and new buyers, led by aviation, energy, and tech, will shape the next wave of demand. Understanding these patterns helps policymakers, intermediaries, and project developers plan supply and engagement strategies.
The voluntary carbon market is entering a new growth phase, driven by rules, climate commitments, and better forecasting tools. With models like Likelihood to Buy, market participants can plan ahead. Forestry, renewable energy, and industrial projects are likely to see the biggest benefits as corporate demand grows worldwide.