Nvidia Posts Over $46B Revenue in Q2 But Stock Slides, Balancing Record Profits with Green Goals

Nvidia (NASDAQ: NVDA) delivered another standout quarter, reporting $46.7 billion in Q2 revenue, up 56% year-over-year, as demand for AI and data center products surged. The chipmaker is not only posting strong financial results but also speeding up its sustainability efforts.

It aims for 100% renewable electricity in its operations. It engages with its supply chain and develops advanced GPUs that reduce energy use. This dual focus on growth and green innovation highlights how Nvidia is shaping both the future of AI and the path to a net-zero tech industry.

Profit Surge Meets Climate Pledge

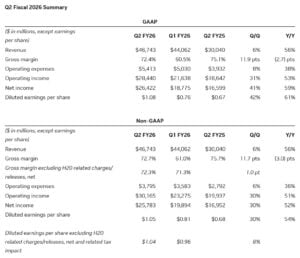
Nvidia shared its latest earnings (Q2 2026), which showed strong financial growth again. This growth comes from the ongoing demand for its AI and data center products.

  • Revenue: Approximately $46.7 billion, up 56% year-over-year. This result came in slightly above Wall Street expectations of around $46 billion.
  • Adjusted EPS: About $1.05, exceeding consensus estimates of roughly $1.01.
  • Net Income: Around $26.4 billion, up 59% year-over-year.
  • Data Center Revenue: $41.1 billion, up 56% but slightly below expectations of about $41.29 billion.
Nvidia q2 financial results
Source: Nvidia

Nvidia forecasts $54 billion in revenue for Q3, above analyst expectations. Shares fell about 3% in after-hours trading, even with the earnings beat. Investors are concerned about Nvidiaโ€™s cautious view on data center performance and risks related to China.

nvidia stock
Source: Yahoo Finance

These results show Nvidiaโ€™s strong hold in the AI and semiconductor markets. They also reveal how much investor feelings can change due to geopolitical and industry risks.

While Nvidia continues to lead in financial performance, the company is also working to align its growth with sustainability initiatives. As a leading chipmaker for data centers and AI, it recognizes the environmental issues tied to energy use and greenhouse gas emissions.

The company’s sustainability programs aim to reduce climate impact and promote innovation. The following is Nvidia’s emission reduction target.

  • Cut absolute Scope 1 and 2 emissions by 50% by fiscal 2030 (from FY2023).
  • Reduce Scope 3 emissions intensity per PFLOP by 75% by 2030.

Powering Up: Nvidiaโ€™s Clean Energy Progress

Nvidia has achieved 100% renewable electricity at all of its offices and data centers under direct control by the end of its fiscal year 2025. This shift cuts its Scope 2 emissions (indirect energy use) to zero based on market-based reporting.

In fiscal year 2024, Nvidia emitted 3,692,423 metric tons of COโ‚‚ equivalent. This total includes all greenhouse gas emissions (Scopes 1, 2, and 3), highlighting the company’s environmental impact.

nvidia 2024 emissions
Source: NVIDIA

The company also achieved supplier engagement ahead of schedule. By fiscal 2025, it had worked with suppliers covering more than 80% of Scope 3 Category 1 emissions, exceeding its initial 67% goal. These efforts aim to drive science-based emission reduction practices across its supply chain.

Driving Efficiency with Smarter Technology

Beyond its clean energy commitments, Nvidia delivers sustainability through innovative and energy-efficient technology. The new Blackwell GPUs save energy by being up to 20 times more efficient for AI inference tasks than regular CPUs.ย 

Nvidia’s Data Processing Units (DPUs) optimize data routing. This cuts energy use by about 30%. Tests on the U.S. Department of Energyโ€™s Perlmutter supercomputer found that Nvidia GPU systems are up to five times more energy efficient than CPU-only setups. This saves nearly 588 megawatt-hours of electricity each month.ย 

NVIDIA (nvda) AI blackwell
Source: NVIDIA

Technological efficiency gains are vital for cutting emissions from AI workloads, high-performance computing, and cloud infrastructure. These areas are crucial for Nvidia’s growth.

Broader ESG Strategy and Global Leadership

Nvidia combines its environmental goals with broader social and governance progress. It set new goals validated by the Science Based Targets initiative (SBTi).ย Moreover, the chipmakerโ€™s operations follow strong environmental management:

  • Facilities in Santa Clara and Israel operate under ISO 14001 standards.
  • Over 41% of data center energy in FY25 was under ISO 50001 energy management.

Headquarters buildings in Santa Clara and Hyderabad earned LEED Gold certification. The Santa Clara location features 845 kW of installed solar capacity.

In addition, Nvidia is a top workplace, ranking #4 on Glassdoorโ€™s Best Places to Work and #5 on Fortuneโ€™s Best Companies for 2025. The company also supports diversity and inclusion with corporate initiatives.

Real-World Impact Through Innovation and Partnerships

Nvidia leverages its technological strength and strategic partnerships to create tangible sustainability impacts. The Omniverse platform helps industries create digital twins. These are virtual replicas of real-world operations. This technology leads to major cuts in energy use and waste.ย 

One manufacturer using Omniverse realized savings of 120,000 kWh and 60 metric tons of COโ‚‚ annually. Nvidia teamed up with Schneider Electric to create new data center designs. These designs can lower cooling energy use by 20% and cut construction times by 30%.ย 

The company works closely with policymakers to promote AIโ€™s benefits for the climate. They want to create climate policies and rules. These should promote sustainable growth in AI and high-performance computing.

From Growth to Green Computing

Nvidiaโ€™s rapid expansion in AI computing is closely linked with its leadership in environmental sustainability. Nvidia shows how top tech companies can cut emissions. They combine clean energy success, efficient hardware, and strong supplier partnerships.ย 

Aligning financial success with environmental responsibility boosts the companyโ€™s competitive edge. It also sets new sustainability standards in the high-tech sector.

Looking Ahead: Balancing AI Growth and Climate Action

Nvidiaโ€™s Q2 earnings show its strong position in the semiconductor industry. It leads especially in the AI and data center markets. However, with growth comes responsibility.

Nvidia is under pressure from regulators, customers, and investors. They want to make sure its technologies support a sustainable future.

The companyโ€™s commitment to net-zero emissions by 2050, renewable energy use, and supply chain sustainability reflects steps in the right direction. AI demand is rising fast. So, Nvidia must focus on balancing performance with environmental impact. This will stay key to their strategy.


Carbon-Finance Project Pioneer TASC Joins Carbon Markets Africa Summit as Diamond Sponsor

Disseminated on behalf of VUKA Group.

โ€œProjects with monumental impact at the grassroots levelโ€

The organizers of the upcoming Carbon Markets Africa Summit have announced the diamond sponsorship of TASC, the award-winning and pioneering carbon finance project developer with a proven track record of innovative climate mitigating techniques and investing in local communities.ย 

Taking place in Johannesburg from 22 to 23 October, Carbon Markets Africa Summit will gather the continentโ€™s entire carbon markets value chain, from successful early carbon market movers, climate-finance-ready projects, and regulatory bodies to global institutional development organizations and investors.

High-Impact Carbon Projects at Scale

โ€œAt its core, TASC is community-driven and we believe in delivering real-world social and environmental impact rooted in rigorous carbon science,โ€ says Shelley Estcourt, TASCโ€™s CEO for Africa.ย 

Shelley Estcourt, CEO, TASC
Image: Shelley Estcourt, CEO, TASC

She adds: โ€œWe focus on delivering high-integrity, high-impact carbon projects at scale.
Historically, we have been focused on cookstoves, but our GRASS* project is a testament to our ability to diversify quite significantly. Backed by a dedicated in-house R&D team, we are constantly innovating and exploring new methodologies, platforms, and country partnerships. We have a big focus on projects that deliver impact at scale, combined with sound carbon modelling and science.โ€

Grassland Restoration and Stewardship in South Africa

TASC is currently active across sub-Saharan Africa and Australia, with expansion plans into other parts of Africa and the Australasian region. Their focus is on jurisdictions with advanced Article 6 carbon market frameworks, where the enabling environment allows for long-term, scalable impact.

TASC south africa

950,000 cookstoves distributed

In 2023, TASC won the Environmental Finance Voluntary Carbon Market Award for its cookstove project. โ€œThe award and the associated finance mechanism via Standard Bank were instrumental,โ€ says Estcourt.ย 

โ€œIt enabled us to repay early-stage funding and significantly expand the scope of the programme. To date, weโ€™ve distributed clean cookstoves to over 950,000 households across rural South Africa, with benefits for both community health and carbon reductions.โ€

TASC cookstoves

Reversing The Effects of Climate Change

TASCโ€™s GRASS project directly tackles the consequences of climate change by restoring degraded rangelands, boosting carbon sequestration, and building long-term resilience for rural communities.ย 

Escourt: โ€œClimate change has significantly reduced the adaptive capacity of farmers, which sees them to increased drought vulnerability, erosion, bare soils, and more extreme weather impacts. GRASS helps reverse these effects by improving water-holding capacity, stabilising soil temperatures, reducing erosion, and increasing biodiversity across hundreds of thousands of hectares.โ€ย 

GRASS is also the worldโ€™s first project registered under Verraโ€™s VM0042 methodology, enabling robust monitoring and the generation of certified carbon credits.ย 

Important opportunity

As the diamond sponsor of the inaugural Carbon Markets Africa Summit in Johannesburg from 22โ€“23 October, TASC is excited to be part of what Estcourt describes as โ€œan important opportunity to bring thought leaders, developers, policymakers, and buyers into one room. Itโ€™s a platform to hopefully accelerate Article 6 readiness, deepen understanding of what high-impact projects look like on the ground, and promote stronger collaboration across the continent.โ€

She continues: โ€œFor buyers, this is your chance to meet developers face-to-face, ask the hard questions, and build real trust in the market. Come and listen to the passion.โ€ย 


VUKA Groupย 

Carbon Markets Africa Summit is organised by VUKA Group, which has more than 20 yearsโ€™ experience in serving the business community across Africa. The United Nations Development Programme (UNDP) is the official host organisation.ย 

Event website: About โ€” Carbon Markets Africa

Event dates and location:
Dates:
21 October: Pre-summit day
22โ€“23 October: Summit
Location: Johannesburg, South Africa

Contact details for Carbon Markets Africa Summit:ย 
Project Lead: Emmanuelle Nichollsย 
Cell: +27 83 447 8410ย ย 
Email:ย emmanuelle.nicholls@wearevuka.comย ย 

Contact details for TASC:
Commercial Director: Dr Storm Patel
Email: storm@tasc.je

PowerBank Corp. (SUUN) Transforms Into Clean Energy Leader with Ontario Battery Storage Deal

Disseminated on behalf of PowerBank Corporation.

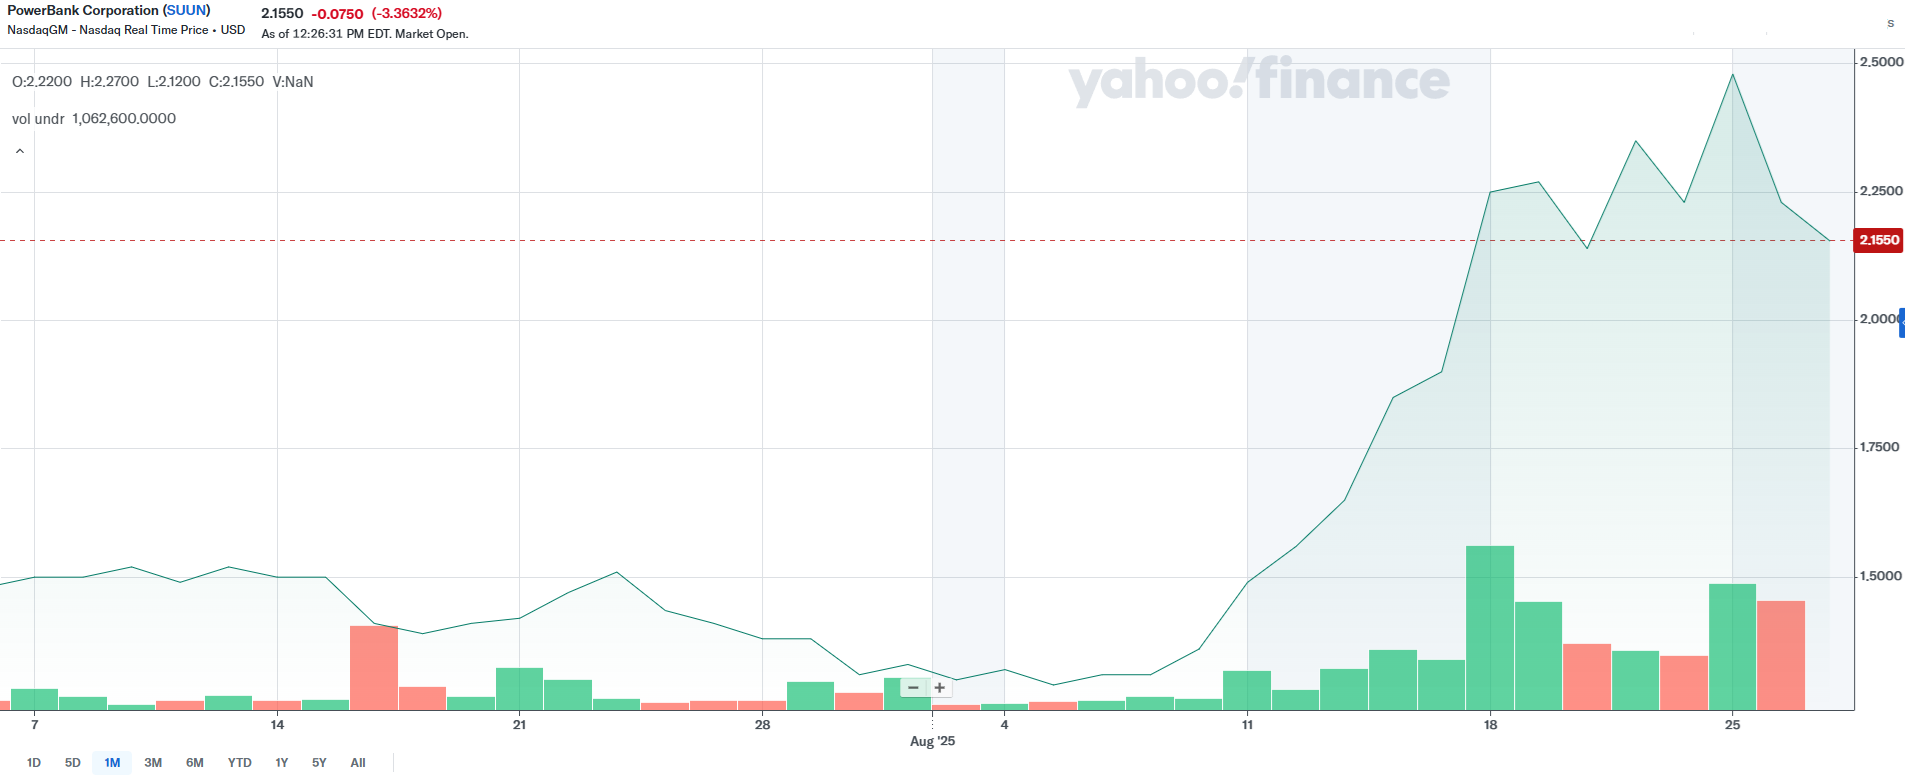
PowerBank Corp. (NASDAQ: SUUN) delivered one of the sharpest moves in the clean-energy space this month. Its stock has rebounded from recent lows. The rally was fueled by a mix of company-specific news and broader clean-energy policy developments.

The increase shows strong interest in PowerBankโ€™s battery storage project in Ontario. It also reflects optimism from updated U.S. clean-energy tax guidance. This news improved sentiment in the entire sector.

Ontario Battery Deal Powers SUUN

A key driver for PowerBank is its battery storage business with its Cramahe, Ontario project known as SFF-06, commencing installation of the battery energy storage system (BESS). The 4.99 megawatt (MW) BESS is backed by a 22-year capacity contract that ensures long-term income once operational.ย 

The contract is priced at $1,221 per megawatt per business day, translating into predictable and stable revenues over two decades.

The project also benefits from a $25.8 million loan from the Royal Bank of Canada (RBC), which covers financing at favorable terms for two projects, including SFF-06. PowerBank also plans to secure the 30% Canada Clean Technology Investment Tax Credit. This will boost the project’s financial profile.

With this move, PowerBank is no longer seen solely as a solar player. Instead, the company is positioning itself as a diversified clean energy infrastructure firm with long-term recurring revenues. For a micro-cap stock often valued on speculation, this shift towards diversified revenue streams is a major milestone.

Analysts Turn Bullish on PowerBankโ€™s Future

Analysts covering PowerBank are turning more bullish after the Ontario news.

PowerBank has a forward price-to-earnings (P/E) ratio of about 17x. This is potentially low when you consider its growth potential. If the company executes its pipeline of projects beyond Ontario, the stock has the potential to re-rate higher. For now, the Ontario project provides a strong foundation for growth.

Clean Energy Tax Policy Tailwinds Lift the Sector

PowerBank is based in Canada, but the company gained from a boost in optimism in the clean energy sector. This came after the U.S. Treasury Department released amended clean energy tax credit rules.

The new rules made it clear that renewable projects can still get a 30% federal tax credit. This applies as long as physical construction starts. They also keep the traditional four-year โ€œsafe harborโ€ provision. This eased concerns that stricter guidance could have limited access to credits.

Following the announcement, major U.S. solar stocks like Sunrun and First Solar jumped nearly 9%, while the MAC Global Solar Energy Index rose 4%. PowerBank itself has a strategy to accelerate the development or sale of projects to ensure that as many projects as possible can qualify for the tax credits.

However, the overall positive vibe for clean energy companies boosted SUUN. Investor confidence in renewable themes appears strong, especially as cross-border opportunities for financing and project expansion remain attractive.

Momentum Meets Volatility in SUUN Stock

PowerBankโ€™s sharp stock increase also reflects technical momentum. The stock is now well above its 200-day moving average, a sign that bullish sentiment could hold. However, traders are watching closely as technical indicators show overbought conditions.

Despite this, the overall momentum trend remains upward. If PowerBank keeps sharing project updates and benefits from optimism in the sector, the stock might hold higher trading ranges.

Battery Storage: The Next Big Clean-Energy Play

PowerBankโ€™s continued development of battery storage projects mirrors a broader industry trend. As renewable energy penetration grows, storage is becoming essential for grid reliability. In Ontario, battery storage supports the provinceโ€™s transition away from natural gas while balancing variable renewable inputs like wind and solar.

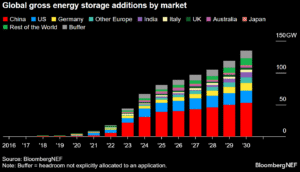
The global energy storage market is set for another record year in 2025. Even with policy shifts and uncertainty in the United States and Chinaโ€”the two biggest marketsโ€”developers are moving ahead with larger utility-scale projects.ย 

Since 2024, huge gigawatt-hour systems have begun construction or been commissioned. This is happening not just in the U.S. and China, but also in Saudi Arabia, South Africa, Australia, the Netherlands, Chile, Canada, and the UK.

global energy storage market 2030 BNEF

BloombergNEF predicts storage additions will increase by 35% in 2025. This will total 94 gigawatts (247 gigawatt-hours), excluding pumped hydro. After this surge, the sector is expected to expand at a compound annual growth rate (CAGR) of 14.7% through 2035. By then, annual installations could hit 220 gigawatts (972 gigawatt-hours), underscoring the marketโ€™s long-term growth potential.

By securing a long-term contract, PowerBank demonstrates it can compete in this high-growth sector. Its ability to secure financing and government incentives also highlights the companyโ€™s ongoing shift from speculative development to structured infrastructure investment.

Investor Watchlist: Whatโ€™s Next for PowerBank

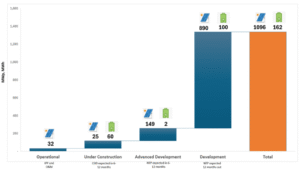
For investors, the Ontario battery storage development is significant because it provides both credibility and visibility into future cash flows. This makes SUUN less of a pure momentum trade and more of a potential long-term clean energy infrastructure play. Below is the companyโ€™s project pipeline, including battery storage at 162 MWh.

Powerbank project pipeline

Going forward, investors will be watching:

  • Execution of the Ontario project, including construction timelines and cash flow ramp-up.
  • Expansion opportunities into other Canadian provinces or U.S. markets.
  • Financing partnerships, particularly whether PowerBank can continue to secure favorable loans and tax incentives.

The supportive backdrop of clean energy policy in both Canada and the U.S. provides further encouragement. If PowerBank matches its Ontario success, it could change from a speculative micro-cap to a credible small-cap clean energy growth story.

The Ontario project strengthens PowerBankโ€™s revenue outlook and aligns the company with global clean energy trends. For investors ready to handle ups and downs, SUUN offers high risk and high reward. It’s a chance in the rapidly expanding clean energy infrastructure market.

There are several risks associated with the development of the Project. The development of any project is subject to required permits, the continued availability of third-party financing arrangements for the Company, the risks associated with the construction of a battery energy storage project and the degradation of battery storage capacity over time based on the number of discharge cycles. In addition, governments may revise, reduce or eliminate incentives and policy support schemes for battery energy storage, which could result in future projects no longer being economic. Please refer to โ€œForward-Looking Statementsโ€ for additional discussion of the assumptions and risk factors associated with the projects and statements made inย  the SolarBank press release dated dated August 6, 2025 entitled: PowerBank (SUUN) Begins Installation of First Battery Energy Storage System in Ontario“.

Carbon Credits Supply to Skyrocket 35x by 2050 – But at What Price?

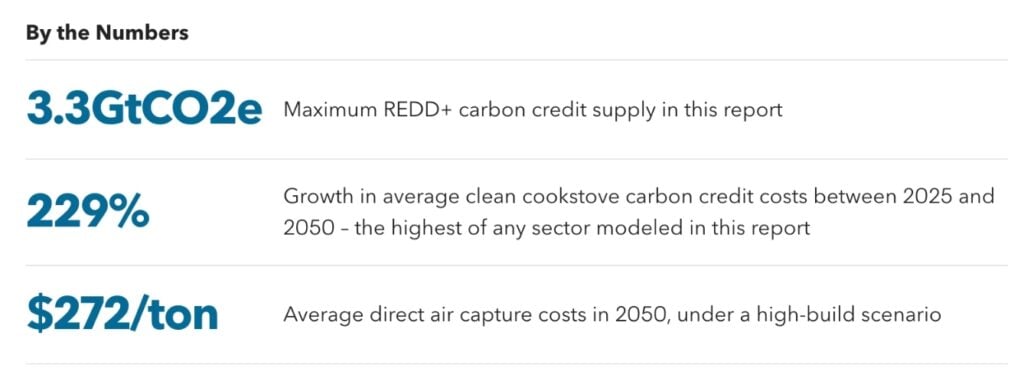
The global carbon market is undergoing a dramatic reset that could transform both supply and costs over the next 25 years. New projections from BloombergNEF (BNEF) ย suggest that carbon credit supply may grow 20- to 35-fold by 2050, creating one of the most significant financial mechanisms for funding decarbonization. But the shape of this future market hinges on integrity, governance, and the types of projects that ultimately win buyersโ€™ trust.

While the long-term trajectory points upward, the road is being shaped by near-term shifts. From surging issuances to a rapid geographic rebalancing, the market reset is already redefining which sectors and regions are taking the lead.

Carbon Credit Costs Head Higher

BNEF further points to steep increases in average costs as high-quality projects dominate. Prices could reach $60 per ton of COโ‚‚e in 2030 and rise to $104 per ton in 2050 if technology-based removals, such as direct air capture (DAC), dominate the supply mix.

In scenarios where lower-quality credits flood the market, prices would remain significantly lowerโ€”just $69 per ton in 2050โ€”but at the cost of weaker governance and reduced impact. This highlights the growing divide between volume-driven growth and integrity-driven supply.

carbon credits
Source: BNEF

Issuances Surge as Market Resets

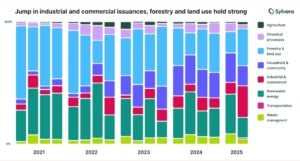
According to Sylvera, new credit creation has picked up pace. In Q2 2025, issuances reached 77 million credits, up 39% from Q1 and 14% higher than Q2 2024. This signals renewed confidence among project developers and buyers, with particular momentum in both traditional land-use projects and industrial breakthroughs.

Nature-Based Leaders Face New Competition

Forestry and Land Use projects still dominate, making up 31% of Q2 issuances. Within this group, Afforestation, Reforestation, and Revegetation (ARR) projects stood out. These credits averaged $24 each, reflecting higher implementation costs and buyersโ€™ willingness to pay for premium, nature-based removals. For higher-rated ARR projects (BBB+), the premium stretched closer to $27, driven by limited supply.

Yet the real story this quarter was the surge in Industrial and Commercial projects, which jumped from 7.9% of issuances in H1 2024 to 19% in H1 2025. These include refrigerant recovery, methane capture from coal mines, and advanced industrial efficiency. Meanwhile, REDD+ projects rebounded strongly, climbing to 16% of Q2 issuances, their highest share since mid-2023.

This diversification shows the market moving beyond forests alone, with industrial innovation gaining ground.

Carbon credits carbon markets
Source: Sylvera

North America Rises as Supply Hub

One of the most striking changes came from geography. North America more than doubled its share of issuances, rising from 21% in Q1 to 43% in Q2. This momentum made the American Carbon Registry (ACR) the top registry for the first time, accounting for 33% of all new credits.

It was followed by Gold Standard (25%) and Verra (21%), signaling a more competitive registry landscape. This shift reflects both investor appetite for high-integrity projects in North America and the regionโ€™s strong regulatory backdrop, which is creating demand for compliance-grade credits.

Cheap vs. Trusted: The Carbon Marketโ€™s Fork in the Road

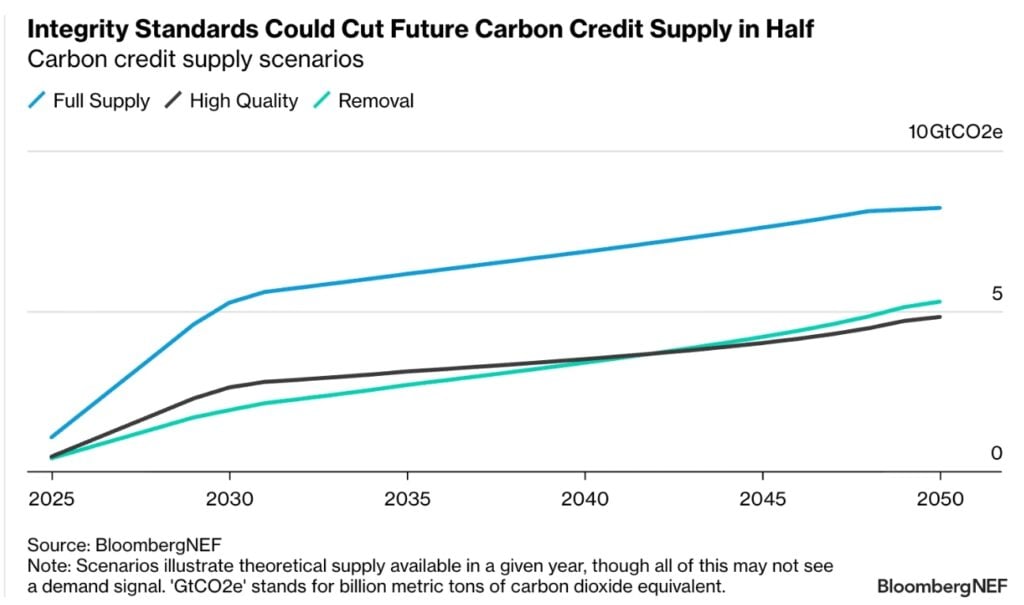
BNEF outlined the possible futures for the global carbon credit market. Carbon credit supply could follow three different paths, shaped by governance, investor trust, and project quality.

  • High-Quality Scenario: If the market reset succeeds, supply reaches 2.6B tons in 2030 and 4.8B in 2050. The market stays smaller but centers on high-impact projects. Direct air capture (DAC) grows to 21% of supply by 2050, with prices averaging $104/ton.
  • Full Supply Scenario: If governance fails, supply surges to 5.3B tons in 2030 and 8.2B in 2050. Most credits come from avoided deforestation and reforestation, about two-thirds of the total. Prices stay low at $69/ton, but quality concerns weaken trust.
  • OTC Carbon Removal Scenario: This middle path sees bespoke deals growing 27 times since 2022. Supply hits 2B tons in 2030 and 5.3B in 2050. Bioenergy with carbon capture (BECCS) dominates, with prices at $98/ton by 2050.

The trade-off: Cheaper credits risk poor quality, while higher-cost, smaller markets could build the trust buyers want.

carbon credit supply
Source: BNEF

Buyers Pay Premium for Integrity

Even as average credit prices softened, buyers continued paying premiums for nature-based removal credits and high-rated projects. For instance, ARR credits rated BBB+ commanded roughly $27 each, compared to lower-rated alternatives.

This price differentiation shows that buyersโ€”especially corporates seeking credible net-zero claimsโ€”are prioritizing quality over volume. Credits recognized in compliance systems or international frameworks also commanded higher prices, reflecting their stronger governance.

Carbon Pricing Expands Across Economies

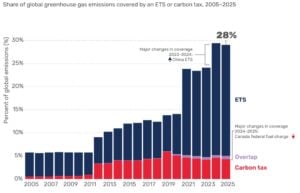
Alongside the voluntary market reset, government-led carbon pricing systems are expanding. As per the World Bank Group, by mid-2025, 43 carbon taxes and 37 emissions trading systems (ETSs) were in place, covering 28% of global emissionsโ€”up from 24% just a year earlier.

Several major moves drove this growth:

  • Chinaโ€™s national ETS expanded beyond power to include cement, steel, and aluminum, adding 3 billion tons of coverage.
  • Colombia broadened its carbon tax to include coal combustion.

Together, these expansions lifted global coverage to nearly 15 billion tons COโ‚‚e, representing two-thirds of global GDP under a direct carbon price.

carbon pricing
Source: World Bank Group

Power Sector Leads, Industry Joins In

The power sector continues to dominate carbon pricing. Over half of global power emissionsโ€”about 30% of global GHGsโ€”are now priced. This matters because electrification of industry and transport can only deliver deep cuts if electricity itself is low-carbon.

Industry is catching up fast. Thanks to Chinaโ€™s ETS expansion, over 40% of industrial emissions are now covered, marking a major leap for one of the most carbon-intensive sectors.

Carbon Markets Channel Private Capital

Despite short-term price softening, demand remains resilient. Corporations remain the biggest buyers through voluntary and domestic compliance markets, viewing credits as essential for net-zero alignment. Global retirements rose in early 2025, driven by a spike in compliance demand.

This reflects carbon marketsโ€™ central role: channeling private capital into decarbonization projects while governments pursue broader policy goals like economic development, job creation, and fiscal stability.

The Political Economy of Pricing

The durability of carbon pricing depends not just on policy design but also on public sentiment and perceived fairness. Governments are balancing competing goalsโ€”emissions cuts, economic growth, and equity. As seen with China and Colombia, systems are being designed to ratchet up coverage and ambition over time, offering flexibility while building acceptance.

This political economy lens will be crucial as carbon pricing moves into harder-to-abate sectors like heavy industry and as middle-income economies such as Brazil, India, Indonesia, and Tรผrkiye expand their systems.

Outlook: Carbon Market Integrity Over Volume

The global carbon market is no longer defined by raw volume. Instead, the reset since 2022 has pushed integrity to the forefront. Whether through nature-based solutions, industrial projects, or advanced removals, the projects that deliver measurable, durable impact will attract the highest demand and premiums.

Whatโ€™s clear from BNEF’s forecast on carbon credits supply is that carbon markets will remain a cornerstone of climate finance, one where buyers, governments, and investors increasingly value quality over quantity.

U.S. Releases New Draft Critical Minerals List: Silver and Copper Join the Clean Energy Race

The United States has released an updated list of critical minerals, highlighting the growing importance of metals that support clean energy, technology, and national security. This new list from the U.S. Geological Survey (USGS) and the Department of the Interior now has 51 minerals.

The draft recommends adding six mineralsโ€”potash, silicon, copper, silver, rhenium, and lead, listed in order of riskโ€”to the U.S. Critical Minerals List, while removing two minerals, arsenic and tellurium.

Silver and copper are included for the first time. The update shows how crucial these resources are for America’s industrial and clean energy plans. Both metals are in high demand for renewable energy systems, electric vehicles, and advanced electronics.

The U.S. wants to expand the list to boost supply security, cut down on imports, and get ready for global competition over these resources.

Why the U.S. Updates Its Critical Minerals List

Critical minerals are defined as non-fuel minerals that are vital to the U.S. economy and security but are at risk of supply disruptions. The U.S. first released a formal list in 2018, and it has been updated several times as global demand and geopolitical risks shift.

The 2025 update considers several factors, including:

  • Economic importance: Minerals are essential for industries like defense, energy, and technology.
  • Supply chain risks: The potential for shortages due to import dependence or geopolitical tensions.
  • Future demand: Projected growth in renewable energy and electric vehicle markets.

Silver and copper were added because new data show their strategic role in clean energy. Both metals are widely available globally, but demand is increasing so quickly that supply risks are now more relevant.

This update highlights how the U.S. is adjusting its policies to keep pace with the global race for minerals.

Silver: A Rising Star in the Energy Transition

Silverโ€™s addition to the list is significant. Traditionally known as a precious metal, silver is also one of the most effective conductors of electricity. This property makes it essential for solar panels, batteries, and electronics.

  • Solar panels: Silver paste is used in photovoltaic cells to conduct electricity. Each panel requires 15โ€“20 grams of silver, and global solar demand is expected to drive record use.
  • Electronics: From smartphones to electric vehicles, silver is a critical component in circuit boards and electrical connections.
  • Medical uses: Silverโ€™s antimicrobial properties also make it valuable for healthcare applications.

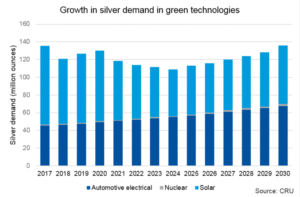
According to the Silver Institute, solar energy alone could account for nearly half of silverโ€™s industrial demand by 2030. However, global mine supply has been relatively flat, creating concerns about shortages.

silver demand from solar 2030
Source: Silver Institute

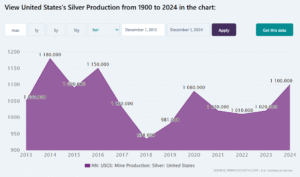
By adding silver to the list, U.S. policymakers recognize the growing risk of relying too heavily on foreign sources. While the U.S. produces some silver, much of the supply comes from countries like Mexico, Peru, and China. This creates potential vulnerabilities as clean energy deployment accelerates.

United States's Silver Production from 1900 to 2024 in the chart
Source: CEIC Data

Copper: The Backbone of Electrification

Copper is another critical addition to the 2025 list. Known as the โ€œmetal of electrification,โ€ copper is vital for power grids, renewable energy, electric vehicles, and data centers.

  • Electric vehicles (EVs): EVs require up to four times more copper than gasoline-powered cars, mainly for batteries and wiring.
  • Power grids: Copper is a key material in transmission lines, transformers, and substations. Expanding renewable energy capacity depends on copper-intensive infrastructure.
  • Clean energy: Wind turbines and solar farms use large amounts of copper in their electrical systems.

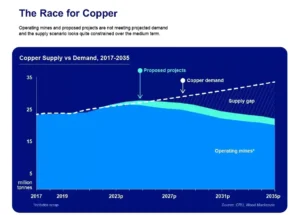
Global demand for copper is projected to double by 2035, according to industry forecasts. Yet, mining capacity has struggled to keep pace. Large new projects take years to develop, and permitting challenges in the U.S. have slowed growth.

copper supply and demand
Source: CRU, Wood Mackenzie

The U.S. currently imports a significant share of its copper, with major suppliers including Chile and Canada. The government calls copper a critical mineral. This signals a plan to boost domestic production and recycling. The goal is to reduce reliance on imports.

Broader Implications of the Critical Minerals List

The new list does more than identify resources; it also influences U.S. policy and investment. Minerals on the list qualify for government programs that support domestic exploration, mining, and processing. This can include federal funding, streamlined permitting, and public-private partnerships.

For companies, being linked to critical minerals often boosts investor interest. It signals long-term demand and potential access to U.S. government support. U.S. mining firms looking for silver and copper deposits could find more financing options.

The updated list also affects international trade. By focusing on these resources, the U.S. can form new partnerships with allies that have rich mineral reserves. This move also helps cut down reliance on countries with high supply risks.

Adding silver and copper to the critical minerals list is more than just a policy shift. It impacts markets, industries, and climate goals directly. Knowing how these metals influence clean energy and tech development shows why the update is important.

The Global Race for Silver and Copper

The U.S. is not alone in its push to secure mineral supplies. The European Union, Japan, and China are updating their plans. They want to secure steady access to silver, copper, and other key resources.

  • China: A dominant player in mineral refining and processing, especially for copper and rare earths. By 2025, China is set to produce 57% of the worldโ€™s refined copper. Its output is expected to rise by 7.5% to 12% each year, despite global copper shortages. China also leads in copper smelting and refining. Since 2019, it has added over 97% of the global capacity.
  • Europe: The region recycles around 37% of the world’s silver. This is much higher than its primary silver production, which is only about 7%. Most of that production comes from Poland and Sweden. In Europe, up to 90% of copper in buildings and infrastructure is recycled. This highlights the importance of reuse and circular economy initiatives.
  • Global supply: Silver and copper mining is concentrated in a few countries, such as China, Peru, Chile, and the DRC, raising concerns about bottlenecks.

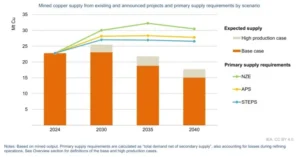
As countries accelerate clean energy goals, competition for these metals is expected to grow. Some analysts warn of a potential supply gap in copper as early as 2030 if new projects do not come online quickly enough.

copper supply forecast IEA
Source: IEA

Mining, Recycling, and the Green Dilemma

While expanding mining is a logical solution to supply risks, it comes with challenges. Mining projects often raise environmental and social concerns, including water use, land disturbance, and impacts on local communities.

In the U.S., new projects frequently face delays due to permitting and opposition. Balancing the need for secure supply with environmental protections will remain a key challenge. Recycling may help close the gap, but new production will still be required.

The recognition of silver and copper as critical minerals reflects these trade-offs. Policymakers see the environmental challenges. They believe that securing supply is key to economic and climate goals.

Looking Ahead: U.S. Strategy for a Mineral-Driven Future

The updated critical minerals list reveals how the U.S. is getting ready for a future focused on clean energy, electrification, and digital technologies. Silver and copper are now seen not only as industrial metals but as pillars of energy security.

Moving forward, the U.S. will likely expand efforts to:

  • Support domestic mining and refining of silver and copper.
  • Increase recycling and circular economy solutions.
  • Build alliances with mineral-rich countries.
  • Balance environmental concerns with supply needs.

By naming silver and copper as critical, the U.S. is aligning its resource strategy with long-term economic and climate goals. The next decade will determine whether the country can secure enough of these essential metals to stay competitive in the global energy transition.

NIO Stock Surges 45%: Battery Swaps, SUVs, and a Net-Zero Drive

NIO stock has surged 45% in 2025 as strong SUV launches, record deliveries, and a growing battery swap network fuel investor optimism. The Chinese EV maker is moving forward on its net-zero roadmap. It focuses on renewable energy, green factories, and smart partnerships. This strategy helps it become a global leader in sustainable mobility.

Stock Ride: From Slump to Surge

Investor confidence in NIO has seen a notable rebound recently. The stock jumped after JPMorgan upgraded it.ย They raised NIO’s stock price target from $4.10 to $4.80 but kept a “Neutral” rating.

NIO stock price
Source: Yahoo Finance

JPMorgan also raised its delivery forecasts for 2026 and 2027 by 11โ€“13%. This change reflects higher volume expectations from NIOโ€™s new L90 and L80 SUV launches. This analyst upgrade gave the stock fresh momentum, helping push shares significantly higher.

The company boosted bullish sentiment by launching the ES8 SUV. This model offers six and seven seats and is priced at about US $43,000. It also includes a battery subscription option.

The combination of JPMorganโ€™s optimism and excitement around the ES8 launch lifted NIOโ€™s shares by about 45% year to date.

Q2 Outlook: Deliveries on Overdrive

Looking ahead to Q2, NIO projected deliveries between 72,000 and 75,000 vehicles, which would mark growth of 25% to 31% year-over-year. In June alone, deliveries reached 24,925 units โ€” an over 17% year-over-year increase.

In total, NIO delivered 72,056 vehicles in Q2, lifting its cumulative deliveries to more than 785,700 as of June 30, 2025. These results underscore strong demand momentum across its growing lineup.

Moving Toward Net-Zero: Battery Swaps, Renewables, and Efficiency

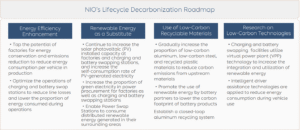
NIO continues to champion sustainability through innovation and cleaner operations. The company plans to achieve carbon neutrality in its operations and supply chain by 2045. This goal is backed by a clear Lifecycle Decarbonization Roadmap.

NIOโ€™s Lifecycle Decarbonization Roadmap
Source: Nio

It boosted its renewable electricity usage to 56.6% in 2024, a 74% increase from last year. Plus, one factory received the โ€œ2024 Green Factoryโ€ award.

NIO factories cut emissions per vehicle by 12%. This shows the company’s progress in making manufacturing more efficient.ย However, the companyโ€™s most striking contribution to emissions reduction comes from its battery swap infrastructure.

Battery Swaps: NIOโ€™s Secret Weapon

Battery swapping brings speed, convenience, and eco-benefits, with NIO leading global deployment. Here are the key facts of the company’s achievements so far:ย 

  • As of mid-2025, NIO operates over 3,400 Power Swap Stations globally, including more than 3,200 in China and 50+ in Europe. The company plans to reach 1,000 stations outside China by year-end.
  • The network has completed 80 million total swaps, averaging 97,000 swaps per day. Each swap-equipped station powers two million homes each year. It also saves users over 2,900 hours of charging time and around US$2.9 billion in energy costs.
  • In Chongqing alone, 75 stations now cover every district and county, facilitating over one million swaps. These stations serve as virtual power plants, balancing the grid and integrating renewables in dense urban areas.

This approach enhances user convenience while transforming EV infrastructure into a scalable, low-carbon solution.ย By late 2023, the network completed 30 million swaps. This saved about 891,700 metric tons of COโ‚‚. Thatโ€™s roughly 28 kilograms of COโ‚‚ for each swap. Itโ€™s like avoiding 80 kilometers of emissions from gas cars per swap.

Powering Up with CATL Partnerships

NIOโ€™s collaboration with industry partners amplifies its eco-impact, further aiding in its huge stock jump. In March 2025, NIO formed a key partnership with battery leader CATL. This deal includes an investment of up to US$346 million.

They will also work together on battery-swapping standards and infrastructure. Through this alliance, NIO aims to establish the largest battery swap network in China, covering over 2,300 county-level areas.

CATL is negotiating to buy a controlling stake in NIO Power, the unit that manages charging and swapping networks. This move supports CATLโ€™s focus on green energy solutions.ย These collaborations help NIO reduce costs, scale infrastructure faster, and integrate best-in-class technology across its ecosystem.

SUVs, Hatchbacks, and Global Reach

NIOโ€™s ambitions extend beyond flagship models. New releases โ€” including the ES8 SUV and the compact hatchback Firefly โ€” signal a push into broader market segments.

Firefly deliveries started in April. In May, NIO sold 3,680 units. They are also set to launch in 16 new markets across five continents through third-party dealers. Rising demand from the ONVO and Firefly lines also fueled a 53% year-over-year jump in April deliveries.

This multi-brand strategy provides flexibility to reach both premium and mass-market buyers โ€” a key element for long-term growth and profitability.

Why ESG Goals Drive Investor Interest

NIO combines its profits, product plans, and sustainability goals into a future-oriented business model. The battery swap ecosystem reduces lifecycle emissions, enhances user convenience, and demonstrates progress toward net-zero goals.

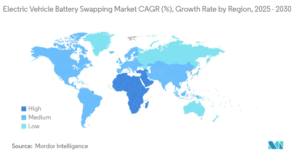
The global EV battery swapping market is valued at about US$1.62 billion in 2025. It is expected to reach US$5.93 billion by 2030, showing a strong annual growth rate of 29.7%. The forecast below shows the regions where growth will be high and low.

EV battery swapping market

Another forecast anticipates an even broader expansionโ€”from US$2.5 billion in 2024 to an astounding US$91.3 billion by 2034. These figures highlight a surging demand for fast, reliable EV charging alternatives.

In China, the ecosystem continues to expand rapidly. CATL will build 1,000 new swap stations in 2025. They aim to expand to 10,000 stations by 2028. This is part of their investment in fast and scalable EV infrastructure.

Nioโ€™s renewable energy use and recognition for green manufacturing show that it is turning promises into results. Its global presence and partnerships extend this vision, with ESG initiatives spanning clean manufacturing, circular design, and active engagement in global climate forums. These moves strengthen its appeal to both environmentally minded investors and policymakers.

Balancing Losses with Long-Term Growth

NIOโ€™s path forward sits at the intersection of growth and green innovation. Strong delivery numbers and better margins give it momentum. Also, the stock’s 40%+ rise in 2025 shows that investors support Nio’s growing model lineup and ESG investments.

Still, the company faces hurdles. NIO faces deep losses and strict pricing rules. So, it must focus on controlling costs and maintaining sustainable margins. Analysts predict adjusted operational profits by Q4 2025. However, full-year profits could take years to achieve.

NIO continues to blur lines between mobility, technology, and climate action. Its upcoming Q2 earnings will shed more light on revenue trends and delivery outlooks.

As the company grows its battery swap network and global reach, it can strengthen its position in clean technology and compete better in the mass-market EV sector. Thanks to its sustainability gains, investor confidence, and product innovation, NIO stands out as an EV maker aligning financial progress with real climate ambition.

Worldโ€™s First Commercial CCS Plant Owned by Shell, Equinor, and TotalEnergies Injects CO2 in North Sea

Norway has opened the worldโ€™s first commercial-scale carbon capture and storage (CCS) facility, marking a turning point in global climate action. The project captures carbon dioxide (COโ‚‚) emissions from a cement plant and stores them deep beneath the seabed in the North Sea. This is the first time a CCS project has been built and operated with a complete value chain: capture, transport, and permanent storage.

The facility, known as the Northern Lights, is part of Norwayโ€™s Longship initiative. This $3.4 billion program aims to prove that carbon capture can go beyond pilot projects and become commercially viable.

Shell, Equinor, and TotalEnergies owned the CCS plant. By proving the technology works at this level, Norway hopes to inspire other nations and industries to follow.

Transitioning from small demonstration projects to full-scale deployment is significant. Cement, steel, and chemical production are tough to decarbonize. CCS is one of the few methods that can directly reduce the industry’s emissions.

Norwayโ€™s success provides a real-world example that these industries can lower their carbon footprint without shutting down production. CEO of Equinor, Anders Opedal, remarked:ย 

“With CO2 safely stored below the seabed, we mark a major milestone. This demonstrates the viability of carbon capture, transport, and storage as a scalable industry. With the support from the Norwegian government and in close collaboration with our partners, we have successfully transformed this project from concept to reality.”

Beneath the North Sea: How COโ‚‚ Is Locked Away

The captured COโ‚‚ comes from the Brevik cement plant in southern Norway, operated by Heidelberg Materials. Cement production is a major emitter because COโ‚‚ is released both from burning fuel and from the chemical process of turning limestone into clinker, the key ingredient in cement.

At Brevik, the gas is captured using a chemical process with amines that separate COโ‚‚ from other gases. Once purified, the COโ‚‚ is cooled and compressed into liquid form.

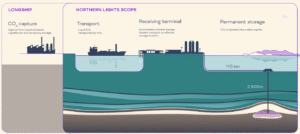
Special ships then transport the liquefied gas to the Northern Lights terminal on Norwayโ€™s west coast. From there, it is pumped through pipelines into a geological formation about 2,600 meters beneath the seabed.

Northern Lights CCS project scope
Source: Northern Lights

This deep saline aquifer, a porous rock layer sealed by thick caprock, ensures the COโ‚‚ stays underground permanently. Geologists have studied the area for decades, and monitoring systems are in place to track the stored gas. The technology is designed to provide long-term security, with storage capacity estimated to last for hundreds of years.

What This Means for Carbon Storage

The projectโ€™s first phase can handle 1.5 million metric tons of COโ‚‚ per year, already fully booked by customers. Phase two, planned in the coming years, aims to expand that capacity to 5 million tons annually.

For perspective, 5 million tons of COโ‚‚ equals the annual emissions of about 2.5 million cars. While this is still a fraction of Europeโ€™s total emissions, it shows how large-scale CCS can make a measurable impact.

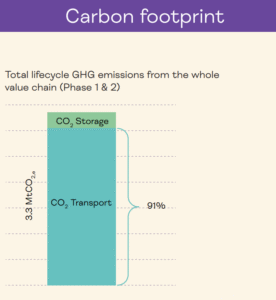
The CCS project will store 127.8 million tonnes of COโ‚‚ over its lifetime. It will emit only 3.3 million tonnes of COโ‚‚e throughout its entire process, which includes capture, transport, and storage. This results in a net abatement rate of 97.4%. That means almost all the COโ‚‚ captured is stored permanently and not released back into the atmosphere.

Carbon footprint of the Northern Lights JV
Source: Northern Lights

Many companies in Europe have agreed to use the Northern Lights system. This includes fertilizer makers, energy firms, and district heating providers. Interest is growing quickly, as industries see CCS as a way to meet tightening climate targets while continuing production.

The Brevik cement plant itself will capture about 400,000 tons of COโ‚‚ per year, equal to half of its annual emissions. This captured carbon will flow directly into the Northern Lights storage system.

Heidelberg Materials will sell a special product named โ€œevoZero.โ€ Itโ€™s marketed as net-zero cement, made possible by CCS. All 2025 production has already been pre-sold, showing strong customer demand for low-carbon building materials.

Why It Matters for Hard-to-Decarbonize Industries

Cement, steel, and chemicals account for about 30% of global industrial emissions. These sectors are considered โ€œhard-to-abateโ€ because their emissions come from chemical reactions and processes, not just from burning fossil fuels. Switching to renewable electricity alone cannot eliminate them.

Cement production alone contributes nearly 8% of global COโ‚‚ emissions. With global infrastructure demand rising, the sector cannot simply stop producing. That is why CCS is seen as one of the only practical solutions for cutting emissions while keeping production steady.

Billions in Backing: The Role of Public Funding

The facility is backed heavily by the Norwegian government, which provided $2.2 billion in subsidies for its first 10 years of operation. This covers nearly two-thirds of the total cost. Government support was critical to getting the project off the ground because CCS remains more expensive than simply emitting COโ‚‚.

Critics argue that CCS will not scale without either higher carbon prices or continued government subsidies. At todayโ€™s carbon prices in Europeโ€”around โ‚ฌ60 to โ‚ฌ80 per tonโ€”the economics are still challenging. However, as technology improves and facilities grow, costs may fall.

Norway also sees this investment as a long-term opportunity. The country aims to be Europeโ€™s โ€œcarbon storage hubโ€ by creating the first complete CCS value chain. This will allow it to offer storage services to nations and industries that need them.

CCS on the Rise: Global Market Outlook

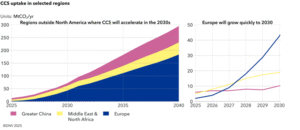
Globally, CCS capacity is still very small. As of 2024, about 50 million tons of COโ‚‚ were captured worldwide each year, according to the International Energy Agency. To meet net-zero targets, this number needs to grow to more than 1 billion tons per year by 2030, and to several billion by 2050.

Several other large projects are under development. In the United States, the Inflation Reduction Act provides tax credits for CCS, spurring dozens of projects across the Midwest and Gulf Coast. The European Union also supports CCS as part of its Green Deal Industrial Plan, providing funding and regulatory support.

DNV_CCS_forecast_2050_CCS_uptake_in_selected_regions
Source: DNV

Analysts expect the global CCS market to reach a value of $10โ€“15 billion annually by 2030, with steady growth beyond that. Cement, steel, and power generation would be the largest users. Shipping and aviation, which face limits on electrification, may also turn to CCS for synthetic fuels.

Companies are also exploring how CCS can pair with carbon dioxide removal (CDR), such as bioenergy with CCS (BECCS) and direct air capture (DAC). These technologies not only prevent new emissions but also remove existing COโ‚‚ from the atmosphere. Norwayโ€™s Northern Lights project could eventually serve as a storage hub for such methods.

Hurdles Ahead: Can CCS Scale Fast Enough?

Despite its promise, CCS faces challenges. The technology is expensive, requires large-scale infrastructure, and depends on public acceptance of storing COโ‚‚ underground. Environmental groups warn of risks, but studies over decades show the storage process is safe.

Another challenge is ensuring CCS does not delay the transition to renewables. Some critics worry that industries may use CCS as an excuse to keep burning fossil fuels longer. A Stanford University professor of environmental engineering, Mark Jacobson, stated in an interview:ย 

“You have to think about who’s proposing this technology. Who stands to benefit from carbon capture and direct air capture? It’s the fossil-fuel companies…They’re just saying, ‘Well, we’re extracting as much CO2 as we’re emitting. Therefore, we should be allowed to keep polluting, keep mining.”

Supporters argue that it should complement, not replace, clean energy deployment. Norwayโ€™s project is an important proof of concept. If it succeeds commercially, it could encourage similar hubs in the United Kingdom, the Netherlands, and the United States.ย 

The launch of the Northern Lights facility shows that CCS is moving from theory to practice. With capture, transport, and storage now working at scale, it represents a breakthrough in reducing industrial emissions.

Chinaโ€™s Clean Energy Cuts Emissions 1%, But Coal and Industry Cast a Shadow

China has two main trends: rapid clean energy growth and shifts in heavy industry that hurt air quality. A new report from the Centre for Research on Energy and Clean Air (CREA) shows emissions have decreased. But relocating industries is creating new pollution problems in areas that were once clean.

Chinaโ€™s Solar Power Drives Emissions Down

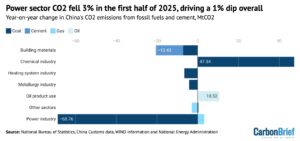
The first half of 2025 marked a positive change for Chinaโ€™s climate efforts. Carbon dioxide emissions fell about 1% year-on-year, the first sustained decline since the pandemic. This progress came mainly from clean energy growth.

China emissions
Source: Carbon Brief
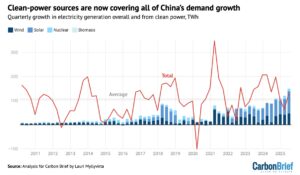
  • Solar, wind, and nuclear energy produced an extra 270 terawatt hours (TWh) of electricity. This not only met the 170 TWh rise in demand but also cut fossil fuel use.
China clean energy
Source: Carbon Brief

Solar stood out with 170 TWhโ€”equivalent to the annual output of Mexico or Turkey. Wind added 80 TWh, and nuclear contributed 20 TWh, while hydropower declined due to lower rainfall.

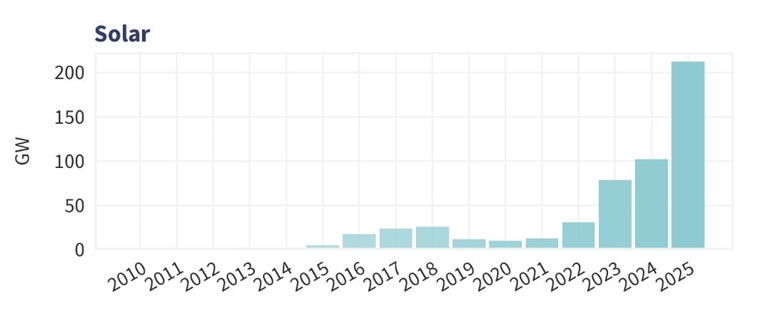
Now, low-carbon sources make up 40% of Chinaโ€™s electricity mix, up from 36% in early 2024. Rapid solar growth means 2025 could break records. It might add 212 gigawatts (GW) in just six months, right before a mid-year policy change. This surge makes solar the main driver of Chinaโ€™s emissions decline.

As a result, emissions from the power sectorโ€”the largest COโ‚‚ sourceโ€”fell by 3% compared to last year.

China solar
Source: CREA

Cleaner Air, But Regional Disparities

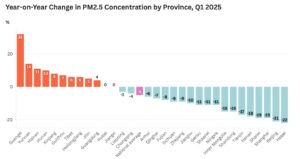
Air quality improved across the country. Fine particulate matter (PM2.5) fell by 5% year-on-year. Other pollutants, such as sulfur dioxide and nitrogen dioxide, either decreased or stayed the same.

However, improvements weren’t uniform. Western provinces faced stark contrasts. Guangxi saw PM2.5 levels soar by 32%, Yunnan by 14%, and Xinjiang by 8%. Unlike past spikes from weather, CREA found these increases stemmed from structural growth in emissions.

This rise is tied to relocating heavy industry westward, along with local factors like sandstorms and biomass burning. Regions once seen as safe from pollution are now emerging as new challenges for Chinaโ€™s air quality.

china emissions
Source: CREA

A Seasonal Double Threat

Even where pollution decreased, China faces a “two-season problem.” Winter smog is driven by coal use for heating and industry. Average national PM2.5 levels exceeded the official standard by 18%, with nearly three-quarters of provinces not meeting compliance goals.

In summer, ozone becomes the main issue. Unlike PM2.5, which declined, ozone pollution rose by 4% over the past year. This has become a significant challenge for Chinaโ€™s air quality policies. The mix of winter smog and summer ozone highlights the need for more adaptable governance.

Industry Moves West, Pollution Follows

The westward shift in industry is the main cause of rising pollution in inland regions. Provinces once seen as minor players in heavy manufacturing are now reporting sharp growth in steel, metals, and chemical production. Pig iron output rose over 10%, crude steel by nearly 6%, and non-ferrous metals by more than 4% in the first half of 2025.

Much of this growth relies on traditional, coal-heavy methods. Coal-based steelmaking and conventional coal chemical industries still dominate, offsetting gains from cleaner power elsewhere. As a result, polluted days are becoming more common in inland regions like Ningxia, Shanxi, and Hubei.

These trends show that industrial relocation is shifting not just jobs but also pollution from east to west.

Coal Still Impacts Chinaโ€™s Energy Transition

Coal remains a significant concern. Although coal-fired electricity generation has decreased, new coal plants are still being added rapidly. CREA estimates that coal power capacity could increase by 80 to 100 GW in 2025, setting a new record.

The coal-to-chemicals sector is another fast-growing source of emissions. Coal use for synthetic fuels and chemicals grew by 20% in the first half of the year. Since 2020, this sector has contributed 3% to Chinaโ€™s overall COโ‚‚ emissions, with projections showing it could add another 2% by 2029.

Lauri Myllyvirta, lead analyst at the Centre for Research on Energy and Clean Air and senior fellow at Asia Society Policy Institute, shared in the guest post for Carbon Brief that, in 2024, this sector consumed 390 million tonnes of coal and emitted about 690 million tonnes of COโ‚‚. It’s 6% of the countryโ€™s fossil emissions and nearly 10% of total coal use.

This expansion complicates Chinaโ€™s goal to peak emissions before 2030 and reach net zero by 2060.

Policy Needs to Catch Up

CREAโ€™s analysis shows that Chinaโ€™s air quality efforts focus mainly on eastern “key control zones.” These areas were the first to face pollution challenges. In contrast, western and central provinces, where industry is expanding quickly, do not receive the same oversight, funding, or enforcement.

This creates a dangerous policy gap. Without stronger frameworks, pollution could simply shift inland, undermining national progress. CREA further recommends that the upcoming 15th Five-Year Plan (2026โ€“2030) broaden air quality policies to fully include western and central regions, with specific targets and monitoring.

Stronger environmental assessments for new industrial projects, especially in coal-heavy sectors, could help prevent cumulative risks. At the same time, clean energy deployment and industrial electrification need to accelerate in coal-dependent provinces, supported by fiscal incentives and grid investment.

Missed Targets Increase Pressure

Despite the emissions drop this year, China is likely to miss several 2025 climate goals. These include reducing carbon intensity, curbing coal growth, and increasing the share of electric-arc steelmaking. This shortfall will heighten pressure on Chinaโ€™s next nationally determined contribution (NDC) for 2035 and its new five-year plan.

The good news is that the declining emissions trend, driven by solar growth, could inspire policymakers to set stronger goals. This trend shows that large-scale clean power expansion can slow and even reverse emissions growth.

The Road Ahead

Chinaโ€™s 2025 path shows a dual transition. Record solar growth and lower emissions indicate clean energy’s impact. Yet, pollution is moving west, ozone levels are rising, and coal-heavy industries keep expanding.

The coming years will reveal if China can close this gap. It must ensure that national progress isnโ€™t slowed by regional issues. If air quality protections expand inland and clean energy surpasses fossil fuels, China could make lasting climate gains. Currently, its clean energy boom occurs alongside an industrial shift that may only move the pollution problem elsewhere.

Sasolโ€™s (SSL) Stock Rises on Profits, Carbon Credit Surge, and Net-Zero Push

Sasol Ltd., a South African energy and chemicals firm, is gaining attention. They reported stronger earnings and are shifting their strategy to buy more carbon credits. The move comes as the company, the second-biggest emitter of greenhouse gases in the region, boosts coal production and grows its renewable energy portfolio.

Investors, regulators, and climate observers are watching closely to see how Sasol balances its reliance on fossil fuels with its stated commitment to reaching net-zero emissions.

Earnings Power: Fueling a Dual Strategy

In its latest earnings report, Sasol posted a year-on-year improvement supported by stable product prices and efficiency gains. The companyโ€™s operating profit rose due to stronger chemical sales.

However, this was partly offset by higher costs in its coal division. Earnings were strong, giving Sasol the money to invest in fossil fuels and low-carbon projects.

For the fiscal year ending June 30, the company earned 10.60 rand per share. This is a turnaround from a loss of 69.94 rand per share. Asset write-downs fell sharply to 20.7 billion rand, down from 74.9 billion rand last year.

Sasol gained from a 4.3 billion rand settlement with Transnet over oil transport fees. Capital expenditure dropped 16% to 25.4 billion rand. This helped improve the companyโ€™s financial profile.

Management highlighted that a resilient balance sheet is critical as the company continues its transition journey.

Sasol has steady cash flows. This helps support its short-term coal operations. It also funds longer-term projects like renewable energy growth and carbon reduction efforts.

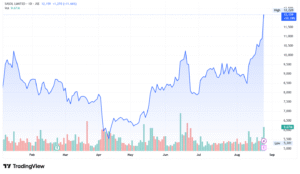
Sasolโ€™s renewed profit helped lift investor sentiment. Following the earnings, the companyโ€™s shares climbed 7% in pre-market trading. Its stock on the Johannesburg Stock Exchange (JSE: SOL) surged by 44% over the last quarter.

Sasol SSL stock

Analysts predict that earnings per share will increase by 20% year-on-year. This shows rising confidence in the company’s ability to balance profit and sustainability.

Rising Carbon Credit Purchases: Flexibility or Delay?

One of the biggest headlines is Sasolโ€™s decision to boost its purchase of carbon credits.

  • In the fiscal year that ended in June 2025, Sasol’s carbon credit purchases increased to R723 million, a 25% increase year-on-year.
  • This amount was nearly triple the value of the credits it bought in 2023.
  • Since 2019, Sasol has acquired more than 11 million South African carbon credits, which has reduced its carbon tax liability by more than R650 million.

Most of these credits come from international renewable energy and reforestation projects, while some are linked to African-based carbon offset programs. Sasol plans to grow its carbon credit portfolio, showing its commitment to climate responsibility.

Some offset projects supported by Sasol include:
  • Wonderbag:ย In 2021, Sasol announced it would use carbon credits generated by the Wonderbag project, which provides non-electric heat-retention cookers to reduce household emissions.
  • Bethlehem Hydro:ย In 2020, Sasol purchased over 100,000 credits from Bethlehem Hydro, a 7MW hydropower plant that was the first Independent Power Producer in South Africa.
  • Nitrous oxide abatement:ย As far back as 2007, Sasol received credits for a nitrous oxide abatement project at its nitric acid plants in Sasolburg and Secunda.

However, it recognizes that cutting emissions from its own operations is tough in the near term. The company plans to steadily increase reliance, but acknowledges that credits are a temporary solution.

The use of credits has generated debate. Supporters say it gives companies flexibility to meet interim targets while low-carbon technologies scale.

Critics argue it can delay direct emissions cuts. Sasol’s growing use of offsets shows the urgent climate pressures and the challenges of moving away from coal.

Coalโ€™s Grip: South Africaโ€™s Energy Dilemma

Sasol is one of South Africa’s top coal users. It relies on coal for power and to make synthetic fuels and chemicals. Its Secunda plant is one of the single largest point sources of carbon dioxide globally, emitting more than 56 million tons of COโ‚‚ equivalent each year.ย 

The worldโ€™s biggest producer of fuels and chemicals from coal emits around 63 million tons of COโ‚‚ equivalent each year. This makes it one of Africa’s largest industrial polluters.

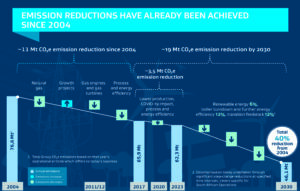
Sasol emission reductions 2023
Source: Sasol

The company believes coal is still essential for South Africaโ€™s energy and industry right now. This is especially true due to the countryโ€™s electricity shortages and its dependence on Eskom, the state utility. Sasol knows that relying on this can lead to risks such as regulatory pressure, investor scrutiny, and possible costs from future carbon pricing.

Counting Carbon: Sasolโ€™s Net-Zero Targets and Progress

Despite its coal footprint, Sasol has stepped up efforts to diversify its energy mix. The company is putting money into renewable energy projects. This includes solar and wind farms. These efforts will help provide cleaner electricity for its operations.

Moreover, partnerships with independent power producers are helping Sasol shift portions of its energy use away from coal-generated power.

In addition, Sasol is advancing work in green hydrogen and sustainable aviation fuel (SAF). Its Fischer-Tropsch technology, long used for coal-to-liquids production, is being adapted for cleaner feedstocks, such as natural gas and green hydrogen. The company announced pilot projects to produce low-carbon chemicals for local and global markets.

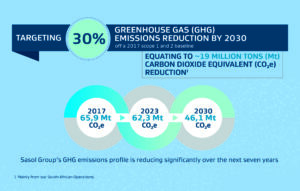
Sasol aims to cut its Scope 1 and 2 emissions by 30% by 2030. This goal uses a 2017 baseline, which is about 72 million tons of COโ‚‚e. Progress: current emissions are down about 13% from baseline.

Sasol net zero roadmap
Source: Sasol

It aims for net-zero emissions by 2050. However, it admits that success relies on policy support, technological progress, and available funding.

In summary, Sasolโ€™s key emission reduction initiatives are:

  • Green hydrogen projects โ€“ Developing hydrogen production in South Africa through partnerships to support cleaner fuels and power.

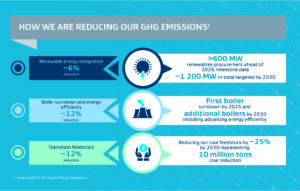
  • Renewable energy procurement โ€“ Securing up to 1,200 MW of renewable electricity (wind and solar) to replace coal-based power at operations.

  • Energy efficiency improvements โ€“ Implementing process optimization and equipment upgrades to reduce energy use across its facilities.

  • Coal-to-gas transition โ€“ Shifting part of its feedstock mix from coal toward natural gas, which has a lower carbon footprint.

  • Carbon capture and utilization (CCU) โ€“ Exploring technologies to capture COโ‚‚ from operations for use in chemicals or fuels.

  • Sustainable aviation fuel (SAF) development โ€“ Advancing projects to produce low-carbon jet fuel from sustainable feedstocks.

  • Offsets and carbon credits โ€“ Expanding purchases of carbon credits to compensate for hard-to-abate emissions.

How Sasol is reducing ghg emissions
Source: Sasol

Markets in Motion: Offsets, Renewables, and Risks

Sasolโ€™s strategy reflects broader challenges facing energy and industrial companies worldwide. Carbon credits are gaining popularity. The voluntary carbon market was worth over $2 billion in 2024. Itโ€™s expected to grow to nearly $50 billion by 2030, under the best-case scenario.

global demand for voluntary carbon credits increase by factor of 15 by 2030 and factor of 100 by 2050

However, the credibility of offsets is under scrutiny, and investors are demanding more transparency on how credits are used.

At the same time, global coal demand remains strong, particularly in emerging markets. South Africaโ€™s energy system still relies heavily on coal, which generates about 80% of the countryโ€™s electricity. This makes decarbonization complex, as companies like Sasol must balance energy security with climate commitments.

Meanwhile, renewable energy costs continue to fall. According to the International Renewable Energy Agency (IRENA), solar and wind are now the cheapest forms of new power generation in most regions. For Sasol, scaling renewables not only helps reduce emissions but also lowers long-term energy costs.

Balancing Growth, Risk, and Climate Goals

Sasolโ€™s higher earnings give it the financial strength to follow its dual-track strategy. This means it can keep expanding coal operations and invest in low-carbon solutions. The company’s growing purchase of carbon credits shows its urgent need to meet climate goals. It also reflects the challenge of cutting emissions from coal-heavy operations.
Sasolโ€™s future will depend on whether it can scale up renewable energy, develop viable low-carbon technologies, and manage the risks tied to its coal reliance. Its net-zero commitment remains a long-term goal. Yet, the companyโ€™s latest moves suggest it is trying to walk a fine line between financial performance and climate responsibility.

Kazatomprom Uranium Output Jumps 13% in 2025, But Plans for 2026 Cutback

Kazatomprom, the worldโ€™s largest uranium producer and Kazakhstanโ€™s national atomic company, has released its financial and production results for the first half of 2025. Despite reporting a sharp fall in profits compared to last year, the state-owned miner is sticking to its production guidance for the year and maintaining a cautious but stable outlook for the future.

Kazatompromโ€™s Profit and Revenue Decline in H1 2025

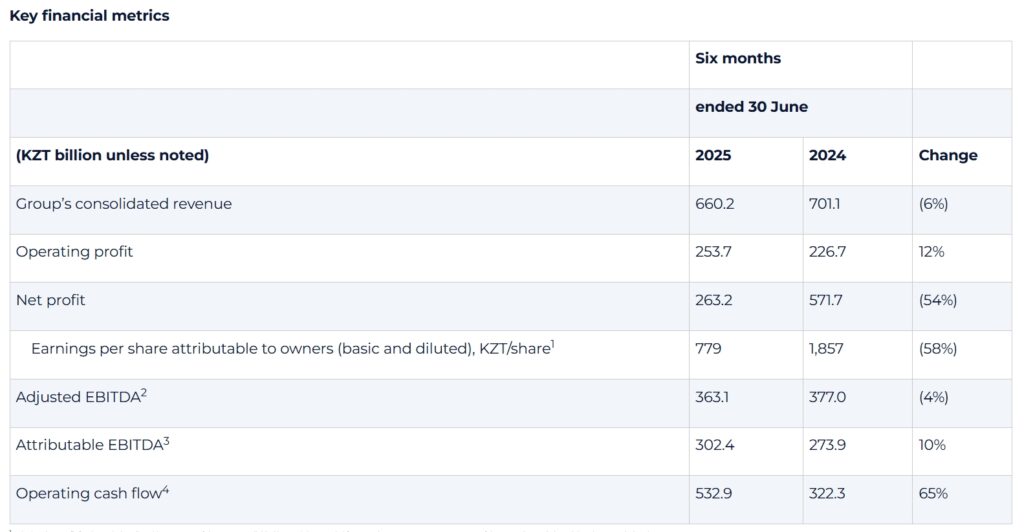
Kazatompromโ€™s consolidated revenue for the first half of 2025 was 660.2 billion tenge ($1.2 billion), down 6% from 2024 due to lower sales volumes.

  • Net profit fell 54% to 263.2 billion tenge ($489.5M) due to a one-time 2024 gain from consolidating the Budenovskoye JV. Excluding that, profit slipped only 5%.
  • Operating profit rose 12% to 253.7 billion tenge, helped by lower costs from buying less uranium from joint ventures.
  • Adjusted EBITDA slightly decreased 4% to 363.1 billion tenge, while attributable EBITDAโ€”which counts only the companyโ€™s own shareโ€”increased 10% to 302.4 billion tenge.

This shows Kazatomprom kept costs under control and improved core profitability despite lower sales volume and the absence of one-time gains.

CEO Meirzhan Yussupov, made an elaborate statement, saying:

โ€œAs the world’s largest producer and seller of natural uranium, Kazatomprom fully recognises the critical role the Company has in supporting the global energy transition. We remain committed to delivering long-term value to all stakeholders. Kazatomprom is currently undertaking a large-scale exploration in Kazakhstan, which is a top priority for replenishing its resource base and maintaining its leading position as a global nuclear fuel supplier,โ€ said

โ€œDespite the volatility in the spot uranium market and the broader capital markets, some of which may be due to uncertainty brought by the tariff wars, uranium long-term price has remained stable at 80 US dollars per pound proving that fundamentals remain strong. However, the Company does not view the current market developments to be sufficient to return to the Companyโ€™s initial 100% levels at this time, which are now being decreased by roughly 8 million pounds, cutting about 5% of the worldโ€™s primary supply.

โ€œKazatomprom takes its role in strengthening global energy policy seriously. Its leadership in ESG, combined with the scale of its operations, enables the Company to remain a reliable and responsible supplier of natural uranium globally. We are ready to participate in diversification of utilitiesโ€™ supply sources, and our strong position in this new cycle of long-term contracting reflects the trust and confidence the market places in us.โ€

Kazatomprom revenue
Source: Kazatomprom

Boost to Uranium Production and Sales

During the first six months of 2025, Kazatomprom producedย 12,242 tonnes of uranium (tU)ย on a 100% basis, representing aย 13% increase year-on-year.

Looking ahead, the miner expects to finish 2025 with annual output ofย 25,000โ€“26,500 tUย on a 100% basis. On its attributable basis (Kazatompromโ€™s own share in joint ventures), full-year production is estimated atย 13,000โ€“14,000 tU.

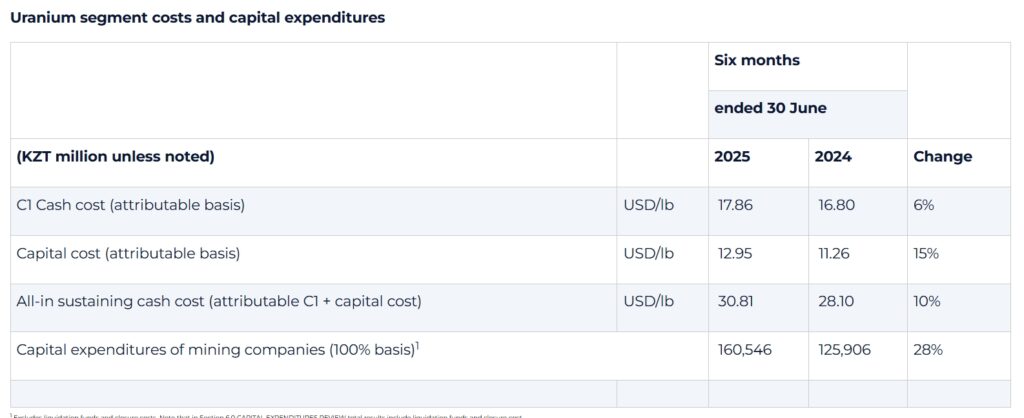
  • Uranium sales for this year are projected atย 17,500โ€“18,500 tonnes, while theย all-in sustaining cash cost (AISC)ย is expected to stay betweenย $29.00 and $30.50 per pound.
uranium Kazatomprom
Source: Kazatomprom

Plans for 2026 and Beyond

Kazatomprom also gave a crucial update regarding its 2026 production strategy. The company will reduce its nominal output level byย about 10%, cutting production from roughlyย 32,777 tU to 29,697 tU. Most of this decrease will come from adjustments at the Budenovskoye operation.
Importantly, this decision is not tied to supply constraints. In fact, sulphuric acid โ€” a critical input for Kazakhstanโ€™s in-situ recovery mining โ€” is expected to be available in stable amounts. Instead, the reduction reflects the companyโ€™s long-term policy ofย โ€œvalue over volumeโ€: prioritizing market balance and profitability over sheer output growth.

The company also highlighted Kazakhstanโ€™s plans to develop its own nuclear power plants in the coming years. These facilities could create strong internal demand for uranium, giving Kazatomprom an additional domestic market alongside its dominant global role.

Kazakhstanโ€™s Unique Advantage: Sustainable Uranium Mining with In-Situ Recovery (ISR)

One of Kazatompromโ€™s greatest strengths is its use of in-situ recovery (ISR) mining. This method extracts uranium from underground deposits using a liquid solution, eliminating the need for large open pits. This approach is:

  • Environmentally friendlierย than conventional mining.
  • Less carbon-intensive, producing far lower greenhouse gas emissions.
  • Moreย cost-efficient, keeping production competitive against global peers.

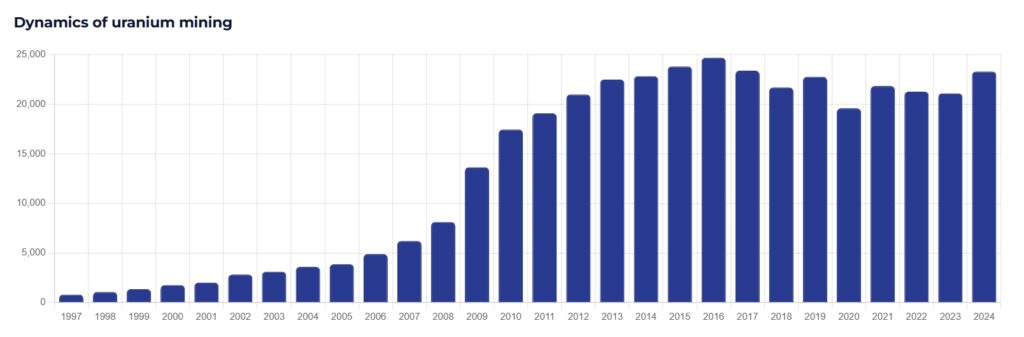
As of 2024, Kazatomprom producedย 23,300 tonnes of uranium (100% basis)ย using ISR, equal toย 21% of worldwide production. This made it the largest supplier of uranium on the planet, controlling aboutย 40% of the global market.

uranium Kazatomprom
Source: Kazatomprom

ESG and Net-Zero Commitments

The uranium giant is not just a production leader, but also a champion of sustainable mining. Its updated 2025โ€“2034 strategy places responsibility and environmental protection at the core of its business model.

Climate Targets

  • Achieveย carbon neutrality by 2060.
  • Cut emissions byย 10โ€“15% by 2030, and byย 55% by 2045.
  • Keep direct (Scope 1) emissions below Kazakhstanโ€™s reporting threshold of 20,000 tonnes of COโ‚‚ equivalent each year.

ESG Initiatives

  • Participates in Kazakhstanโ€™s Emissions Trading System.
  • Regularly reports on environmental, social, and governance (ESG) performance.
  • Invests inย renewable energy solutions, clean technology R&D, and energy efficiency upgrades.
  • Committed aboutย $30 million in 2024ย to green innovation, with plans to expand this spending moving forward.

As a result of these initiatives,ย S&P Global raised Kazatompromโ€™s ESG score to 50/100 in December 2024ย โ€” more than double the industry average.

Community Engagement and Social Responsibility

The company supports community initiatives likeย Earth Hour,ย Car-Free Day, and tree planting efforts across Kazakhstan. These campaigns aim to raise awareness about climate change and sustainability among both employees and the public.

The company also collaborates with research institutions for developingย medical isotopesย and recovering useful byproducts from uranium mining.

Reliable Uranium Supply Secures Kazatompromโ€™s Global Leadership

By maintaining its dominant share of the uranium market, Kazatomprom plays a central role in the global transition towardย low-carbon and nuclear power generation. Nuclear energy is regaining demand worldwide as governments seek cleaner, stable energy sources to meet climate targets.

The companyโ€™s ability to provide a reliable uranium supply, combined with its focus on sustainability and climate action, positions it as not just a commercial giant but also a key partner in the fight against climate change.

Kazatompromโ€™s first-half 2025 results show stable core operations despite lower net profit. Costs stayed controlled, and adjusted profits dropped only slightly. The company chose not to return to full production. Instead, it plans a 10% cut for 2026 to focus on long-term market stability and growth. With advanced ISR mining, strong ESG goals, and global reach, Kazatomprom is set to remain a top uranium supplier.