Nuclear Stocks, Oklo, NuScale, Centrus Energy, Rise as U.S. Army Pushes for Microreactors

Nuclear energy stocks are rising as the U.S. government backs advanced reactors. This supports growing electricity demand and boosts energy security. Companies such as Oklo Inc., NuScale Power, and Centrus Energy are at the center of this shift.

The Trump administration recently approved plans for the U.S. Army to deploy advanced microreactors for defense and research. This move shows stronger support for nuclear innovation. It also reflects a rising interest in compact, reliable power systems for military bases and remote locations.

New U.S. Policies Spark Investor Confidence

The new White House directive speeds up the deployment of small nuclear reactors (SMRs). This change falls under national security rules. These microreactors offer continuous, low-emission power. They work well in areas where grid electricity is unreliable or missing.

Government contracts will likely reach several billion dollars in the next decade. This is because the Department of Defense is testing modular systems for energy resilience.

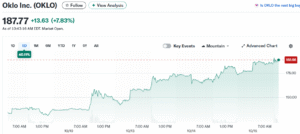
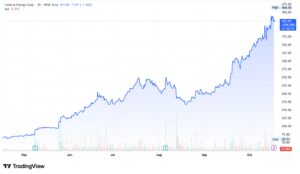
Investor confidence followed immediately. Centrus Energy (LEU) shares have risen sharply this year, supported by strong demand for nuclear fuel. Oklo (OKLO) shares jumped over 700% in the past 12 months, one of the biggest rallies in the clean-tech sector. 

Oklo stock

NuScale Power (SMR) showed strong financial growth. In Q2 2025, revenue reached USD 8.1 million, up from just $1 million the previous year. They also have nearly $490 million in cash reserves to support future projects.

Market analysts call this a turning point.  One industry source told CNBC.

“We’re finally seeing advanced reactors move from prototypes to contracts. That opens the door to real commercial deployment.”

The Janus Program: Power for the Battlefield

The core of this new defense strategy is the U.S. Army’s Janus program. It aims to build and test mobile nuclear microreactors that can generate 1 to 5 megawatts (MW) of power. These small reactors are designed to supply reliable, carbon-free electricity to remote bases and defense sites where fuel delivery is difficult.

Companies like Oklo and Nano Nuclear Energy are developing early designs that can be transported by truck and set up in days. The goal is to reduce diesel use, improve energy security, and keep missions running even if grids fail.

The Army expects to test the first units later this decade. If successful, Janus could change how the military powers its global operations — cleanly and independently.

Why Nuclear Power Is Back in Demand

Global electricity use is climbing fast. The International Energy Agency (IEA) expects global electricity demand to grow three times faster by 2030 than it did in the last decade. Artificial intelligence, data centers, electric vehicles, and electrified industries are driving much of that growth.

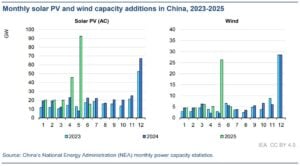
Traditional renewables such as wind and solar are vital but intermittent. Nuclear power can run 24 hours a day, providing the steady, carbon-free energy needed to balance modern grids.

The IEA estimates that small modular reactors could have 40 gigawatts (GW) of global capacity by 2050. In a high-investment scenario, this could rise to 120 GW. That’s equivalent to more than 1,000 modern reactors operating around the world.

nuclear energy investment outlook by type 2050

The Expanding SMR and Microreactor Market

SMRs are smaller, safer, and faster to construct than traditional nuclear plants. They can be built in factories, shipped by truck or rail, and installed near industrial sites or military bases.

Industry estimates value the global SMR market at $7.5 billion in 2025, projected to reach $16.1 billion by 2034, with a compound growth rate near 9%. Other forecasts, like those from BloombergNEF, predict the market could hit $40–50 billion by 2035. This depends on how fast governments make approvals easier.

Investment in SMR and microreactor projects has risen over 65% since 2021, says the Nuclear Energy Institute (NEI).

Microreactors—miniaturized versions producing under 20 MW—are gaining traction for military and research use. Studies show the levelized cost of electricity (LCOE) could be $48–78 per megawatt-hour.

Federal tax credits may reduce costs by up to 25%. They are a good option for remote sites or industrial operations. Diesel generators can be expensive and polluting, so these alternatives become competitive.

SMR construction cost

Inside the Race: Oklo, NuScale, and Centrus Take the Lead

Oklo Inc. is developing compact fast reactors using advanced fuels. Its first projects aim to deliver reliable power for military and industrial users. Oklo’s model focuses on selling long-term energy contracts rather than just hardware, positioning it for recurring revenue.

NuScale Power is the most advanced among U.S. SMR developers. The 77-megawatt reactor design is certified by the U.S. Nuclear Regulatory Commission (NRC). The company plans to deploy its first commercial modules with utilities and government agencies later this decade.

Nuscale power SMR stock

Centrus Energy is the only U.S. producer of high-assay, low-enriched uranium (HALEU). This fuel is essential for next-generation reactors. Its Ohio plant began enrichment in 2024, marking the first domestic production of this type of fuel in over 40 years. As Oklo and NuScale expand, HALEU demand is expected to rise sharply.

Centrus Energy LEU stock

Together, these companies represent the full nuclear value chain — from design and deployment to fuel supply — forming the backbone of America’s new nuclear ecosystem.

Industry Tailwinds Point to Long-Term Growth

The IEA says nuclear investment needs to rise from $5 billion today to at least $25 billion each year by 2030. This is crucial to meet climate goals. By 2050, total nuclear investment could reach $670 billion, as new builds replace aging reactors and supply clean electricity to expanding grids.

Nuclear energy currently provides about 9% of global electricity, but that share could rise to 12–14% by 2040 if planned projects succeed. New modular designs could reduce construction time by half. This means faster deployment than traditional plants.

Nuclear Power Req in 2050 - CC (1)

Economic models show that after a company successfully builds its first SMR, it can replicate the process. This can cut costs by 20–30% for each new unit. This follows a “factory learning curve,” much like what we see with solar and wind power.

The main growth drivers are:

  • Government policy: Nuclear power is now listed as a critical technology in several national energy strategies.
  • Technology improvements: Factory-built reactors reduce costs and risks.
  • Rising demand: The surge in AI, EVs, and industrial power needs favors firm, clean energy.
  • Fuel security: Domestic HALEU supply reduces reliance on imports.

Challenges include:

  • Regulatory hurdles remain high, with licensing often taking 5–10 years.
  • Construction delays and cost overruns have hurt investor confidence in past decades.
  • Competition from other clean technologies—like hydrogen and long-duration storage—continues to grow.

Analysts caution that while optimism is justified, many small reactor developers will need years before generating revenue. “Policy momentum is there,” said one NEI analyst, “but execution will determine who wins this race.”

Outlook: Nuclear Power’s New Phase

The U.S. Army microreactor initiative underlines a turning point in federal energy planning. Nuclear energy is making a comeback. Both the government and private investors support it. This shift highlights its importance for national security and clean power.

The IEA estimates nuclear generation must expand by roughly 80% by 2050 for the world to stay on track toward net-zero emissions. Achieving this requires faster approvals, predictable regulations, and consistent financing.

For investors, companies like Oklo, NuScale, and Centrus offer exposure to one of the most ambitious technology transitions in the energy sector. Their combined progress will help determine whether the U.S. can build a stable, low-carbon power system for the age of electrification.

U.S. Uranium Production Set to Rise as Anfield Energy Gains Velvet-Wood Approval

The U.S. depends heavily on imported uranium to power its nuclear reactors, using about 50 million pounds each year while producing less than 1% at home. Boosting domestic uranium production is crucial for energy security and reducing reliance on foreign sources. In this context, Anfield Energy Inc. (NASDAQ: AEC; TSXV: AEC) is making progress with its Velvet-Wood uranium project in San Juan County, Utah.

The Utah Department of Oil, Gas, and Mining recently approved the project for construction. This allows Anfield to move quickly toward production.

Velvet-Wood Gains Green Light for Rapid Development

In May, Anfield Energy Inc. announced that the U.S. Department of the Interior approved its Velvet-Wood uranium project in San Juan County, Utah.

This project was the first mining initiative approved under a new fast-track permitting process by the U.S. Department of the Interior. This process, introduced after President Trump’s energy emergency declaration in January 2025, lets energy projects complete environmental reviews in just 14 days.

By selecting Velvet-Wood, federal agencies highlighted its importance for the domestic uranium and vanadium supply.

Notably, Secretary of the Interior Doug Burgum said the Bureau of Land Management ensures safe and responsible extraction while protecting the environment.

With federal and state approvals in hand, Anfield plans to start mobilization immediately. The company expects to break ground within 30 days. They will:

  • reopen the mine portal
  • dewater the site
  • build surface facilities
  • develop a new mine incline.

These steps aim to bring Velvet-Wood into production quickly while keeping safety and environmental standards high.

Anfield Boots U.S. Energy Security with Domestic Production

Anfield acquired Velvet-Wood in 2015. The mine previously produced around 4 million pounds of uranium and 5 million pounds of vanadium from 1979 to 1984.

  • A preliminary economic assessment shows 4.6 million pounds of uranium at a grade of 0.29% eU3O8, plus additional inferred resources.

CEO Corey Dias said the approvals clear the way for building the mine and starting production. The company also plans to increase its reclamation bond with the Bureau of Land Management to meet federal land restoration rules.

Anfield’s project helps the U.S. reduce dependence on foreign minerals. The country imports uranium from Russia, Kazakhstan, and Uzbekistan. Vanadium supply mainly comes from China, Russia, South Africa, and Brazil.

By producing uranium and vanadium domestically, Anfield enhances energy security and supports industries such as nuclear power, aerospace, and defense.

Anfield uranium velvet wood project
Source: Anfield

Uranium and Vanadium: Key Strategic Materials

Uranium powers nuclear reactors, fuels U.S. Navy submarines, and helps produce medical isotopes. It is also used in tritium production for national defense. Vanadium strengthens steel and titanium alloys used in both commercial and military aircraft. Together, these minerals are vital for energy, defense, and industrial security.

EIA’s Domestic Uranium Production Report Second-Quarter 2025 highlights that in Q2 2025, the U.S. produced 437,238 pounds of uranium concentrate (U3O8), up 41% from the first quarter’s 310,533 pounds.

U.S. uranium
Source: EIA

Production came from the following mines:

uranium production
Source: EIA

Underground Mining Keeps Environmental Impact Low

Velvet-Wood will focus on underground mining. The company will use existing mine workings and develop new mineral areas. This approach keeps surface disturbance to just three acres and makes use of the old Velvet mine site.

Anfield also owns the Shootaring Canyon mill, one of only three licensed uranium mills in the U.S. Restarting this mill will allow the company to convert uranium ore into concentrate, reduce reliance on imports, and support domestic nuclear fuel production.

Economic and Strategic Benefits

Anfield combines strong assets with efficient operations. Its hub-and-spoke model links mining sites with processing mills, maximizing the value of Velvet-Wood’s resources. With measured resources, a licensed mill, and fast government approvals, the company is ready to meet growing demand for uranium and vanadium.

The project also brings jobs to Utah and supports local communities. Restarting the Shootaring Canyon mill adds processing capacity, lowers costs, and improves efficiency.

Moving Toward a Sustainable Energy Future

Anfield focuses on sustainable growth. Its operations balance environmental responsibility with energy and defense needs. By producing domestic uranium and vanadium, the company supports a carbon-free energy future while reducing reliance on imports.

Velvet-Wood shows how companies and supportive policies can address energy and security challenges. By using old mining assets and modern techniques, Anfield aims to become a leading U.S. uranium producer. It’s fast move from permitting to production sets an example for other critical mineral projects.

Two Solar Stories, Two Different Directions: Why China Builds Faster as the U.S. Hits Pause

Two very different headlines on solar hit the industry. In the United States, federal officials cancelled a proposed mega-solar project in Nevada that would have been among the nation’s largest. In China, state planners and companies finished a vast solar cluster on the Tibetan Plateau that will power millions of homes.

These moves show how policy choices shape where clean energy grows, and how fast the world decarbonizes.

A Giant U.S. Project Goes Dark

U.S. officials have formally stopped the environmental review of the Esmeralda 7 solar project. The plan bundled seven utility-scale sites in Nevada into one program.

Developers had proposed as much as 6.2 gigawatts of solar capacity. At full size, that output would have been enough to power roughly 2 million homes.

The project covered a very large area of public land and drew both praise and criticism. Supporters claimed it would create thousands of construction jobs. It could also lower power costs and provide unmatched clean energy for a quickly electrifying economy. Critics raised concerns about the impacts on local ecosystems, cultural sites, and rural communities.

The Bureau of Land Management marked the project’s programmatic review as “cancelled.” The Department of the Interior has also ordered heightened review for all solar and wind projects on federal land.

That new review process, policymakers say, is intended to improve oversight and protect sensitive areas. Industry groups and renewable advocates say it introduces long delays and uncertainty.

The timing matters. The U.S. Energy Information Administration expects record power capacity additions in 2025. They project about 64 gigawatts total, with solar providing over 30 gigawatts.

US electric capacity additions 2025

Canceling a 6-gigawatt project cuts off a key source of new clean power. This is especially important in the West, where transmission and land are already tight.

China Builds at High Altitude and High Speed

Meanwhile, China completed a massive solar buildout on the Tibetan Plateau. The complex spans about 162 square miles (420 square kilometers) and has millions of photovoltaic panels. These panels can generate around 20 gigawatts (GW) of electricity. That’s roughly three times more capacity than the Hoover Dam’s output.

This huge project can supply power to about 7 million homes. It will also reduce CO₂ emissions by over 15 million tonnes every year, as stated by China’s National Energy Administration (NEA). It reflects how quickly the country can mobilize resources for large-scale clean energy builds.

To balance power output, the site connects to battery storage and nearby hydropower dams, part of China’s “solar-hydro hybrid” model. This combination stabilizes the electricity supply during cloudy or nighttime hours.

China’s solar expansion has grown at record speed.

In 2024 alone, the country added more than 216 GW of new solar capacity — more than the entire installed solar capacity of the U.S. and Europe combined. China now hosts over 50% of global solar capacity and manufactures nearly 80% of the world’s solar panels.

Monthly solar PV and wind capacity additions in China

These investments are part of Beijing’s plan to reach 1,200 GW of combined solar and wind power by 2030. The International Energy Agency says China might hit this target five years early. The Tibetan Plateau cluster marks a milestone in this race.

Why the Two Stories Matter Together

Taken alone, each story is local. Together, they reveal a strategic divergence. Policy choices matter. Where governments enable big projects, industry responds by building big systems. Where governments slow approvals or restrict land use, projects stall.

This divergence has three key effects:

Supply and scale: 

Large projects require long lead times, major financing, and clear permits. China’s approach of centralized planning and direct support helps deliver very large arrays quickly. In the U.S., a shift to stricter review raises the risk that big projects will be fragmented or moved to private land, which costs more and takes longer to permit.

Grid and reliability:

Both countries face grid challenges. China pairs solar with storage and other generation to stabilize supply. In the U.S., many planned projects were meant to serve the growing load from data centers, electrification, and industry. Canceling megaprojects raises questions about where the new generation will come from as demand grows.

Jobs and industry:

Large builds create local employment and supply-chain work. China’s build supports domestic manufacturers and exporters. U.S. cancellations slow job creation tied to utility-scale construction and long-run operations.

The numbers behind the divide:

The table below compares the two major countries’ solar achievements.

solar power US vs. China

What industry leaders say

Renewable developers and industry groups warn that regulatory uncertainty in the U.S. will raise costs. When approvals take longer, financing becomes pricier, and contracts get riskier. That often shifts projects to smaller or more expensive sites or pauses them altogether.

Chinese state planners argue that their model supports rapid scaling at low cost. They deploy centralized planning, preferential financing, and coordinated transmission development to speed builds. Critics cite environmental trade-offs and questions about long-term sustainability, including impacts on fragile high-altitude ecosystems and local communities.

What It Means for the Global Energy Race

The contrast between China’s rapid expansion and the U.S. cancellation highlights how clean energy progress depends on stable rules and consistent incentives.

To reach global net-zero targets by 2050, the world needs to add around 1,000 GW of solar power every year starting in 2030, according to the IEA. Current growth rates fall short of that pace, especially in countries where permitting and financing slow development.

If the U.S. tightens rules on public land projects, developers might look to private land, offshore wind, or rooftop solar. Each option has trade-offs: higher costs, slower scale-up, or smaller output per site.

On the other hand, still leads in manufacturing. In 2024, it invested over $100 billion in solar manufacturing capacity. If this trend continues, China could supply two-thirds of all new solar capacity worldwide by 2030. That would give it both economic leverage and a stronger position in global clean-tech exports.

share of global renewable capacity additions 2030 IEA 2025 report
Data source: IEA Report

Two headlines show how quickly the global picture can change. One nation canceled a project that would have been among its largest. Another completed a massive solar cluster that will serve millions. Both decisions grew out of domestic politics, planning choices, and local concerns. Also, both will affect how quickly the world cuts emissions.

The lesson is simple. To win the race to low-carbon power, countries need clear rules, reliable permitting, and sustained investment. When that policy mix is present, large projects get built. When it is not, they stall. The future of the green energy transition depends on which path more governments choose.

US Solar Market Slows in 2025 – Here’s How SolarBank (NASDAQ:SUUN) Is Still Gaining Ground

Disseminated on behalf of SolarBank Corporation

The US solar industry began 2025 with mixed signals. Wood Mackenzie’s US Solar Market Insight Q2 2025 reported an addition of 10.8 gigawatts-direct current (GWdc) in Q1. This marks a 7% drop from last year and a steep 43% fall from Q4 2024. Rising costs, trade tensions, and changing policies have strained project development and consumer demand.

Let’s study the various segments of solar and their performance in this quarter.

Utility-Scale Solar Slows Down but Stays Resilient

Utility-scale solar added 9 GWdc, slightly down from the previous quarter and Q1 2024. Still, it remained a strong segment. Texas led with 2.7 GWdc, nearly double Florida’s numbers. Both states focused heavily on large-scale solar projects. Notably, Texas, Florida, Ohio, Indiana, and California made up 65% of utility-scale additions.

Mixed Results Across Distributed Solar Segments

Residential solar struggled, adding only 1,106 MWdc – the lowest since Q3 2021. High interest rates, economic concerns, and uncertainty about solar tax credits held back homeowners. California topped the list with 255 MWdc installed, but this was the weakest output since Q3 2020.

On a positive note, commercial solar grew by 4% year-over-year to 486 MWdc, mainly due to California’s NEM 2.0 projects. However, it saw a seasonal dip of 28% compared to Q4 2024.

U.S. Solar
Source: Wood Mackenzie

Community Solar Faces Headwinds but Holds Promise

Community solar projects, which are shared local installations, added 244 MWdc in Q1 2025. This was a sharp 22% year-over-year decline and a significant drop from Q4 2024’s surge. Maine and Massachusetts saw steep declines, while New York’s output fell slightly but still represented over half of the national community solar market.

Despite this downturn, installed capacity in 2025 is expected to exceed 2023 levels, reaching about 1.5 GWdc. New York and Illinois drive growth, with a community solar pipeline nearing 5 GWdc. However, grid interconnection delays and needed infrastructure upgrades slow progress.

community solar US
Source: Wood Mackenzie

Encouragingly, emerging markets may expand. Proposed legislation in several states could unlock over 1.5 GWdc of extra community solar capacity. Still, without new programs, national growth might stall. Wood Mac predicts a 6% average annual decline in community solar through 2030, but future legislative successes could change that.

Amid this uncertainty, SolarBank has remained resilient. The company recently announced a 2.4 MWdc community solar project in Nova Scotia.

SolarBank’s (SUUN) Nova Scotia Project Reflects Market Momentum

SolarBank Corporation (NASDAQ: SUUN) is going forward. The company recently announced the 2.4 MWdc Sydney Project in Nova Scotia, which will produce about 2,730 MWh of clean energy annually. It can potentially power 221 homes and offset nearly 1,900 tons of CO₂. The ground-mounted community solar power project, owned by AI Renewable Flow-Through Fund (“AI Renewable”), is a major step into Canada’s clean energy market.

The news lifted SolarBank’s stock (NASDAQ:SUUN) to $1.82 on June 16, up from $1.415 on June 13. The strong investor response highlights ongoing interest in clean energy opportunities (including those in jurisdictions outside the United States where government support remains strong), even as the broader market weathers policy and economic uncertainty.

SolarBank has developed over 100 MW of renewable energy projects in North America and has a pipeline of more than 1 gigawatt.

  • In the U.S., the company completed over 50 MW of community solar installations. Now, it applies that experience to the Canadian market, where demand for clean energy is rising and government support is growing.

SolarBank North American Growth Strategy

SolarBank North American Growth Strategy
Source: SolarBank

Its portfolio includes community solar, utility-scale systems, virtual net metering projects, and behind-the-meter installations. This variety keeps the company agile, maximizes returns, and fosters low-risk, high-reward partnerships.

SEE MORE:

How Shifting Trade Policy Is Disrupting US Solar Growth?

The US solar market is facing a tough trade and tariff environment in 2025. Earlier this year, the Trump administration added a 25% tariff on imports from Canada and Mexico starting March 4. While most solar panels aren’t imported from these countries, key parts like inverters and trackers are, which has pushed up production costs.

On top of that, aluminum tariffs under Section 232 increased from 10% to 25%, and later to 50% by June, making trackers and module frames even more expensive.

Tariffs on Chinese goods also soared, reaching 145% at one point due to fentanyl-related measures, before settling at 30% after a rollback deal on May 12. These changes have made the solar market more expensive and unpredictable.

  • The US added 8.6 GW of new solar module manufacturing capacity in Q1 2025, bringing the total to 51 GW.

Upstream production remains sluggish. Only one new domestic cell plant, i.e., ES Foundry’s 1 GW facility in South Carolina, opened this year. There were no new launches in wafer or polysilicon production.

However, in these turbulent times, SolarBank has shown resilience. A recent collaboration with Qcells, involving the use of U.S.-manufactured solar modules, is one example of how the company is preparing for multiple future scenarios.

Why Investors Are Watching Closely?

Despite the hurdles, the US solar industry remains a key player in the country’s energy transition. In Q1 2025, solar accounted for 69% of all new power capacity added, showing its continued dominance. With long-term demand rising from data centers and domestic manufacturing, the sector’s growth potential remains strong.

To keep that momentum, the industry will need stable policies, steady investment, and better solutions for grid connections and supply chain issues.

The recent rebound in NASDAQ:SUUN stock reflects growing investor confidence. It signifies that SolarBank can be a potential long-term bet. While near-term challenges exist, the outlook for solar remains promising, and smart investors are taking note.


Disclosure: Owners, members, directors, and employees of carboncredits.com have/may have stock or option positions in any of the companies mentioned: None.

Carboncredits.com receives compensation for this publication and has a business relationship with any company whose stock(s) is/are mentioned in this article.

Additional disclosure: This communication serves the sole purpose of adding value to the research process and is for information only. Please do your own due diligence. Every investment in securities mentioned in publications of carboncredits.com involves risks that could lead to a total loss of the invested capital.

Please read our Full RISKS and DISCLOSURE here.

Pentagon’s $1B Mineral Stockpile Boosts U.S. Independence from China

The Financial Times reported that the Pentagon plans to spend up to $1 billion on critical minerals. This move aims to cut U.S. reliance on China for essential metals in defense, clean energy, and advanced tech. Led by the Defense Logistics Agency (DLA), this program is the largest U.S. strategic mineral acquisition since the Cold War.

Significantly, the Pentagon’s plan is part of Trump’s broader “One Big Beautiful Bill Act” (OBBA) to enhance domestic and allied resources. Under OBBA, the DLA will use a $7.5 billion allocation to:

  • Expand the U.S. stockpile by 2027 ($2 billion)

  • Invest in mineral and processing supply chains ($5 billion)

  • Launch a Pentagon credit program to support private mining and refining projects ($500 million)

Washington’s Strategic Push: From Market Reliance to State Control

China’s control over global mineral supply chains has raised national security concerns. The country refines 80–90% of rare earths and dominates other key metals, such as cobalt and nickel.

Recent Chinese export limits on rare earths have raised concerns in the U.S. Washington views these limits as an effort to weaponize mineral exports. The Pentagon’s stockpiling shows a move from market-driven sourcing to state-led resource security.

Trump Targets China with 100% Tariffs

As per the latest news, President Trump has confirmed plans to impose 100% tariffs on all Chinese imports starting on November 1. He labeled China’s export limits a “hostile act.” He noted the timeline might change, saying, “Right now it is. Let’s see what happens.”

On Truth Social, Trump accused Beijing of manipulating supply chains and warned of “100% tariffs… over and above any tariff they are currently paying.”

This tariff announcement follows China’s decision to limit rare earth exports. These actions link industrial policy more closely to national security.

China exports

Pentagon Boosts Stockpile with High-Value Minerals

According to the Financial Times, the Pentagon’s buying spree targets four key minerals vital for defense and clean energy:

  • Cobalt – Up to $500 million. Used in batteries, superalloys, and medical implants.

  • Antimony – About $245 million, partly sourced from U.S. Antimony Corp. Key for flame retardants, batteries, and defense components.

  • Tantalum – Around $100 million. Essential for missile systems and aerospace parts.

  • Scandium – A combined $45 million, reportedly from Rio Tinto and APL Engineered Materials. Used in aerospace alloys and electronics.

These purchases will expand the U.S. national stockpile, which already holds $1.3 billion in metals. The new acquisitions focus on materials critical for weapons production, energy systems, and high-tech manufacturing.

A defense official told the FT that several Pentagon offices are now “flush with cash” for mineral procurement. The government is also exploring offshore mineral resources in the Pacific Ocean, rich in nickel, cobalt, copper, and manganese.

Alaska’s Ambler Road Project Approval

President Trump approved the long-contested Ambler Road Project in Alaska. This 211-mile corridor will connect the Dalton Highway to vast mineral deposits in the northwest.

This decision reverses a Biden-era block and is seen as a vital step toward U.S. resource independence. It opens access to copper, zinc, and rare earth elements essential for clean energy and defense manufacturing.

Mineral Stockpiling: Shielding the Nation from Supply Shocks

The U.S. imports over 80% of its critical minerals and relies heavily on foreign refining, according to the U.S. Geological Survey (USGS). This dependence exposes the country to significant supply risks, especially amid rising geopolitical tensions.

The International Energy Agency (IEA) estimates that China controls 90% of rare earth refining and significant percentages of nickel and cobalt refining. Such dominance highlights the risk of relying on a single country for critical inputs.

Thus, to tackle these challenges, the U.S. is building a stockpile of critical minerals. This will reduce supply risks, maintain production of weapons and advanced technologies, and support domestic mining investment.

In short, this stockpile acts as strategic insurance, safeguarding industrial capabilities and boosting national security.

The U.S. aligns with a global trend in mineral stockpiling. The EU requires reserves under its Critical Raw Materials Act. India launched a National Mineral Security Strategy in 2025, while Japan maintains a months-long reserve of rare earths.

Minerals with Net Import Reliance on China

u.s. import mineral commodities
Source: USGS

Market Impact and Industry Response

The Pentagon’s stockpiling effort has caught attention in mining and rare earth stocks. Companies like U.S. Antimony and MP Materials are gaining interest as Washington increases mineral procurement.

For example, the DLA’s plan for 3,000 tonnes of antimony—about one-eighth of U.S. annual demand—may stabilize the market for this volatile metal. Analysts expect similar effects for other targeted minerals as demand becomes clearer.

In conclusion, the Pentagon’s $1 billion mineral stockpile plan marks a clear shift. The U.S. government is no longer waiting for markets to secure resources. Instead, it is actively building reserves, funding domestic projects, and aligning economic policy with defense needs.

As competition for minerals increases, the Pentagon’s stockpiling is a defensive strategy and a clear signal. It shows that the next big race among global powers will be for critical minerals. These are vital for future technologies, not oil.

JPMorgan Chase’s $1.5 Trillion Bet on America’s Economic Future: Backs AI, Semiconductors, Clean Energy, and Critical Minerals

JPMorgan Chase has unveiled a $1.5 trillion Security and Resiliency Initiative. This 10-year plan aims to strengthen America’s economy by financing key industries that ensure national security and competitiveness.

The bank will support manufacturing, energy, and advanced technology. It plans to rebuild supply chains and drive innovation. Additionally, it includes $10 billion in direct investments to help U.S. companies grow and scale efficiently.

JPMorgan Fuels America’s Growth and Strategic Independence

For over 200 years, JPMorgan Chase has been key to the U.S. industry. The firm supports 34,000 mid-sized companies and over 90% of the Fortune 500. It has strong ties to defense, aerospace, healthcare, and energy sectors.

As a leading investment bank for over 15 years, its expertise in complex deals positions it well to boost investment in these areas.

And this initiative is timely when global competition is rising. Leaders want to rebuild infrastructure, increase industrial capacity, and rely less on foreign sources for key materials like semiconductors and clean energy parts.

How the Funding Works

The initiative will offer up to $10 billion in equity and venture capital to chosen U.S. companies. It aims to assist firms of all sizes, from startups to large corporations. They will provide financing, advisory services, and strategic investments to boost domestic growth.

This plan enhances a prior $1 trillion commitment for the coming decade. However, now, the firm will channel an additional $500 billion, increasing its total financing by 50%.

The initiative focuses on four key areas essential for national resilience:

jp morgan chase

Within these categories, JPMorgan has identified 27 sub-sectors, including nuclear energy and critical defense components.

JPMorgan Chase CEO Jamie Dimon emphasized the importance of secure supply chains and reliable access to critical materials and technologies.

He highlighted,

“It’s clear that the U.S. has become too reliant on unreliable sources for essential minerals and products. Our security depends on a strong, resilient economy. America needs more speed and investment and must remove barriers like excessive regulations and bureaucratic delays.” The firm states that this program is commercial, driven by strategic outcomes rather than philanthropy. JPMorgan Chase will hire more bankers and specialists to achieve its goals and set up an external advisory council for guidance.

Syncing with National Priorities

The Security and Resiliency Initiative supports federal goals to enhance U.S. manufacturing, increase energy independence, and strengthen national defense during global tensions.

This initiative comes as big tech and manufacturing companies boost domestic investments in semiconductors, AI, and clean technologies. Significantly, JPMorgan’s size makes it a key partner for industries facing supply chain challenges and regulatory issues.

By using its capital and expertise, the firm aims to help the U.S. regain its edge in advanced manufacturing, energy systems, and emerging technologies.

U.S. Investment in Energy Security

US national security investment
Source: IEA

Expanding Research and Policy Advocacy

To support this initiative, it will boost its research on private companies, supply chain risks, and essential materials for modern technologies.

  • The firm’s Center for Geopolitics will offer insights on global trends that affect trade and energy.
  • Its Asset & Wealth Management division will continue to invest in key industries tied to this new program.

The bank will further push for public policies that expand innovation and domestic production. It will also team up with educational groups to create talent pipelines and fill skill gaps in important industries.

JPMorgan Accelerates Low-Carbon Future 

JPMorgan Chase is advancing a low-carbon future while ensuring reliable and affordable energy. The firm advised Devon Energy on investing in Fervo Energy, which uses geothermal technology to deliver clean, round-the-clock power. As demand rises from data centers and electrification, geothermal energy is gaining investor interest as a dependable, carbon-free source.

Aligning Finance with Net Zero Goals

JPMorgan Chase has set nine net-zero targets across major sectors like oil and gas, aviation, steel, and cement, following the IEA’s Net Zero by 2050 plan. It is cutting emissions from its 5,500 facilities by using 100% renewable electricity and reducing Scope 1 and 2 emissions by 40% by 2030.

JPmorgan net zero
Source: JPMorgan

In 2023, the firm invested over $200 million in long-term carbon removal projects and financed $242 billion toward its $1 trillion Green goal, promoting global clean energy growth.

Leading Peers in National Investment

JPMorgan Chase’s $1.5 trillion Security and Resiliency Initiative marks one of the largest private-sector efforts to strengthen America’s economy.

In comparison, Bank of America’s $1.5 trillion commitment centers on sustainable finance and ESG goals, not directly on national security or industrial capacity. Citi focuses on operational resilience and nearshoring of supply chains, offering advisory services rather than large-scale domestic investments. Other major U.S. banks have joined select stability or infrastructure programs but lack a dedicated, decade-long initiative of this magnitude.

JPMorgan Chase stands out for its scale and scope, backing technology, defense, critical minerals, and manufacturing. Its mix of debt financing and direct equity investments positions the bank as a key force in building America’s economic strength and future security.

In conclusion, Dimon said,

“We must come together to tackle these challenges. We need to act now.”

U.S. Green Hydrogen Cuts Give China an Edge in the Clean Energy Race

The United States’ push to lead in green hydrogen, once a centerpiece of its clean energy strategy, is slowing down. Recent policy changes by the Trump administration cut funding for hydrogen hubs. They also reduced tax credits for large-scale projects. Analysts say this slowdown could open the door for China to dominate the emerging market for low-carbon hydrogen technology.

The cuts mark a major shift from the previous administration’s investment-heavy approach. Under the Biden-era Inflation Reduction Act (IRA), the U.S. planned to spend billions to make hydrogen from renewable electricity. The goal was to decarbonize industries such as steel, cement, and chemicals, which are hard to electrify.

Now, with federal incentives being reduced or delayed, several projects are being reassessed. Developers worry that without consistent support, production costs will remain too high to compete globally.

Funding Cuts Stall the Hydrogen Hub Dream

In mid-2025, the U.S. Department of Energy began reviewing funding for several regional hydrogen hubs. These hubs were meant to create networks linking producers, users, and transport systems. Seven hubs were approved in 2023, backed by more than $7 billion in federal funding, but four are now facing cuts or slowdowns.

Industry groups warn that this could affect projects worth tens of billions of dollars. “Policy certainty is crucial for investors,” said one energy analyst cited in the Bloomberg report. “Every delay or rollback increases the cost of capital and slows deployment.”

The U.S. also faces uncertainty about the Section 45V hydrogen tax credit. This credit offers up to $3 per kilogram for hydrogen produced with near-zero emissions. The credit helped close the gap between costly green hydrogen and cheaper fossil-based hydrogen. Without it, the cost of producing green hydrogen in the U.S. could rise from $3 to $5 per kilogram to over $7, according to BloombergNEF estimates.

China Powers Ahead in the Hydrogen Race

While U.S. funding stalls, China is moving fast. The country already leads the world in electrolyzer manufacturing — the core technology used to make hydrogen from water. In 2024, Chinese companies supplied more than 65% of global electrolyzer capacity, up from just 40% in 2022.

Electrolyser manufacturing capacity by company
Source: IEA

China’s domestic market is also growing. The government has set a goal to produce 200,000 tonnes of green hydrogen per year by 2025 and up to 5 million tonnes by 2030. To support this, provinces such as Inner Mongolia and Hebei have started big solar-powered hydrogen plants.

China’s advantage lies in scale and cost. Electrolyser units made in China cost $600–$1,200 per kilowatt, far lower than the $2,000–$2,600 range typical in the U.S. and Europe. If current trends continue, the price difference might make Chinese-made equipment the top choice for global projects.

Rising Costs and Shrinking Margins

Hydrogen production costs remain the biggest obstacle to global growth. The International Energy Agency (IEA) estimates that low-carbon hydrogen made with renewables costs two to four times more than conventional hydrogen from natural gas.

Producing one kilogram of green hydrogen costs between $4 and $12. This varies based on electricity prices and how efficient the electrolyzer is. Grey hydrogen, made from natural gas, costs $1–3 per kilogram. Analysts say costs must fall below $2 per kilogram to compete in most industries.

Scaling up manufacturing and securing cheap renewable power are key. The IEA projects that with large-scale deployment, electrolyzer costs could fall by 60% by 2030. But this requires steady investment and policy support — something the U.S. may now struggle to sustain.

According to BloombergNEF, global investment in hydrogen production and infrastructure reached $24 billion in 2024, up 50% from 2023. China accounted for nearly half of that total, while U.S. spending slowed after federal policy reviews.

Companies Pivot Amid Uncertainty

Despite the funding cuts, some U.S. companies are pressing ahead. Plug Power, a leading hydrogen firm, recently secured a $1.7 billion loan guarantee to expand production. The company plans to build several U.S. facilities that will supply green hydrogen to logistics and industrial customers.

Meanwhile, developers are adjusting strategies to reduce costs. Some plan to co-locate hydrogen plants near wind or solar farms to secure cheap power. Others are exploring blending hydrogen with natural gas in pipelines to reduce emissions without full conversion.

Industry leaders also call for cooperation with allies. The European Union, for example, continues to fund green hydrogen projects through its Hydrogen Bank initiative. They argue that closer cooperation across the Atlantic could help Western producers compete with China’s growing supply chain.

The Global Hydrogen Race

The race for leadership in green hydrogen is as much about geopolitics as it is about technology. Countries view hydrogen as a way to cut oil imports, boost industry, and ensure energy independence.

In 2024, global hydrogen demand reached about 97 million tonnes, according to the IEA. Only a small share — less than 1% — came from low-carbon production. To meet the world’s climate targets, that share must grow to at least 20% by 2030.

BloombergNEF expects the global hydrogen market to surpass $500 billion each year by 2050. This includes production, storage, and transport. But success depends on which countries can bring down costs first and scale up faster.

If the U.S. loses momentum now, analysts warn, it may have to rely on imported technology later — particularly from China. The following table compares the costs, market share, and 2030 planned output between the two nations. 

US versus China green hydrogen metrics

Can America Catch Up?

Green hydrogen is central to decarbonizing heavy industry and transport. It also supports renewable integration by storing excess power from wind and solar. Without continued investment, the U.S. risks missing key climate targets.

According to the Department of Energy’s earlier projections, hydrogen could cut up to 10% of U.S. greenhouse gas emissions by 2050 if widely adopted. That potential could shrink if projects slow or shift overseas.

At the same time, China’s expansion means more global supply, which could help reduce costs worldwide. Some analysts see this as an opportunity for global cooperation — if the U.S. can focus on innovation, efficiency, and regulation rather than pure scale.

The chart from Bloomberg below shows the potential changes under Trump’s current policy moves. 

2050 Green Hydrogen Estimates Change With Trump
Source: Bloomberg

Experts say the U.S. can still recover its position with the right mix of policy and private investment. Restoring tax credits, simplifying permits, and investing in electrolyzer manufacturing can help create a fairer market.

For now, China appears to have the upper hand. Its rapid manufacturing growth and strong state support have created momentum that the U.S. may struggle to match. However, as clean energy technologies mature, global demand will likely outstrip any single country’s supply.

The coming years will decide whether the U.S. remains a key player or becomes a buyer in the green hydrogen market it once hoped to lead.

China’s Grip on Lithium Tightens as Global Supply Struggles to Keep Up

China has strengthened its hold on the world’s lithium supply chain. The Ministry of Commerce (MOFCOM) updated China’s catalogue of technologies prohibited or restricted from export. They added important battery and lithium processing technologies. This includes lithium carbonate and hydroxide preparation, along with cathode material manufacturing.

The metal is essential for electric vehicles (EVs) and battery storage. With control over lithium mining, processing, and manufacturing, China now dominates nearly every part of this fast-growing sector.

The move lets Beijing control what technical know-how leaves China. It also strengthens its grip on the clean energy supply chain. This control affects global lithium prices, investment, and clean energy goals across Europe, the U.S., and Asia.

China’s Expanding Role in Lithium Production

Lithium demand has soared as countries push for cleaner transport and renewable energy. The International Energy Agency (IEA) says global lithium demand jumped almost 30% in 2024. This rise came mainly from EV production and big battery storage needs.

lithium demand outlook and mining requirements
Source: IEA

China produces about 18% of the world’s mined lithium, but its real strength lies in refining. Chinese companies hold about 65% of the world’s lithium chemical processing. They also account for over 75% of global battery cell production. These numbers show that even if lithium ore is mined in Chile, Argentina, or Australia, most of it ends up in Chinese refineries, which process it into battery-grade material.

china lithium and other battery minerals production
Source: EIA

China also leads in midstream and downstream battery manufacturing. In 2024, China made more than 1,200 gigawatt-hours (GWh) of lithium-ion batteries. That’s around three-quarters of the world’s total, as reported by BloombergNEF.

Major producers like CATL and BYD supplied both domestic and foreign automakers, including Tesla, BMW, and Toyota.

The country’s major players, such as Ganfeng Lithium and Tianqi Lithium, have spent years investing in foreign mines. They invest in lithium projects in South America, Africa, and Australia. This helps them secure long-term access to raw materials. This strategy ensures China’s industry gets the feedstock it needs, supports local gigafactories, and boosts global exports.

How Beijing’s Moves Sway Global Lithium Markets

Lithium prices have been on a roller coaster. After record highs in 2022, prices dropped sharply in 2023 and early 2024 due to oversupply. But by mid-2025, prices in China began to rebound. Lithium carbonate traded between CNY 59,000 and 69,000 per metric ton (roughly US$8,500–9,000).

lithium price

Industry analysts say Chinese producers used this price flexibility to outcompete foreign suppliers. When prices drop, many non-Chinese mining firms, especially in Australia and Africa, struggle to stay profitable.

Some market experts think China oversupplied the market on purpose. They believe this was to keep global influence and slow down rival producers.

Despite recent rebounds, volatility remains high. The IEA warns that lithium demand may double by 2030. It could reach over 1.3 million tonnes of lithium carbonate equivalent (LCE) each year. Without new mines and processing capacity, global shortages might return. This could lead to price spikes that impact battery and EV production worldwide.

Technology and Export Controls

China’s advantage goes beyond production scale. It now leads in processing technology, equipment, and battery chemistry. Beijing is now limiting exports of lithium-processing machines and technology. This move aims to protect local industries and manage intellectual property.

In 2025, several Chinese equipment suppliers limited shipments abroad. This makes it harder for competitors in the U.S. and Europe to build their own refining systems. These export limits are part of a broader strategy to keep the high-value stages of the supply chain inside China.

China's Dominance in Global Lithium Supply Chain 2025

Meanwhile, the U.S. IRA provides up to $369 billion for climate and energy. It includes strong incentives for local battery and mineral production. Europe’s Critical Raw Materials Act aims for 40% of critical minerals used in the EU to come from local or allied sources by 2030. But industry analysts say it could take up to a decade for these efforts to significantly reduce dependence on China.

The Global Response: Diversifying Supply Chains

Governments and companies are now racing to reduce dependence on China. The United States, Canada, and Australia are expanding domestic mining and refining. Chile and Argentina, along with other South American nations, are building local industries. They aim to process lithium instead of just exporting raw materials.

The IEA warns that global lithium supply must increase sevenfold by 2035 to meet climate goals. That means bringing new mines and refineries online faster while maintaining environmental standards.

In 2024, the World Bank estimated that over €680 billion (US$730 billion) was invested in renewable power and storage. However, only a small part funded the raw material supply. If supply growth lags, battery shortages could slow EV production by the late 2020s.

However, challenges persist. Lithium extraction can strain water resources and ecosystems. Building new facilities also requires stable regulation and financing, which can take years to secure.

Surge Battery Metals: Strengthening North American Supply

In North America, one of the emerging players helping to diversify lithium supply is Surge Battery Metals (CSE: NILI). The company is developing the Nevada North Lithium Project. This project is in one of the U.S.’s most promising lithium-rich areas.

Surge aims to produce battery-grade lithium for the growing North American EV market. Its exploration results have shown strong potential for large-scale, high-grade lithium clay deposits. Projects like Surge’s align with U.S. efforts to build a secure domestic supply chain and reduce reliance on imports from China.

Surge helps ensure supply security and meet environmental goals by creating cleaner extraction and processing methods. Its work supports the U.S. Department of Energy’s plan to create a domestic battery materials supply chain. It seeks to meet 90% of the country’s lithium demand by 2035.

What’s Ahead: Competition, Cooperation, and Climate Goals

The global lithium race is about more than profits. It shapes the pace of the clean energy transition. China’s dominance gives it both economic power and geopolitical influence. Western economies are investing a lot to find new supplies and to lower strategic risks.

The market outlook suggests demand will remain strong throughout the decade. Analysts expect lithium prices to stabilize as new supply enters the market, but competition will remain intense.

For the world to meet its climate goals, cooperation will be as important as competition. Shared technology, recycling, and sustainability standards could help reduce emissions and stabilize supply chains.

Surge Battery Metals and other new miners are working to localize production. They aim to boost transparency and ensure lithium supply helps the clean energy transition, not hinders it.

China now controls the heart of the global lithium industry, from mining and refining to battery exports. This dominance brings both opportunity and risk. The rest of the world is responding, but catching up will take time, investment, and innovation.

What DECARBON 2026 Reveals About the Industry’s Next Move

0

The oil and gas industry is moving from intention to action. With a focus on sustainability and operational advancements, this sector is investing in groundbreaking technologies to meet new demands. Find out how the Oil and Gas Decarbonisation Congress (DECARBON) 2026 is driving this transformation and reshaping the global energy landscape.

The oil and gas sector has grown weary of abstract discussions around decarbonisation, hydrogen’s future and other optimistic projections. Grand narratives have done little to solve real-world problems, and industry players are increasingly unwilling to indulge them. Instead, the focus is shifting toward practical, technology-based solutions, even if most are still in their early stages. These changes are a response to pressure for environmental accountability and a direct consequence of the sector’s underlying realities. Specifically, the finite nature of natural resources and the rising costs of extraction have compelled companies to adopt long-term strategies aimed at sustaining profitability and resilience. As a result, investments are finally beginning to flow where they matter most — into technologies that can both curb emissions and sharpen operational efficiency. Rhetoric, it seems, is losing ground to results.

The Oil and Gas Decarbonisation Congress (DECARBON) 2026, held on 9–10 February in Vösendorf, Austria brings together technical specialists, project leaders and technical specialists to examine the most relevant trends and practical approaches to reducing carbon emissions across the upstream, midstream and downstream sectors.

Low-Carbon Hydrogen: Infrastructure and Application

Hydrogen (H₂) is widely recognised as one of the most critical tools in global decarbonisation strategies. According to the International Energy Agency (IEA), low-carbon hydrogen production could reach 180 million tonnes per year by 2050, depending on infrastructure deployment and policy alignment.

While green hydrogen holds great promise, its implementation remains largely aspirational due to current cost barriers. As a result, discussions around hydrogen

must go beyond ideal scenarios to address the market situation. This is why the agenda of the Oil and Gas Decarbonisation Congress 2026 includes a range of hydrogen technologies that are particularly relevant today.

The Congress features a Leaders Panel addressing the development of efficient hydrogen infrastructure, green hydrogen value chain development and foundational processes in low-carbon hydrogen production. Among the speakers are Tamás Mérő, Head of Green Hydrogen Value Chain Management at MOL Group, and Fabio Ferrari, Head of the Circular Carbon and Integration Solutions Department at NextChem, along with other industry leaders.

Digitalisation and Operational Performance

Digital tools have reshaped asset management and environmental monitoring across the energy industry. Automation, AI and real-time analytics have helped reduce emissions, cut OPEX and increase system stability. According to recent reports, technology leaders like Siemens are using digital twins and AI-powered analytics to monitor emissions, optimise system performance and support decarbonisation efforts across various sectors.

This growing emphasis on digital innovation is further reflected in a roundtable session at DECARBON 2026, focused on the role of technology in advancing sustainability objectives. Mario Calado Industry Strategy Lead at Siemens AG, participates in the discussion and shares insights into how digital transformation could be realised. Complementing this, Florian Klein, Business Development Manager for Energy Transition at Linde Advanced Operations Solutions, outlines how companies applied advanced operations systems to reduce energy use and move towards an autonomous plant. Moreover, at the Congress delegates have a chance to learn more about machine learning powered optical gas imaging solutions, P2X technologies, satellite technology and many others.

Electrification in Upstream Operations

Electrification has proved an effective lever for reducing Scope 1 and Scope 2 emissions in upstream operations as it has improved energy management and reduced operational variability.

During the session focused on decarbonisation for upstream operations, Ali Aboosi (Business Development Manager at Chromalox) presents the deployment of electric process heating systems across production assets. Dr. Bo Fu, CEO of Oiler.ai, contributes insights on the machine-learning-powered optical gas imaging solution for real-time methane leak detection and quantification. Additionally, Fayez Al-Mezel, Business Planning Specialist at Kuwait Oil Company, take part in the discussion, offering energy transition strategies for the upstream sector.

Carbon Capture and Storage at Industrial Scale

Carbon Capture, Utilisation and Storage (CCUS) remained a priority for industrial decarbonisation. According to McKinsey & Company, CCUS capacity needs to increase more than 120 times by 2030 to align with global net-zero targets. Progress toward this goal is underway: as of the first quarter of 2025, global operational CCUS capacity reached just over 50 million tonnes of CO₂ per year, reflecting a year-on-year increase.

To showcase how these targets are being addressed in practice, the Closing Panel at DECARBON 2026 presents case-studies from active CCUS projects across Europe, with a focus on integration, commercial readiness and cross-sector collaboration.

Speakers included:

● Dr Marc Scherle, Project Manager, Business Development & Sales, Linde Engineering – Decarbonisation of process industry using Linde technologies

● Phillip Cooper, Project Director, Petrofac – Design of the Aramis CCS pipeline system

● Kleopatra Avraam, Strategic Planning Senior Director, DESFA – Overview of DESFA’s CCS Project, APOLLOCO2

● Andreas Grobler, Strategic CCUS Partnership Manager, Shell Deutschland – Case examples from Shell’s global operations

The discussions at DECARBON 2026 underscore a clear industry pivot: away from theoretical promises and toward credible solutions. Topics like hydrogen infrastructure, digital transformation, upstream electrification and CCUS must be actively evaluated and, in some cases, deployed. Faced with finite resources and

rising operational pressures, the sector is responding not with rhetoric, but with targeted investment in technologies that deliver measurable outcomes. The message of DECARBON 2026 is clear: decarbonisation is not a distant ambition — it’s a competitive edge, and it’s happening now.

As the Congress motto states, “Reimagine the future of energy”, this call remains relevant across all segments of the industry. Explore what’s next with DECARBON 2026: https://sh.bgs.group/39p

Digital Marketing Goes Green: Google Launches Carbon Footprint Tool for Google Ads

Google just made it easier for advertisers to go green. The tech giant has launched Carbon Footprint for Google Ads—a new tool that helps marketers measure and manage the carbon emissions from their ad campaigns.

After testing it with a few large advertisers earlier this year, Google has now opened it up to everyone. The tool gives users access to first-party data showing how much carbon their ads produce across Google Ads, Display & Video 360 (DV360), Search Ads 360 (SA360), and Campaign Manager 360 (CM360).

Understanding Ad Emissions with Google’s Carbon Footprint Tracker

The Carbon Footprint tool is designed to help advertisers see the bigger picture when it comes to sustainability. It breaks down emissions data across Scopes 1, 2, and 3, following the Greenhouse Gas Protocol and the Ad Net Zero Global Media Sustainability Framework. These standards make sure the numbers are accurate and in line with global climate reporting guidelines.

Here’s what advertisers can do with it:

  • Get detailed, account-specific data: The tool uses Google’s first-party data to calculate emissions for each account based on targeting, media mix, and auction activity.
  • Use trusted standards: Reports follow the Greenhouse Gas Protocol (GHGP) and Global Media Sustainability Framework (GMSF), which means the data meets international sustainability benchmarks.
  • See exactly where emissions come from: Reports split the data into Scopes 1, 2, and 3, including both market- and location-based Scope 2 figures.

With this information, advertisers can identify where their emissions are highest—and take steps to reduce them.

Easy Access, Fresh Data

Advertisers using Google Ads, DV360, SA360, or CM360 can request their Carbon Footprint report directly from Google. Reports are updated every month and include data starting from January 2024.

For instance, if you request a report on October 20, 2025, it will include data from January 2024 through September 2025. Advertisers can submit up to five report requests a day, each covering up to 25 account IDs. Google processes up to 10,000 total requests daily across all advertisers.

Location-based emissions estimates for Google Ads go back to January 2024, while both market-based and location-based estimates for DV360, SA360, and CM360 start from July 2024.

Making Advertising More Sustainable

Google’s rollout of this tool is a big step for the ad industry. It helps marketers better understand their environmental footprint and gives them the insights they need to take action.

This isn’t just about meeting compliance requirements—it’s about making smarter choices. Advertisers can use this data to plan more efficient campaigns, reduce waste, and make their marketing strategies more eco-friendly.

In today’s world, sustainability isn’t just good ethics—it’s good business. Consumers increasingly want to support brands that care about the planet. By taking steps to reduce emissions, companies can boost their reputation and connect with those values.

Google’s Commitment to Green Tech

This launch fits perfectly with Google’s long-term sustainability goals. The company aims to run entirely on carbon-free energy and reach net-zero emissions by 2030. By giving advertisers access to tools like Carbon Footprint for Google Ads, Google is encouraging other businesses to follow the same path.

It also ties into Google’s broader eco-friendly efforts, from promoting sustainable shopping filters to helping companies track emissions through Google Cloud. Altogether, these tools show Google’s belief that sustainability should be built into digital products, not added as an afterthought.

Cutting Emissions Amid AI Growth

The company’s total greenhouse gas emissions have risen 51% since 2019, with AI being a key driver. However, its latest sustainability report revealed a notable achievement: a 12% drop in energy emissions from its data centers in 2024, even as AI demand surged.

google emissions
Source: Google

These data centers form the backbone of its AI operations. In 2024, they consumed 30.8 million megawatt-hours of electricity, more than twice the level recorded in 2020. The surge underscored the immense energy needs behind AI’s rapid expansion.

Despite the spike in power use, up 27% year-over-year, Google successfully reduced its direct emissions. The company credited this to long-term clean energy contracts, efficiency upgrades, and advanced cooling systems, which helped curb climate impact while keeping pace with AI-driven workloads.

In short, Google showed that scaling AI and cutting emissions can go hand in hand with the right technology and commitment.

google emissions
Source: Google

A Step Toward Cleaner Advertising

If widely adopted, this tool could transform how the industry thinks about advertising. For years, the ad world has been criticized for its environmental impact, from data centers powering digital ads to the energy used in ad production. Now, there’s a concrete way to track and improve those impacts.

But the real change will come from how advertisers use this data. Measuring emissions is just the first step—acting on that information is what really counts. Companies that use these insights to reduce their footprint could set the standard for greener marketing practices.

Thus, Google’s Carbon Footprint for Google Ads shows that advertising is sustainable. It allows brands to balance performance with responsibility, proving that effective marketing doesn’t have to come at the planet’s expense.

As more advertisers embrace this kind of transparency, sustainability could become a standard metric alongside reach and engagement. And that’s a big win for both business and the environment.

Google’s move shows that every click, impression, and campaign can be measured not only by what it achieves—but also by its impact on the world around us.