Microsoft Signs 626,000-Tonne Carbon Removal Deal with Svante and Indigenous-Led North Star Project in Canada

Microsoft (MSFT stock) has signed a long-term carbon removal agreement that highlights both the scale and direction of the emerging carbon market. The company will purchase 626,000 tonnes of durable carbon dioxide removal (CDR) credits over 15 years from the North Star project in Saskatchewan, Canada.

This project is being developed by Svante Technologies Inc. in partnership with the Meadow Lake Tribal Council (MLTC), through their joint venture North Star Carbon Solutions LP.

The facility will use bioenergy with carbon capture and storage (BECCS) to remove COโ‚‚ from the atmosphere and store it permanently underground. Notably, the project will be co-located at the existing MLTC Bioenergy Centre and powered by waste biomass from a nearby Indigenous-owned sawmill.

This makes it one of the first fully integrated, Indigenous-led BECCS projects in Canada and a landmark deal in Microsoftโ€™s growing carbon removal portfolio.

Indigenous-Led Carbon Project Sets New Benchmark in Canada

The North Star project stands out not just for its technology, but also for its ownership model. It is expected to be Canadaโ€™s first major Indigenous-owned, high-quality carbon removal project. The Meadow Lake Tribal Council, which represents several First Nations communities, plays a central role in both ownership and development.

This structure ensures that economic benefits stay within the local community. During construction, the project is expected to create around 50 jobs. Once operational, it will support a smaller but steady workforce while also boosting demand for nearby businesses. As a result, the project delivers both climate and economic value.

Equally important, the facility will rely on an existing industrial ecosystem. The MLTC Bioenergy Centre already generates renewable energy using wood waste.

That waste comes from the NorSask Forest Products sawmill, which is owned by MLTC and supplied through sustainably managed forests. This close integration reduces costs, improves efficiency, and strengthens the projectโ€™s environmental credibility.

Phillip Goodman, Director of Carbon Removal Portfolio, Microsoft, said:

โ€œWeโ€™re pleased to work with North Star Carbon Solutions and Meadow Lake Tribal Council to help advance high-quality, durable carbon dioxide removal. To meet our climate goals, we need to help scale solutions that deliver durable storage and are backed by rigorous monitoring and verification. This agreement supports an Indigenous-led collaboration that enables the infrastructure needed to bring durable carbon removal online in Canada, thus creating a pathway for additional projects over time.โ€

How the North Star BECCS System Works

The North Star facility uses BECCS, a technology widely seen as critical for achieving net-zero emissions. It combines renewable energy production with carbon capture to deliver negative emissions.

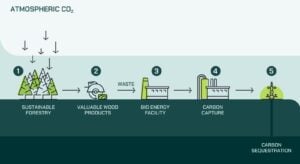
  • In this system, trees first absorb COโ‚‚ from the atmosphere as they grow. When these trees are processed for wood products, leftover biomass is used as fuel to generate energy.
  • Normally, this process would release carbon back into the air. However, in this case, the COโ‚‚ is captured before it can escape.
  • The captured carbon is then compressed, transported, and injected deep underground into a secure geological formation.

This ensures long-term storage, often lasting hundreds or even thousands of years. Continuous monitoring systems track the stored carbon to ensure safety and permanence.

Here’s a representation of the BECCS process:
north star beccs carbon removal
Source: Svante

A Fully Integrated โ€œSource-to-Sinkโ€ Model

From the process explained above, it’s clear that one of the most important features of the North Star project is its fully integrated design. It connects every step of the carbon removal process, from biomass supply to permanent storage.

This end-to-end system improves efficiency and reduces uncertainty. It also strengthens the credibility of the carbon credits produced.

Significantly, Svante will fund the project through its early stages, supporting development until a final investment decision is made. Commercial operations are expected to begin in early 2029.

Reliable Carbon Removal, Verified and Transparent

At full capacity, the facility is expected to capture up to 90,000 tonnes of COโ‚‚ annually. Over the 15-year contract period, this will translate into the delivery of 626,000 tonnes of verified carbon removal credits to Microsoft.

All credits will follow strict monitoring, reporting, and verification (MRV) standards, ensuring transparency and quality.

Microsoft Scales Up Carbon Removal Strategy

This agreement is part of Microsoftโ€™s broader push to scale carbon removal. The company has rapidly increased its purchases over the past few years, signaling a shift from small pilot projects to large, long-term commitments.

In 2023, Microsoft contracted roughly 5 million tonnes of carbon removal. By 2024, that number rose to 22 million metric tons. In 2025, the target surged further to around 45 million tonnes, as announced by the company. This sharp increase shows how quickly the company is building a diversified carbon removal portfolio.
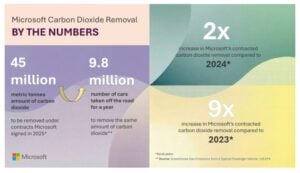
microsoft carbon removals
Source: Microsoft

Importantly, Microsoft does not rely on a single technology. Instead, it spreads its investments across multiple pathways, including BECCS, direct air capture, and mineralization. This approach reduces risk while supporting the development of different solutions.

Recent agreements reflect this strategy. These include multi-million-tonne deals with BECCS facilities in the United States and Europe. Together, they position Microsoft as one of the most influential buyers in the global carbon removal market.

Rising Emissions Make Carbon Removal Essential

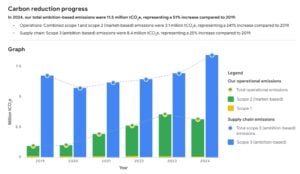
Despite its climate commitments, Microsoft faces a growing emissions challenge. The companyโ€™s total emissions have increased by more than 30% compared to 2020 levels. This rise is largely driven by the rapid expansion of data centers, cloud services, and AI infrastructure.

These operations require vast amounts of energy and materials, making it difficult to cut emissions quickly. As a result, carbon removal has become a key part of Microsoftโ€™s strategy.

However, the company is clear about its priorities. It focuses first on reducing emissions through efficiency and clean energy. Carbon removal is used only for emissions that cannot be eliminated.

This approach supports Microsoftโ€™s ambitious net-zero goals. The company aims to become carbon negative by 2030 and aims to run on 100% renewable electricity and eliminate all historical emissions by 2050.
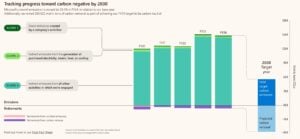
microsoft emissions
Source: Microsoft

BECCS Market Gains Momentum

The North Star deal also reflects growing interest in BECCS technology. While still at an early stage, the global BECCS market is expanding rapidly. Analysts expect it to grow at a CAGR of around 19.27% from 2024 to 2030 as governments and companies seek reliable carbon removal solutions.

beccs
Source: marknteladvisors

BECCS is particularly valuable because it can deliver durable removals. Unlike some nature-based solutions, which may face risks like fires or land-use changes, BECCS stores carbon permanently underground. This makes it attractive for companies looking for high-quality credits.

According to the International Energy Agency, BECCS could play a major role in climate mitigation. It may contribute up to 15% of the emissions reductions needed by 2100 to limit global warming to 2ยฐC.

At the same time, challenges remain. Concerns about biomass sourcing, land use, and storage safety continue to shape the debate. Even so, projects like North Star aim to address these issues through sustainable sourcing and rigorous monitoring.

North Star Marks a New Era in Carbon Markets

In conclusion, the Microsoftโ€“North Star agreement highlights how quickly the carbon removal market is evolving. Large buyers are now committing to long-term deals that help bring new projects to life.

At the same time, the project sets a new benchmark for inclusive climate action. Indigenous ownership ensures that local communities benefit directly from the energy transition.

As demand for durable carbon removal continues to grow, more projects like North Star are likely to emerge. These developments will play a critical role in helping companies meet climate targets while building a scalable, high-integrity carbon market.

In that sense, this deal is more than just a contract. It is a clear signal that carbon removal is moving from concept to realityโ€”and becoming a core part of global climate strategy.

SHEIN Teams Up with DHL to Cut Air Cargo Emissions with Sustainable Fuel

SHEIN, the global online fashion and lifestyle retailer, has taken a new step in cutting the climate impact of its logistics. The company signed an agreement with DHL Group to use DHLโ€™s GoGreen Plus service. This service allows corporate customers to support the use of sustainable aviation fuel (SAF) in air cargo operations.

SAF is blended into regular jet fuel to reduce carbon emissions from flights. This move is part of SHEINโ€™s broader work to explore lowโ€‘carbon solutions for its air transport footprint.

Mustan Lalani, SHEINโ€™s Head of Sustainability, remarked:

“Working with partners such as DHL allows us to better understand how sustainable aviation fuel solutions may be incorporated into air cargo logistics. Initiatives like this are part of SHEINโ€™s broader efforts to explore how emerging approaches across the aviation sector may contribute to addressing carbon emissions associated with air transport.”

What Sustainable Aviation Fuel Is: Cutting Emissions at the Source

DHLโ€™s GoGreen Plus service gives customers lifecycle emissions reductions from SAF. It uses recognized accounting and certification methods. This means SHEIN can include a share of SAFโ€‘related emissions reductions in its corporate reporting.

The collaboration follows earlier deals. In 2025, SHEIN signed a memorandum of understanding with Lufthansa Cargo to explore sustainable air freight technologies and fuel use.

Sustainable aviation fuel comes from renewable or low-carbon sources. These include used cooking oil, agricultural waste, and non-fossil carbon materials. Compared with conventional jet fuel, SAF can cut lifecycle greenhouse gas emissions by up to 80%. This is because SAF feedstocks carry less net carbon when burned, considering their origin and life cycle.

Air transport remains a significant source of emissions as global trade and eโ€‘commerce grow. SAF is one of the few scalable solutions available today that can work with existing aircraft engines and fuel infrastructure. It reduces emissions at the source rather than offsetting them after the fact.

SAF is still a small part of global aviation fuel. However, demand and investment are rising due to the industry’s push for net-zero goals. The chart below shows how much SAF is necessary to meet the air transport net-zero target.

Growing Market for SAF: A $16 Billion Industry by 2030

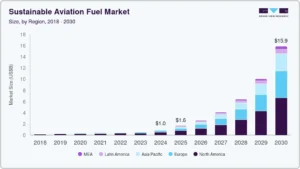
The global sustainable aviation fuel market is expanding rapidly. A recent report by Grand View Research estimates the market was worth US$1.04โ€ฏbillion in 2024. It projects that the industry could reach US$15.85โ€ฏbillion by 2030, growing at a 57.5% compound annual growth rate (CAGR) from 2025 to 2030.

sustainable-aviation-fuel-market-size

This growth is driven by several factors:

  • Rising corporate and airline decarbonization targets,
  • Stronger environmental regulations,
  • Supportive government policy, and
  • Increasing investment in SAF technologies.

Airlines and logistics providers are under pressure to cut emissions and invest in cleaner fuel alternatives.

Bio-based SAF comes from plants, waste oils, or renewables. It leads the market since it blends easily with jet fuel, needing few changes to aircraft.

Despite strong projected growth, SAF still accounts for less than 1% of global jet fuel use today. Industry groups, like the International Air Transport Association (IATA), estimate that SAF will supply about 0.7% of aviation fuel by 2025. This is due to slow production growth. By 2030, SAF production ranges from 17 to 20 Mt.ย 

SAF supply forecast 2030

Governments in some regions are introducing mandates to increase SAF usage. For example, the UK requires airlines to blend at least 2% SAF starting in 2025, rising to 10% by 2030 and 22% by 2040. These rules aim to spur SAF production and adoption.

SHEINโ€™s Sustainability Goals and Progress

SHEIN has publicly committed to reducing its environmental impact and aligning with climate science goals. The companyโ€™s scienceโ€‘based, netโ€‘zero target has been approved by the Science Based Targets initiative (SBTi). Under this plan, SHEIN aims to reach netโ€‘zero greenhouse gas emissions across its value chain by 2050.

Shein emission reduction targets
Source: SHEIN

The approved targets include reducing Scope 1 and 2 emissions by 42% by 2030 and reducing Scope 3 emissions by 25% by 2030. SHEIN also plans to source 100% renewable electricity by 2030 as part of its energy transition.

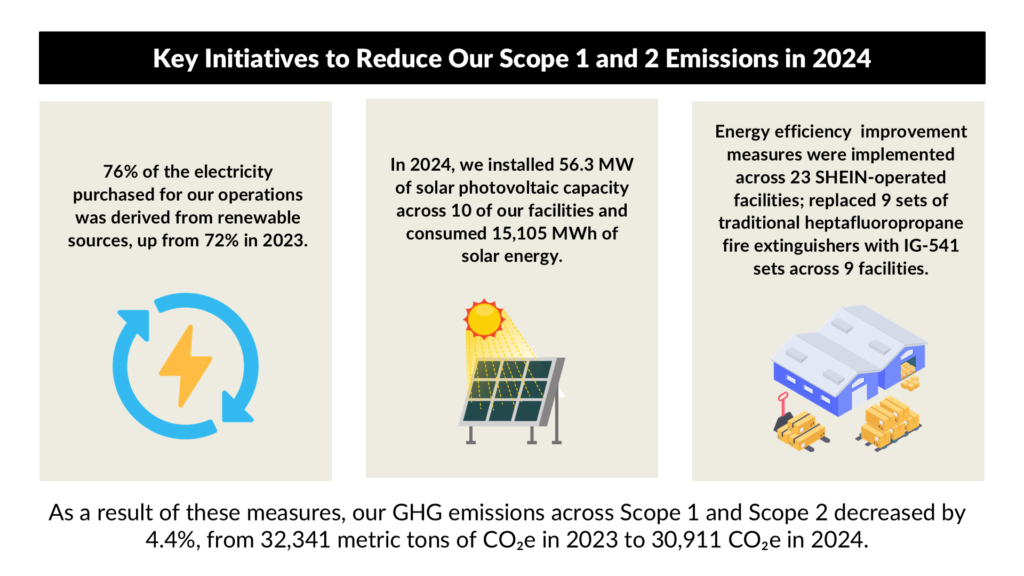
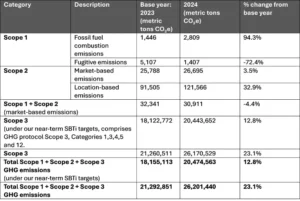
SHEIN 2024 GHG emissions profile
Source: SHEIN

SHEIN developed a decarboniZation roadmap in 2024 with support from external sustainability consultants. This roadmap guides the companyโ€™s emissions reduction efforts and is designed to align with the Paris Agreementโ€™s goal of limiting warming to 1.5โ€ฏยฐC.

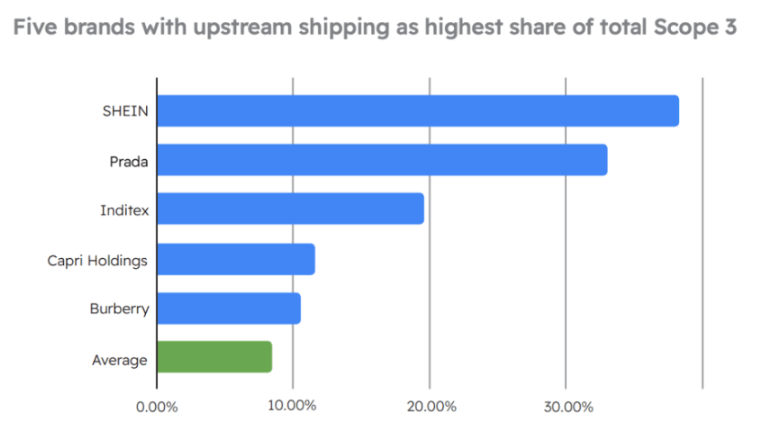
The logistics footprint โ€” especially Scope 3 emissions from transportation and deliveries โ€” is a major contributor to SHEINโ€™s overall emissions profile. Exploring lowโ€‘carbon fuels like SAF is a practical step in addressing these emissions categories.

Shein upstream shipping
Source: Stand.earth

Pilots, Traceability, and Carbon Accounting

DHLโ€™s GoGreen Plus service lets customers increase the share of SAF blended into the fuel used in its air cargo network. Under the SHEIN agreement, partners like logistics providers, airlines, and certification frameworks team up. They work to allocate emissions reductions clearly for SHEINโ€™s reports.

SHEINโ€™s SAF initiatives include pilot programmes with cargo partners. In 2025, SHEIN procured 187.3 tonnes of SAF for use on 14 Atlas Air charter flights. This reduced an estimated 579.1 tonnes of COโ‚‚ equivalent emissions compared with conventional aviation fuel.

The company is also participating in a SAF pilot in China alongside China National Aviation Fuel (CNAF) and the Second Research Institute of Civil Aviation of China. SHEIN plans to procure SAF through Air China Cargo, using traceability systems to document SAF usage and related emissions benefits.

Moreover, SHEIN joined the World Economic Forumโ€™s Green Fuel Forward campaign. This campaign works to speed up SAF adoption in the Asia-Pacific region. It does this by building capacity, raising awareness, and encouraging collaboration.

Limited Supply, High Costs, Big Potential

Sustainable aviation fuel holds promise but also faces hurdles. Current SAF production capacity is limited, and costs remain significantly higher than conventional jet fuel. This makes widespread adoption difficult for many companies and airlines.

Because SAF is still a small part of the global aviation fuel supply, its current emissions impact is modest. SHEIN acknowledges that the emissions reductions from its initial SAF activities are limited relative to its total air transport footprint. But these pilots will help build experience and partnerships for broader future deployment.

Looking ahead, SAF market growth could ramp up as production capacity rises and regulatory and corporate demand increase. With strong annual growth rates, more companies might add SAF to their supply chains. This helps them meet climate goals and satisfy stakeholders.

For SHEIN, expanding SAF use through partnerships like DHLโ€™s GoGreen Plus could help the company gain operational insights, shape emissions accounting frameworks, and position itself as a participant in emerging lowโ€‘carbon logistics solutions.

Africaโ€™s $100B Carbon Opportunity: How Sovereign Markets Could Lead the World

Africaโ€™s carbon markets are growing fast. Governments, companies, and global institutions are paying more attention to the continentโ€™s carbon credit potential. Estimates from a renewable energy company’s research arm, Axina Group, show Africaโ€™s carbon market could reach $100 billion by 2030 and grow even more over time.

This growth depends on strong policies and good market systems. Countries that control how carbon credits are made, verified, and soldโ€”called sovereign carbon marketsโ€”can capture more value. This also helps them reach climate goals.

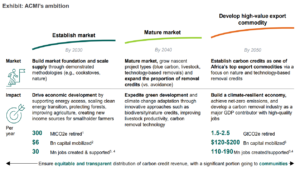
The Africa Carbon Markets Initiative (ACMI) sets a clear roadmap. It aims to produce 300 million carbon credits per year by 2030, growing to 1.5 billion credits per year by 2050. This could make Africa one of the worldโ€™s largest carbon credit producers.

Global organizations, including the World Bank, support this view. They point to Africaโ€™s natural resources and improving policies as key reasons for growth.

ACMI ambition
Source: ACMI report

Africaโ€™s Green Gold: Forests, Wetlands, and Carbon Sinks

Africa has huge natural carbon sinks. These include tropical forests, wetlands, and grasslands. They absorb carbon dioxide from the air, which forms the basis for carbon credits.

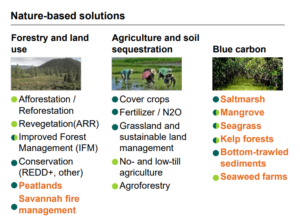
Tropical forests alone absorb 1.1โ€“1.5 billion tonnes of COโ‚‚ each year. Millions of hectares of land can also be restored. Projects like reforestation and improved land use create carbon credits. They also improve soil, water, and biodiversity, and provide jobs for local communities.

Nature-based solutions are expected to play a big role. Globally, they could deliver up to one-third of the emissions reductions needed by 2030. Africa has a large share of this opportunity. But today, the continent still produces a small part of global carbon credits, indicating there is room for strong growth.

Africa Nature-based solutions
Source: ACMI

Several companies and platforms are shaping Africaโ€™s carbon market by developing projects and linking them to buyers. For example, Africa Carbon Partners develops large natureโ€‘based projects that protect forests and generate verified credits across West and Central Africa.

Moreover, ZeroCarbon Africa connects smallholder farmers to global carbon markets with realโ€‘time tracking and fair pricing. Meanwhile, Climera uses blockchain technology to increase transparency in carbon credit issuance and tracking.

Other regional platforms like SB Power Africa and PanAfricaCarbon offer project development and trading services. In addition, global certification bodies like Verra support many African projects by certifying carbon credits under established standards.

From Voluntary Markets to Sovereign Systems

Most African carbon projects now operate in voluntary carbon markets (VCMs). Companies buy credits to offset emissions they cannot eliminate. But Africa accounts for only 9โ€“11% of retired carbon credits in recent years.

Sovereign carbon market systems can change this, with governments taking a central role. They set rules, approve projects, and manage sales. This improves transparency and ensures projects meet national climate goals, also called Nationally Determined Contributions (NDCs) under the Paris Agreement.

Countries such as Kenya, Nigeria, and Gabon are already building national carbon strategies. These strategies aim to capture more value locally. Projects often include rules that share revenue with governments and communities. This can fund local services, climate projects, and economic development.

The AFRICA RISING 2026 report by Axina Group projects specific national revenue from carbon-related assets using sovereign systems. For example:

  • Ghana could generate $1.8โ€ฏbillion annually by 2030
  • Nigeria could capture over $400โ€ฏmillion annually
  • Tanzania could reach over $120 million annually
  • Mozambique and Uganda also show potential for substantial carbon-linked revenue

These figures illustrate how sovereign systems can keep capital on the continent while encouraging local reinvestment and community benefits.

$100B Carbon Opportunity and Millions of Jobs

Carbon markets are expanding worldwide. The global carbon market reached about $949 billion in 2023. Voluntary carbon markets alone could grow to $10โ€“40 billion by 2030. Carbon removal markets could reach $100 billion per year by 2030โ€“2035, driven by industries like technology, finance, and aviation.

Africaโ€™s projected $100 billion market by 2030 would make it one of the fastest-growing regions. High-quality carbon credits are in demand as companies try to reach net-zero emissions.

Carbon markets can also create many jobs. The ACMI estimates 30 million jobs by 2030, rising to over 110 million by 2050. Jobs include forest restoration, renewable energy projects, land management, and monitoring.

More notably, carbon finance can attract private investment. Many African countries have funding gaps for climate projects. Carbon markets offer a way to bring in private capital.

Revenue from carbon credits can also support communities. At $50 per tonne, nature-based projects could generate $15 billion annually. At $100 per tonne, this could rise to $57 billion. These projects create millions of jobs while helping the environment.

By integrating sovereign systems, individual countries can capture larger shares of these revenues. The AFRICA RISING 2026 report highlights that, with proper frameworks, countries like Ghana, Nigeria, and Tanzania could earn hundreds of millions to billions annually from carbon assets. This shows the economic value of combining policy, technology, and natural resources.

How Africa Could Lead Globally

Africa has a unique advantage. It has large carbon sinks and relatively low historical emissions compared to developed regions. This means it can grow carbon projects while still meeting climate targets.

If ACMI and country-level strategies succeed, Africa could become a major global supplier of carbon credits. Companies worldwide will need these credits to meet net-zero goals.

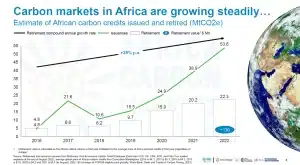
Africa carbon markets grow steadily

Nature-based carbon projects also deliver co-benefits. They improve soil, water, and biodiversity. They support rural livelihoods and local economies. This makes carbon markets a climate and development tool at the same time.

Trust, Fairness, and the Rules of the Game

However, challenges remain. Market integrity is key: Buyers need to trust that credits represent real, permanent emissions reductions.

There are concerns about fairness. Critics warn of โ€œcarbon colonialism,โ€ where wealthy countries benefit more than local communities. Policies must ensure communities get a fair share of revenue.

Also, policy gaps exist. Many countries lack clear rules for carbon markets, which can scare investors. Infrastructure and technical tools, such as land management systems and data monitoring, are still developing. Carbon prices vary depending on project type and quality, adding uncertainty.

To succeed, African governments need strong laws, clear policies, and transparent systems. Partnerships with international organizations can build technical expertise. Monitoring, reporting, and verification (MRV) systems are crucial to ensure credibility.

A Defining Decade Ahead for Africaโ€™s Carbon Markets

Africaโ€™s carbon market is at a turning point. The next ten years will shape how the sector grows and how much it benefits the economy and climate.

If plans succeed, Africa could produce hundreds of millions of carbon credits annually. This would support global climate goals, attract investment, create jobs, and drive sustainable development.

The marketโ€™s size depends on policy, pricing, and execution, but demand for carbon credits is rising. Africa has the natural resources to meet that demand. With the right systems, the continent can turn its carbon potential into a long-term economic and climate advantage.

U.S. Biofuel Market 2026: Can EPA Policies Offset War-Driven Volatility?

The U.S. biofuel industry stepped into 2026 with strong policy backing and rising demand. However, global events quickly changed the tone. A sharp escalation in the USโ€“Israelโ€“Iran conflict in late February sent shockwaves through energy markets. Oil prices jumped, supply chains tightened, and uncertainty spread across fuel markets.

At the same time, the U.S. Environmental Protection Agency (EPA) introduced its most ambitious biofuel policy yet under the Renewable Fuel Standard (RFS). This created a powerful but complicated mixโ€”long-term policy certainty collided with short-term geopolitical chaos.

As a result, the U.S. biofuel sector now faces a defining moment. Growth looks strong on paper, but rising costs and market volatility are testing how sustainable that growth really is.

EPA Administrator Lee Zeldin said:

“President Trump promised a Golden Age of American agriculture. Once again, his administration is delivering. Overall, โ€˜Set 2โ€™ creates a larger, more stable, and more reliable domestic market for U.S. crops, strengthening farm income and rural economies.ย 

For 20 years, this program has diversified our nationโ€™s energy supply and advanced American energy independence. EPA is proud to deliver on this mission and to do so at historic levels.”

EPAโ€™s RFS โ€˜Set 2โ€™ Rule Changes the Game

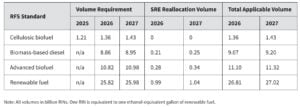
Amid this volatility, U.S. policy took a decisive turn. On March 26, 2026, the EPA finalized the Renewable Fuel Standard (RFS) โ€œSet 2โ€ rule, setting new blending targets for 2026 and 2027.

  • The new requirements are the highest in the programโ€™s history. The EPA set total renewable volume obligations at 26.81 billion RINs for 2026 and 27.02 billion RINs for 2027.

These targets reflect a major increase compared to previous years and signal a strong push toward domestic biofuel production.

  • The policy focuses heavily on expanding the use of biomass-based diesel, including biodiesel and renewable diesel. This includes a 70 percent reallocation of small refinery exemptions granted for 2023โ€“2025
  • At the same time, ethanol blending levels remain stable at 15 billion gallons annually, providing consistency for corn producers.

Additionally, the rule puts back 70% of the biofuel volumes that small refineries didnโ€™t have to blend from 2023 to 2025. This effectively increases the burden on refiners while ensuring that biofuel demand remains strong.

us biofuel
Source: EPA

Policy Pivot Favors U.S. Biofuel Producers

Beyond volume targets, the EPA introduced structural changes. The agency removed renewable electricity from the RFS program, narrowing its focus to liquid and gaseous fuels. It also introduced measures to limit the role of foreign feedstocks in the future.

Starting in 2028, imported biofuels will receive a lower compliance value compared to domestic products. In addition, incentives such as the 45Z tax credit are designed to favor U.S.-based production.

The broader goal is clear. The policy aims to strengthen energy independence, support farmers, and reduce reliance on foreign oil. Estimates suggest that these measures could cut oil imports by hundreds of thousands of barrels per day over the next two years.

At the same time, the EPA expects significant economic benefits. The rule could generate billions of dollars for rural economies and create thousands of new jobs across agriculture and manufacturing sectors.

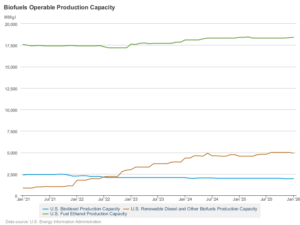
The U.S. Energy Information Administration (EIA) recently published updated data on the countryโ€™s biofuel production capacity, shown below.

us biofuel
Source: EIA

Demand Surges but Supply Faces Pressure

While policy is driving demand higher, supply conditions remain tight. The U.S. biofuel market is projected to exceed $41 billion in 2026, supported by transportation demand and decarbonization goals.

us biofuel market size

Ethanol continues to dominate the market, especially through E10 fuel blends. However, advanced biofuels such as renewable diesel and SAF are growing faster due to stronger policy incentives and rising interest in low-carbon fuels.

Despite this growth, feedstock availability is becoming a major concern. Domestic sources such as soybean oil, used cooking oil, and tallow are under pressure. Prices have risen sharply due to limited supply and increased competition from both the fuel and food industries.

At the same time, import restrictions have reduced access to cheaper global feedstocks. Tariffs and lower compliance values for foreign inputs are shifting the market toward domestic sourcing. While this supports local producers, it also reduces flexibility during supply shortages.

New processing capacity is helping to ease some of the pressure. Agribusiness companies are expanding oilseed crushing operations, and renewable diesel plants are increasing output. However, these efforts may take time to fully balance supply and demand.

War-Driven Oil Shock Makes Biofuels More Valuable

The U.S. biofuel market is gaining momentum as rising oil prices and global conflict reshape energy choices. The ongoing U.S.-Israel-Iran war has disrupted key oil infrastructure and shipping lanes near the Strait of Hormuz, sending crude prices sharply higher.

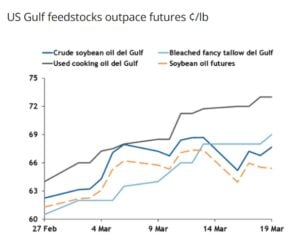
As conventional fuels become more expensive, alternatives like ethanol, renewable diesel, and sustainable aviation fuel (SAF) are increasingly attractive, driving demand across the sector. This surge has pushed feedstock costs to multi-year highs, with soybean oil, used cooking oil, and animal fats climbing steadily.

At the same time, renewable fuel credits, or RINs, have reached levels not seen in years, boosting margins for biofuel producers but raising compliance costs for refiners. Reports from Argus Media show that U.S. renewable diesel feedstocks hit their highest prices in over two years this month, highlighting the marketโ€™s sensitivity to war-driven disruptions.

While industry groups argue that strong domestic production stabilizes supply and reduces reliance on imported oil, refiners warn that these rising costs could eventually reach consumers, especially in regions with less competition. The combination of strong demand, tight supply, and geopolitical risk is redefining U.S. biofuel market dynamics.

biofuel prices
Source: Argus Media

Opportunities for Farmers, Challenges for Refiners

The current landscape is creating both opportunities and challenges.

Biofuel producers and farmers are seeing strong benefits. Higher demand for crops like corn and soybeans is supporting agricultural incomes. Investment in renewable fuel projects is also increasing, driven by policy certainty and market growth.

However, refiners and fuel distributors are facing tighter margins. The cost of compliance, combined with volatile feedstock prices, is making operations more difficult. Smaller players may struggle to compete in this environment.

Consumers could also feel the impact through higher fuel prices, especially if cost pressures continue. To manage these risks, many companies are turning to hedging strategies. Storage, long-term contracts, and flexible sourcing are becoming essential tools in navigating market uncertainty.

Supporting this announcement, U.S. Secretary of Agriculture Brooke L. Rollins, said:

โ€œTodayโ€™s announcement is truly historic for our nationโ€™s farmers and energy producers. These numbers represent the highest levels of biofuels ever required to be blended into our fuel supply. With President Trump and Administrator Zeldinโ€™s leadership, theseย historically high volumesย are expected to create aย $3 to $4 billion dollar increase in net farm income. The Renewable Fuel Standard Set 2 Rule will create a $31 billion dollar value for American corn and soybean oil for biofuel production in 2026, which is $2 billion more than in 2025. Our farmers are stepping up to grow American energy dominance.โ€

Strong Growth, But Uncertain Path

Looking ahead, the U.S. biofuel market is expected to grow steadily, with projections showing annual growth of up to 10% through the next decade. Strong EPA mandates and supportive policies will continue to drive demand.

However, the path forward is far from stable.

The mismatch between long-term policy goals and short-term geopolitical disruptions will remain a key challenge. Events like the ongoing Middle East conflict can quickly shift market dynamics, creating sudden price swings and supply risks.

The rest of 2026 will depend on several key factors, including potential EPA waivers, movements in RIN markets, and developments in global energy supply. In the end, the success of U.S. biofuels will depend on balance. Policy support provides a strong foundation, but flexibility will be critical in managing real-world challenges.

Despite the industry growing fast, the question remainsโ€”can it handle the pressure of both policy ambition and global uncertainty at the same time?

TotalEnergies and Masdarโ€™s $2.2 Billion Deal Signals a Big Push into Asiaโ€™s Renewable Energy Boom

Asia is entering a new energy era. Electricity demand is rising fast, and global energy giants are moving quickly to secure their position. A major $2.2 billion joint venture between TotalEnergies and Masdar reflects this shift. The deal is not just about building renewable assets. It is about capturing one of the biggest growth stories in global energy.

The simple reality is: Asia will drive most of the worldโ€™s electricity demand in the coming decade.

TotalEnergies and Masdar: A Power Partnership Built for Scale

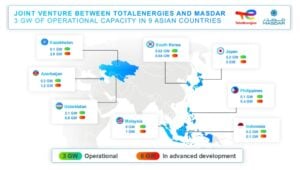
The new joint venture brings together the strengths of both companies under a single platform. It creates a 50:50 partnership that will manage onshore renewable energy assets across nine countries. These include Indonesia, Japan, South Korea, and several fast-growing markets in Southeast Asia and Central Asia.

The platform already holds 3 gigawatts (GW) of operational capacity. On top of that, it has a pipeline of 6 GW expected to come online by 2030. This combination gives the venture a strong starting point and a clear growth path.

More importantly, the focus goes beyond just building solar or wind farms. The joint venture plans to integrate solar, wind, and battery storage systems. This approach supports grid stability and ensures a reliable energy supply. As renewable energy expands, such integration becomes essential.

This is not a small regional project. It is a large, coordinated effort designed to meet rising demand while supporting cleaner energy systems.

totalenergies MASDAR
Source: TotalEnergies

His Excellency Dr Sultan Al Jaber, UAE Minister of Industry and Advanced Technology and Chairman of Masdar, noted:

โ€œThe UAE has established itself as a global energy leader by delivering at scale, investing with conviction, and building partnerships that endure. Masdar epitomizes that approach. We are proud to have pioneered renewable energy deployment in Central Asia and the Caucasus, and we have an expanding portfolio in some of the most attractive growth markets in Asia-Pacific. Asia will be the main driver of global electricity demand growth this decade, and this collaboration with TotalEnergies will accelerate our progress across the continent, unlocking new opportunities to deliver the competitive, reliable energy solutions that our partners and customers need.”

Asiaโ€™s Electricity Boom Is Reshaping Markets: Wood Mackenzie’s Analysisย 

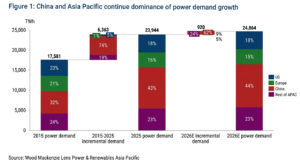
Asia has become the engine of global electricity demand. Over the past decade, the region accounted for nearly all new power demand compared to the United States and Europe.

In 2025, the scale reached a historic milestone. As per Wood Mac’s Asia Pacific Power & Renewables: What to look for in 2026 report, China alone generated over 10,000 terawatt-hours (TWh) of electricity. That was more than the combined output of the U.S. and Europe. At the same time, the rest of Asia continued to produce more electricity than either region year after year.

This growth is not random. It is driven by three powerful forces: rapid industrial expansion, urban population growth, and rising digital infrastructure.

Data centers are now a major driver. As artificial intelligence and cloud computing expand, electricity demand is rising sharply. Countries like Japan, China, and those in Southeast Asia are seeing new demand from this sector alone.

  • For example, Japan could add up to 66 TWh of demand from data centers by 2034. China may need an extra 668 TWh by 2030. Southeast Asia will also see steady increases as digital services grow.

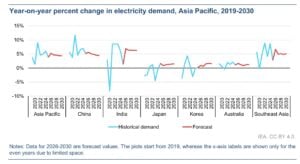
Even short-term slowdowns have not changed the bigger picture. In early 2025, trade tensions and tariffs slowed demand growth. Chinaโ€™s power demand growth dropped to 2.5% in the first quarter. India and Southeast Asia also saw weaker numbers.

wood mackenzie asia report

However, the slowdown did not last long. By the third quarter, demand rebounded strongly. China recorded over 6% growth again. India and Southeast Asia also recovered, supported by industrial output and extreme heat driving cooling needs.

This resilience shows that Asiaโ€™s demand growth is not fragile. It is deeply rooted in economic and technological change.

Clean Energy Expansion Keeps Pace

As demand rises, clean energy is expanding quickly across Asia.ย IEA predicts that by 2030, 56% of the worldโ€™s electricity use will be in the Asia Pacific, up from 53% in 2025.

asia pacific clean energy renewable energy
Source: IEA

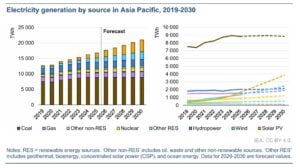
In 2025 alone, the region added nearly 500 GW of wind and solar capacity. This shows strong momentum toward decarbonization.

Governments are also playing a key role. Many countries are introducing policies that allow renewable energy to reach consumers directly. These steps make clean power more accessible and encourage further investment.

However, challenges remain. Supply chain bottlenecks and trade barriers continue to create uncertainty. Equipment shortages, especially for gas turbines, could slow down parts of the energy transition. At the same time, global political shifts are affecting trade flows and investment decisions.

Despite these issues, the overall direction is clear. Clean energy is growing, and it is becoming central to Asiaโ€™s power systems.

renewable energy

Strategic Moves in a Competitive Market

The partnership between TotalEnergies and Masdar reflects a deeper strategy. Both companies are positioning themselves for long-term growth in high-demand markets.

For TotalEnergies, the deal supports its Integrated Power strategy. This approach combines renewable generation with flexible energy solutions and market access. It helps the company manage supply and demand more effectively.

For Masdar, the partnership strengthens its presence across Asia. It also brings the advantage of working with a global energy major. This combination improves its ability to scale projects and enter new markets.

Leadership also highlights the importance of this collaboration. Dr. Sultan Al Jaber, Chairman of Masdar, emphasized that Asia will drive global electricity demand growth. He also pointed out that partnerships like this will help deliver reliable and competitive energy solutions.

The choice of Abu Dhabi as the control hub adds another layer of significance. It shows how the UAE is expanding its role in global energy markets, especially in clean energy investments.

The Road Ahead: Demand, Data, and Decarbonization

Looking forward, Asia will remain the dominant force in global electricity demand. By 2026, the region is expected to account for about 85% of new power demand worldwide. This is a massive share, especially as the U.S. and Europe also increase their demand due to AI and data centers.

China will continue to lead in absolute terms. However, India and Southeast Asia will play equally important roles as growth engines. Together, they will shape the regionโ€™s energy future.

At the same time, the energy transition will face key questions:

  • Can renewable energy keep up with rising demand?
  • Will supply chain issues slow progress?
  • How will countries balance growth with sustainability?

The answers will define the next phase of Asiaโ€™s energy story.

Thus, the $2.2 billion joint venture is a signal of where the energy world is heading. Companies are not just building power plants. They are building platforms that combine scale, technology, and market access.

Asia offers the biggest opportunity, but it also demands smart execution. Projects must be large, reliable, and integrated. They must support both growth and sustainability.

And this is why partnerships like the one between TotalEnergies and Masdar matter. They bring together capital, expertise, and long-term vision.

DOE and Amazon Partner to Secure Critical Minerals Through AI-Driven Recycling

The U.S. Department of Energy is intensifying efforts to secure critical minerals as global supply risks rise. In a new collaboration, the DOEโ€™s Ames National Laboratory and the Critical Materials Innovation Hub have joined hands with Amazon to recover high-value materials from waste.

The partnership focuses on extracting battery-grade graphite and key minerals from discarded textiles and electronic waste. This move reflects a broader U.S. strategyโ€”reduce import dependence, build domestic capacity, and create a circular supply chain for critical materials.

Assistant Secretary of Energy (EERE) Audrey Robertson, leading DOE’s Office of Critical Materials and Energy Innovation, said:

โ€œAt scale, the recovery of critical minerals from end-of-life technologies and textile waste has the potential to transform our domestic critical materials supply chains. This pioneering work, made possible by an exciting new partnership with Amazon, supports the Trump Administrationโ€™s efforts to reduce our reliance on foreign imports and strengthen our national security.โ€

U.S. Aims for Domestic Graphite Supply

The collaboration combines materials science with artificial intelligence. Ames Lab and CMI bring decades of expertise in metals refining and advanced materials. Amazon contributes AI, logistics, and large-scale supply chain capabilities.

Ames Laboratory Director Karl Mueller also noted,

“This is an excellent match for Ames National Laboratory’s deep expertise in materials science. For decades, Ames Lab has led the nation in metals refining, purification, and critical materials researchโ€”and applying that strength to real-world challenges.”

Turning Textiles into Battery-Grade Graphiteย 

A major project aims to convert discarded textiles into battery-grade graphite. This is significant because graphite is essential for lithium-ion batteries used in electric vehicles (EVs) and energy storage systems.

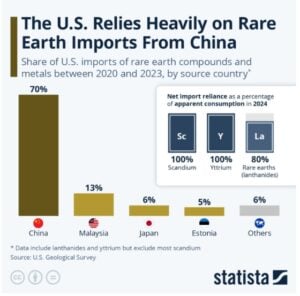
Today, the U.S. remains heavily dependent on imports for graphite. In fact, more than 90% of global battery-grade graphite processing is concentrated in China, creating a major supply risk.

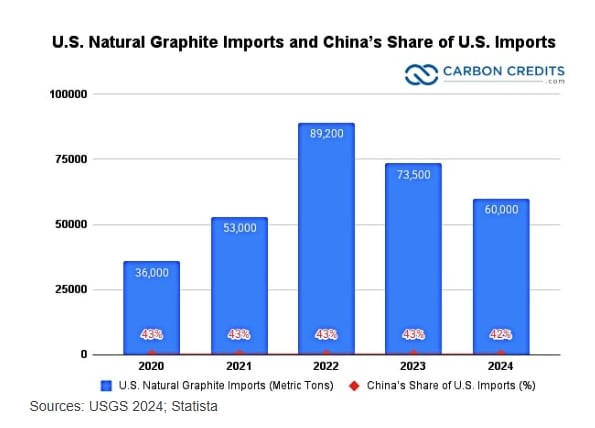
  • As of 2024, the U.S. imported aboutย 60,000 metric tons of natural graphite, down from roughly 84,000 tons in 2023.
  • China remained the largest supplier, accounting for aroundย 67.6% of all natural graphite imports by value.

This is worth roughly $375 million. It representsย a slight decrease in volume but still a dominant share of the market.

US graphite

By extracting graphite from waste, the U.S. can reduce both landfill pressure and foreign dependence. This approach aligns with the DOEโ€™s push to secure materials from โ€œsecondary sourcesโ€ such as waste streams.

AWS Powers AI-Driven Mineral Recovery

A second initiative focuses on recovering minerals like gallium from end-of-life IT hardware. Gallium is a critical input for semiconductors, power electronics, and defense technologies.

The importance of this effort is clear. In recent years, China has restricted exports of gallium and germanium, disrupting global supply. These restrictions effectively removed up to 90% of global gallium supply from international markets, exposing major vulnerabilities.

Here, Amazon Web Services will deploy AI tools to map supply chains, identify recovery opportunities, and assess economic feasibility. At the same time, CMI researchers will develop efficient extraction and refining methods.

This fusion of AI and materials science could transform recycling. Instead of being discarded, old electronics could become a reliable domestic source of critical minerals.

A Fragile Supply Chain: Why the U.S. Is Acting Now

Critical minerals are the core of modern industriesโ€”from EVs and renewable energy to semiconductors and defense systems. However, U.S. supply chains remain highly vulnerable.

According to recent industry analysis:

  • The U.S. is 100% import-reliant for at least 13 critical minerals
  • Over 20 additional minerals have an import dependence above 50%
  • The country exports much of its raw materials for processing overseas due to limited domestic capacity

China dominates refining and processing, backed by decades of industrial policy. This concentration creates risks of supply disruptions, price spikes, and geopolitical leverage.

us critical minerals imports

To address this, the U.S. government is mobilizing large-scale investments. In 2025, the DOE announced nearly $1 billion in funding to strengthen domestic critical mineral supply chains, with a strong focus on battery materials processing and recycling.

Additionally, new initiatives such as strategic stockpiles and international partnerships are being developed to secure long-term supply.

CMI Hub Leads the Shift to Circular Supply Chains

The Amazonโ€“DOE partnership reflects a major shift in strategy. Traditionally, supply security depended on mining new resources. Now, recycling and โ€œurban miningโ€ are becoming equally important.

The CMI Hub is leading this transition through research in:

  • Expanding material supply sources
  • Developing substitutes for scarce minerals
  • Recovering materials from waste
  • Accelerating the commercialization of new technologies

Recycling offers several advantages. It is faster to deploy than mining, less environmentally damaging, and often more cost-effective in the long run. For example, the U.S. has already committed funding to advanced graphite recycling projects to build domestic battery supply chains.

CMI Hub Director Tom Lograsso

“This collaboration is a natural extension of the expertise that CMI Hub was created to deliver. CMI’s mission is to move breakthrough materials technologies from the laboratory into real-world applications on timelines that meet industry’s needs. Working with Amazon gives us the opportunity to apply our capabilities at scaleโ€”combining CMI’s materials science expertise with Amazon’s AI to turn innovations into practical solutions that strengthen the nation’s critical materials supply chains.”ย 

Publicโ€“Private Partnerships Drive Scale

This collaboration also highlights a broader trendโ€”closer ties between government research institutions and private companies.

Amazon brings AI, data analytics, and global logistics. Ames Lab and CMI contribute scientific expertise and research infrastructure. Together, they aim to move solutions from the lab to real-world deployment at scale.

Such partnerships are critical because the challenge is not just technical. It also involves economics, infrastructure, and supply chain coordination. By combining strengths, these collaborations can accelerate innovation and reduce risks.

Conclusion: A Strategic Shift With Global Impact

The U.S. is clearly redefining its critical minerals strategy. Instead of relying only on mining, it is tapping into waste as a new resource base.

This approach offers strong advantages:

  • Waste streams are abundant and underutilized
  • Recycling reduces environmental impact
  • Domestic recovery improves supply security

However, challenges remain. Domestic processing capacity is still limited, and scaling recycling technologies will require sustained investment and policy support.

At the same time, AI is emerging as a key enabler. It can optimize recovery processes, improve efficiency, and reduce costs. As adoption grows, it could become a critical tool in securing mineral supply chains.

And the partnership between the DOE, Ames Lab, CMI, and Amazon marks a turning point in how the U.S. approaches critical minerals.

Google Expands SAF Strategy with Amex GBT and Shell Aviation to Cut Aviation Emissions

Google is stepping up its climate strategy with a deeper commitment to sustainable aviation fuel (SAF). In a new long-term agreement with American Express Global Business Travel and Shell Aviation, the tech giant will source SAF environmental attribute data through the Avelia registry.

This move highlights a bigger trend. Corporations are no longer just offsetting emissionsโ€”they are actively shaping clean fuel markets. For Google, SAF is becoming a critical tool to cut emissions from business travel, one of the hardest sectors to decarbonize.

Vrushali Gaud, Global Director of Climate Operations, Google, said:

โ€œSustainable aviation fuel represents a critical unlock for decarbonizing the hard-to-abate aviation sector and we recognize the importance of long-term agreements to increase demand and expand its availability. We view this as a key opportunity to support the broader ecosystem through this book and claim effort, while making progress towards reducing our own aviation emissions.โ€

How โ€œBook and Claimโ€ Is Changing the Future of Aviation Fuel

SAF offers a clear advantage. It can reduce lifecycle greenhouse gas emissions by up to 80% compared to traditional jet fuel. That makes it one of the most promising solutions for aviation, a sector with limited low-carbon alternatives.

Googleโ€™s participation in the Avelia platform shows how corporate demand can drive supply. Avelia uses a โ€œbook and claimโ€ system, allowing companies to claim emissions reductions even if SAF is not physically used on their specific flight. Instead, SAF is added elsewhere in the fuel network, and the environmental benefits are tracked digitally using blockchain.

This system solves a major problemโ€”limited fuel availability. SAF supply is still concentrated in a few locations, while demand is global. By separating physical fuel use from emissions accounting, Avelia expands access and encourages broader adoption.

The platform has already made measurable progress:

  • Over 64 million gallons of SAF have been supplied globally
  • More than 590,000 tonnes of COโ‚‚ emissions avoided
  • Participation from 66 companies and airlines

These numbers signal growing momentum. More importantly, they show how digital infrastructure can accelerate climate solutions in traditional industries.

Beyond Flights: Googleโ€™s Broader Transport Strategy to Achieve Carbon-Neutral by 2030

Googleโ€™s SAF investment is only one part of a larger plan to cut transport emissions. The company is actively reducing the carbon footprint of both employee commuting and logistics.

Low-Carbon Commutes with EVsย 

It promotes low-carbon commuting by offering shuttle services, encouraging carpooling, and supporting public transit, cycling, and walking. At its campuses, Google is also investing heavily in electric mobility. By 2024, it had installed over 6,000 EV charging ports across the U.S. and Canada. In India, electric vehicles already make up nearly a quarter of its internal commuter fleet.

Greening Global Shipping with SAF

The company is also tackling emissions from shipping. In 2023, Google partnered with DHL through its GoGreen Plus program. This initiative used SAF to transport devices across major global markets. After a successful pilot, the partnership expanded into a long-term agreement.

At the same time, Google is investing directly in SAF production. In 2024, it joined the United Airlines Ventures Sustainable Flight Fund, a $200+ million initiative supporting next-generation fuel technologies. The fund backs companies like Viridos and Svante, which are working on advanced fuel and carbon capture solutions.

Google is also a member of the Sustainable Aviation Buyers Alliance, further strengthening its role in shaping demand for cleaner aviation fuels.

google emissions
Source: GOOGLE

The Reality Check: SAF Growth Faces Real Barriers

Despite strong corporate interest, SAF still faces significant challenges. Global production is rising fast, but not fast enough.

Production increased 24 times since 2021 and is expected to reach around 713 million gallons by the end of 2025. However, this still represents less than 1% of total jet fuel demand.

Even more concerning, growth may slow in 2026. According to the International Air Transport Association (IATA), production is expected to rise only modestly, reaching about 2.4 million metric tons. At the same time, costs remain highโ€”SAF can be two to five times more expensive than conventional fuel.

This price gap creates a major burden for airlines. In 2025 alone, SAF-related costs could reach $3.6 billion globally. Without stronger policy support, scaling production will remain difficult.

Policy and Market Shifts: A Fragmented Landscape

Policy support plays a crucial role in SAF growth, but global approaches remain uneven.

In the U.S., incentives are weakening. The Clean Fuel Production Tax Credit (45Z) will drop significantly in 2026, reducing financial support for SAF producers. This could slow investment and limit supply growth.

In contrast, Europe is pushing ahead. The ReFuelEU Aviation mandate requires a 2% SAF blend, while countries in Asia, including Singapore and Thailand, are introducing their own mandates starting in 2026.

This divergence creates uncertainty. Companies and producers must navigate different regulations across regions, making long-term planning more complex.

The Feedstock Challenge: The Biggest Bottleneck

Analysts say technology is not the main constraint for SAFโ€”feedstock is.

SAF relies on low-carbon raw materials such as waste oils, agricultural residues, and synthetic fuels. These resources are limited and already in demand from other sectors like renewable diesel and bioenergy.

As competition intensifies, sustainability standards are also becoming stricter. Producers must prove that their feedstocks are traceable and truly low-carbon. This means rapid expansion is unlikely in the short term. Instead, companies are expected to focus on gradual capacity growth and flexible production strategies.

Considering all the above factors, 2026 will not deliver a breakthrough but it will test the foundation of the SAF market. Three factors will define progress:

  • Policy credibility: Governments must provide stable, long-term incentives
  • Feedstock strategy: Companies need reliable and sustainable supply chains
  • Procurement innovation: Airlines and corporations must adopt smarter purchasing models

Momentum is building, but it remains selective. Only companies that align these elements will succeed as the market evolves.

Looking Ahead: Strong Demand Signals for 2030 and Beyond

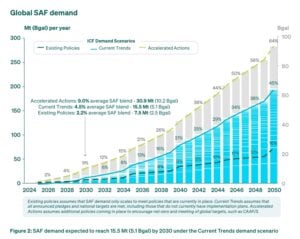
Despite the challenges, SkyNRGโ€™s SAF Market Outlook gives optimistic long-term projections. It highlights that the demand could reach 15.5 million metric tons by 2030 under current trends.

By 2050, SAF could supply up to 16% of global aviation fuel demand. It is equivalent to roughly 72 million tonnes (24 billion gallons)โ€”even without the introduction of new policy measures.

SAF
Source: SkyNRG

These numbers highlight one key point: demand is not the problem. The challenge lies in scaling supply efficiently and affordably. Nonetheless, sustainable aviation fuel holds real promise. It offers one of the few viable paths to reduce emissions in aviation without redesigning aircraft.

Googleโ€™s latest move shows how large corporations can accelerate this transition. But the road ahead remains complex. High costs, limited supply, and policy uncertainty continue to slow progress.

The bottom line is clear: SAF is not scaling overnight. But with the right mix of corporate demand, policy support, and innovation, it could become a cornerstone of clean aviation in the decades ahead.

History Repeating Itself: Why Middle East Conflict at the Pump Should Be a Wake-Up Call for North America

Disseminated on behalf of Surge Battery Metals.

Every time instability erupts in the Middle East, North Americans feel it where it hurts mostโ€”at the gas pump. It happened in 1979, when the Iranian Revolution sent shockwaves through global energy markets. Oil supplies tightened. Prices surged, and inflation followed.ย  Entire economies slowed under the pressure.ย 

For millions of households, the crisisโ€™s impact was personal. It showed up in longer lines at gas stations and rising costs across daily life.

Nearly five decades later, the pattern is repeating.

Renewed tensions across key oil-producing regions are once again tightening global supply. Prices are rising. Consumers are feeling the impact. And once again, events unfolding thousands of miles away are shaping the cost of energy at home.

This pattern suggests a persistent structural vulnerability in North Americaโ€™s exposure to global oilโ€‘supply shocks. The region still depends heavily on global oil markets. That means supply disruptions, no matter where they occur, can quickly ripple through the system.ย 

The result is a familiar cycle: geopolitical instability leads to supply concerns, which drive up prices, which then feed directly into the cost of living.

A Cycle Consumers Know All Too Well

When prices spike, households adjust. Commuters rethink travel. Businesses absorb higher costs or pass them on. Inflation pressures build. The impact spreads far beyond the energy sector.

With average gasoline prices currently around $4 per gallon in the US ($5.50 in California), or roughly $1.05 US per liter ($1.45 in California), the connection between global events and local fuel prices is no longer theoretical โ€“ it is a lived experience.ย This is why energy security is increasingly framed as both a policy concern and a kitchenโ€‘table issue.ย 

The events of 1979 were a warning. Todayโ€™s rising prices are another. The difference is that North America now has more options than it did back then.

Electric vehicles, battery storage, and renewable power systems are no longer future concepts. They are already part of the energy mix. And for those who have made the shift, the experience is very different, and the transition is already complete.

Instead of watching fuel prices climb, they are plugging in.

Graham Harris, Chairman of Surge Battery Metals, has spoken openly about this shift in practical terms. While rising oil prices create uncertainty at the pump, he charges his electric vehicle at home.ย 

The contrast between gasoline dependency and electrification is becoming more visible.

When oil prices rise, gasoline costs follow. But electricity prices tend to be more stable, especially when supported by domestic generation and renewable sources. That difference is simple but powerful. It changes how people experience energy volatility.

One system is exposed to global shocks. The other is increasingly tied to domestic infrastructure. This contrast highlights how the energy transition is reshaping exposure to global price shocks.

Some analysts increasingly frame the energy transition not only as a climate imperative but also as a strategy to reduce exposure to external risk. It relates to questions of control over where energy comes from, how it is produced, and how stable it is over time.

And at the center of that transition is one critical material: lithium.

Lithium: The Foundation of Energy Independence

Lithium is the core component of modern battery technology. It powers electric vehicles, supports grid-scale energy storage, and plays a growing role in advanced defense systems.

As electrification expands, demand for lithium is rising across multiple sectors.

But here is the challenge: much of todayโ€™s lithium supply still comes from outside the United States. This creates a familiar dynamic.

Just as oil dependency has long exposed North America to geopolitical risk, reliance on foreign lithium supply introduces a new layer of vulnerability. The commodity is different, but the structure is similar.

top US lithium import 2024 by country

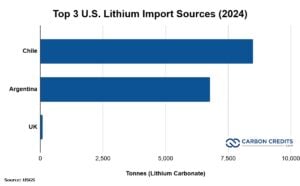
The United States imported the majority of its lithium from Chile and Argentina in 2024. Together, they accounted for roughly 98% of the total supply. Smaller volumes were sourced from the UK, France, and China.ย 

That is why domestic production is becoming a central focus of energy and industrial policy.

In March 2025, Donald Trump signed an executive order titled โ€œImmediate Measures to Increase American Mineral Production.โ€ The directive called for faster permitting, expanded development, and reduced reliance on foreign supply chains for critical minerals.

The message of the order was clear: building domestic capacity is now a strategic priority.

A Domestic Resource Takes Shape in Nevada

Within this broader shift, projects like Surge Battery Metalsโ€™ (TSX-V: NILI | OTCQX: NILIF) Nevada North Lithium Project (NNLP) are gaining attention.

NNLP hosts a measured and indicated resource of 11.24 million tonnes of lithium carbonate equivalent (LCE) at an average grade of 3,010 ppm lithium, based on company disclosures. This makes it the highest-grade lithium clay resource identified in the United States to date.

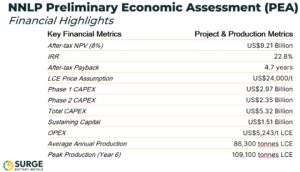
A 2025 Preliminary Economic Assessment (PEA) outlines the projectโ€™s scale:

  • After-tax NPV (8%): US$9.21 billion
  • Internal Rate of Return (IRR): 22.8%
  • Mine life: 42 years
  • Average annual production: ~86,300 tonnes LCE
  • Employment: ~2,000 construction jobs and ~350 long-term operational roles

Surge-NNLP-Preliminary-Economic-Assessment-PEA

These figures indicate potential in terms of scale, longevity, and the ability to contribute to domestic supply if the project moves forward. At full production, NNLP has the potential to rank among the larger lithium-producing assets globally, based on third-party analysis.

Recent drilling results announced by Surge Battery Metals have further strengthened NNLPโ€™s profile as a standout asset. In February 2026, step-out drilling found a 31-meter intercept with 4,196 ppm lithium from surface. This is much higher than the projectโ€™s average of 3,010 ppm Li. It also extends high-grade mineralization nearly 640 meters beyond the current resource boundary.

Infill drilling showed a steady, thick, high-grade core. It included intercepts like 116 meters at 3,752 ppm Li and 32 meters at 4,521 ppm Li. These results support future resource expansion. They also highlight the project’s scale, quality, and technical readiness as it prepares for a Pre-Feasibility Study.

Beyond the project itself, it reflects a broader policy and industry shift toward building more domestically anchored energy systems.

From Oil Dependency to Mineral Security

The connection between oil and lithium is not always obvious at first glance. Oil fuels internal combustion engines, while lithium supports batteries and energyโ€‘storage systems, with distinct technologies and supply chains.

But the underlying issue is the same. Dependence on external sources creates exposure to external risk.

In the case of oil, that risk has played out repeatedly over decades. Supply disruptions, price shocks, and geopolitical tensions have all shaped the market.

With lithium, the industry is earlier in its development. But the stakes are rising quickly.

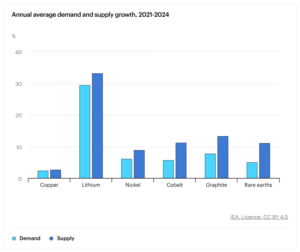
Global demand for lithium grew about 30โ€ฏ% in 2024, driven mainly by batteries for electric vehicles and energy storage, according to IEA data. Demand in 2025 continued at high rates, and under current policies, lithium demand is projected to grow fivefold by 2040 compared with today.ย 

lithium demand and supply 2024 iea

At the same time, supply growth is struggling to keep pace with demand forecasts. These trends show that ensuring a stable, secure supply is becoming just as important as expanding production.

That is where domestic projects come in, such as Surge Battery Metalsโ€™ NNLP.ย 

They may not eliminate global market dynamics, but they can reduce exposure to them. They can provide a buffer against volatility. And they can support a more stable, self-reliant energy system.

A Turning Point – or Another Warning?

While history does not repeat in the same way, similar patterns can be observed.

The oil shocks of the 1970s revealed a vulnerability that shaped energy policy for decades. Todayโ€™s market signals are pointing to a similar challengeโ€”this time at the intersection of oil dependency and critical mineral supply.

The difference is that the range of policy and technological options available today is broader. Electrification is already underway. Battery technology is advancing. Domestic resource development is gaining policy support. The pieces are in place.

Data from the International Energy Agencyโ€™s Global EV Outlook 2025 shows that global battery demand reached a historic milestone of 1 terawatt-hour (TWh) in 2024. This surge was mainly due to the growth of electric vehicles (EVs).ย 

EV battery demand by region 2024 iea

By 2030, demand is expected to more than triple, exceeding 3 TWh under current policies. This reflects not only rising EV adoption but also expanding stationary storage demand. Both of which rely on critical minerals like lithium.

Electric vehicles continue to displace traditional oil use as well. The same IEA analysis shows that by 2030, EVs will replace over 5 million barrels of oil daily. This is about the size of a major country’s transport sector, highlighting how electrification is changing energy markets.

What remains uncertain is the pace at which these changes will occur.

Will rising fuel prices once again fade as markets stabilize? Or will they serve as a catalyst for deeper structural shifts?

That question matters not just for policymakers or investors, but for everyday consumers.

Because at the end of the day, energy transitions are not measured in policy papers. They are measured in daily decisionsโ€”how people power their homes, fuel their vehicles, and respond to rising costs.


DISCLAIMERย 

New Era Publishing Inc. and/or CarbonCredits.com (โ€œWeโ€ or โ€œUsโ€) are not securities dealers or brokers, investment advisers, or financial advisers, and you should not rely on the information herein as investment advice. Surge Battery Metals Inc. (โ€œCompanyโ€) made a one-time payment of $75,000 to provide marketing services for a term of three months. None of the owners, members, directors, or employees of New Era Publishing Inc. and/or CarbonCredits.com currently hold, or have any beneficial ownership in, any shares, stocks, or options of the companies mentioned.

This article is informational only and is solely for use by prospective investors in determining whether to seek additional information. It does not constitute an offer to sell or a solicitation of an offer to buy any securities. Examples that we provide of share price increases pertaining to a particular issuer from one referenced date to another represent arbitrarily chosen time periods and are no indication whatsoever of future stock prices for that issuer and are of no predictive value.

Our stock profiles are intended to highlight certain companies for your further investigation; they are not stock recommendations or an offer or sale of the referenced securities. The securities issued by the companies we profile should be considered high-risk; if you do invest despite these warnings, you may lose your entire investment. Please do your own research before investing, including reviewing the companiesโ€™ SEDAR+ and SEC filings, press releases, and risk disclosures.

It is our policy that information contained in this profile was provided by the company, extracted from SEDAR+ and SEC filings, company websites, and other publicly available sources. We believe the sources and information are accurate and reliable but we cannot guarantee them.

CAUTIONARY STATEMENT AND FORWARD-LOOKING INFORMATION

Certain statements contained in this news release may constitute โ€œforward-looking informationโ€ within the meaning of applicable securities laws. Forward-looking information generally can be identified by words such as โ€œanticipate,โ€ โ€œexpect,โ€ โ€œestimate,โ€ โ€œforecast,โ€ โ€œplan,โ€ and similar expressions suggesting future outcomes or events. Forward-looking information is based on current expectations of management; however, it is subject to known and unknown risks, uncertainties, and other factors that may cause actual results to differ materially from those anticipated.

These factors include, without limitation, statements relating to the Companyโ€™s exploration and development plans, the potential of its mineral projects, financing activities, regulatory approvals, market conditions, and future objectives. Forward-looking information involves numerous risks and uncertainties and actual results might differ materially from results suggested in any forward-looking information. These risks and uncertainties include, among other things, market volatility, the state of financial markets for the Companyโ€™s securities, fluctuations in commodity prices, operational challenges, and changes in business plans.

Forward-looking information is based on several key expectations and assumptions, including, without limitation, that the Company will continue with its stated business objectives and will be able to raise additional capital as required. Although management of the Company has attempted to identify important factors that could cause actual results to differ materially, there may be other factors that cause results not to be as anticipated, estimated, or intended.

There can be no assurance that such forward-looking information will prove to be accurate, as actual results and future events could differ materially. Accordingly, readers should not place undue reliance on forward-looking information. Additional information about risks and uncertainties is contained in the Companyโ€™s managementโ€™s discussion and analysis and annual information form for the year ended December 31, 2025, copies of which are available on SEDAR+ atย www.sedarplus.ca.

The forward-looking information contained herein is expressly qualified in its entirety by this cautionary statement. Forward-looking information reflects managementโ€™s current beliefs and is based on information currently available to the Company. The forward-looking information is made as of the date of this news release, and the Company assumes no obligation to update or revise such information to reflect new events or circumstances except as may be required by applicable law.


Disclosure: Owners, members, directors, and employees of carboncredits.com have/may have stock or option positions in any of the companies mentioned: .

Carboncredits.com receives compensation for this publication and has a business relationship with any company whose stock(s) is/are mentioned in this article.

Additional disclosure: This communication serves the sole purpose of adding value to the research process and is for information only. Please do your own due diligence. Every investment in securities mentioned in publications of carboncredits.com involves risks that could lead to a total loss of the invested capital.

Please read our Full RISKS and DISCLOSURE here.

Texas-Based EnergyXโ€™s Project Lonestarโ„ข Signals a Turning Point for U.S. Lithium Supply

Energy Exploration Technologies, Inc. (EnergyX), led by CEO Teague Egan, has moved the United States closer to building a reliable domestic lithium supply chain. The company recently commissioned its Project Lonestarโ„ข lithium demonstration facility in Texas, marking a key milestone in scaling direct lithium extraction (DLE) technologies.

This development comes at a time when lithium demand is rising sharply due to electric vehicles and energy storage systems. At the same time, the U.S. remains heavily dependent on foreign processing, particularly from China.

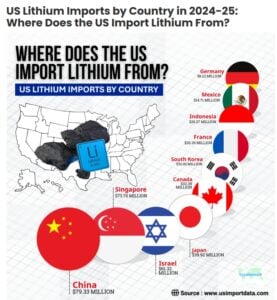
  • According to the US import dataย andย Lithium import data of the USA, the total value of US lithium imports reachedย $432.36 million in 2024, aย 9%ย decline from the previous year.
  • The total value of US lithium imports (cells & batteries) accounted forย $205.29 million in the first 6 months of 2025.

US lithium import

Against this backdrop, EnergyXโ€™s progress offers both technological validation and strategic value.

From Concept to Reality: How Project Lonestarโ„ข Works

Project Lonestarโ„ข is EnergyXโ€™s first major lithium project in the United States and its second globally. The demonstration plant, located in the Smackover region spanning Texas and Arkansas, is now operational and uses industrial-grade systems rather than small pilot equipment.

  • The facility produces around 250 metric tons per year of lithium carbonate equivalent (LCE).

While this output is modest compared to global supply, its importance lies in proving that EnergyXโ€™s proprietary GET-Litโ„ข technology can efficiently extract lithium from brine. The plant processes locally sourced Smackover brine, a resource that has historically been underutilized despite its lithium potential.

lithium lonestar energyX
Source: EnergyX

Unlike traditional lithium production, which often relies on hard-rock mining or evaporation ponds, DLE technology directly extracts lithium from brine using advanced filtration and chemical processes. This reduces production time and may lower environmental impact.

  • More importantly, the Lonestarโ„ข plant can supply 5 to 25 tons of battery-grade lithium samples to customers.

This allows battery manufacturers to test and validate the material before committing to large-scale supply agreements.

lithium energyX
Source: EnergyX

Scaling Up: From Demonstration to Commercial Production

The demonstration plant is only the first phase of a much larger plan. EnergyX aims to scale Project Lonestarโ„ข into a full commercial operation capable of producing 50,000 tonnes of LCE annually across two phases.

  • The first phase alone targets 12,500 tonnes per year, which would already place it among the more significant lithium producers in the U.S.
  • Significantly, the company has invested approximately $30 million in the demonstration facility, supported in part by a $5 million grant from the U.S. Department of Energy.
  • For the full-scale project, EnergyX estimates total capital expenditure at around $1.05 billion.

Cost metrics suggest strong economic potential. The company estimates capital costs at roughly $21,000 per tonne of capacity and operating costs near $3,750 per tonne. If these figures hold at scale, the project could compete effectively with global lithium producers, particularly in a market where cost efficiency is becoming increasingly important.

Teague Egan, Founder & CEO of EnergyX, said,

โ€œBringing the biggest integrated DLE lithium demonstration plant online in the United States is a foundational milestone for EnergyX and for U.S. domestic lithium production in general. This facility not only validates the performance of our technology on an industrial scale under real-world conditions, but also establishes EnergyX as the lowest cost producer in the U.S. Ultimately this benefits all our customers who need large volumes of lithium for EV and ESS applications, as well as any lithium resource owners looking to implement best-in-class DLE technology whom we are happy to license to.โ€

Breaking the Bottleneck: Why U.S. Refining Matters

One of the biggest challenges facing the U.S. lithium sector is not resource availability but refining capacity. While lithium deposits exist across the country, most battery-grade lithium chemicals are processed overseas.

China dominates this segment, controlling roughly 70 to 75 percent of global lithium chemical conversion capacity. This concentration creates a structural dependency. Even when lithium is mined in the U.S. or allied countries, it is often shipped abroad for processing before returning as battery materials.

Project Lonestarโ„ข directly addresses this gap. By integrating extraction and refining into a single domestic operation, EnergyX is working to build a complete โ€œbrine-to-batteryโ€ value chain within the United States. This approach could reduce reliance on foreign processing and improve supply chain resilience.

U.S. Senator Ted Cruz highlighted the projectโ€™s importance, noting that domestic lithium production supports both energy security and defense readiness, particularly for applications in advanced battery systems.

The Current Landscape: Limited Supply, Big Ambitions

How Much Lithium Does the U.S. Have?

The United States has a strong lithium resource base, but it still struggles to produce it at scale. Data from the United States Geological Survey shows that the country held about 14 million tonnes of lithium reserves in 2023, ranking it third globally.

Despite this, U.S. production remains very low. The country produced only 615 metric tonnes of lithium in 2023, according to USGS. This is tiny compared to global leaders. Australia produced around 86,000 tonnes, while Chile reached about 56,530 tonnes in the same year.

Lithium Reserves by Country 2026

LITHIUM GLOBAL
Source: World Population Review

In simple terms, the U.S. has plenty of lithium underground. But it still needs time, investment, and better infrastructure to turn those resources into a real supply.

Investment is flowing into regions such as Nevada, North Carolina, and Arkansas. If even a portion of these reserves is converted into production, the U.S. could significantly reduce its reliance on imported lithium.

Active Resources and Future Potential

At present, U.S. lithium production remains relatively small. The only active large-scale operation is the Silver Peak Mine in Nevada, which produces between 5,000 and 10,000 tonnes of LCE annually, depending on market conditions.

However, several projects are in development that could significantly expand capacity. The Thacker Pass project, for example, is expected to produce around 40,000 tonnes per year in its first phase once operational later in the decade.

In addition, brine-based developments in the Smackover region aim to produce tens of thousands of tonnes annually, with long-term plans exceeding 100,000 tonnes across multiple sites.

These projects indicate a shift from a niche domestic industry to a more substantial production base. Still, timelines remain uncertain due to regulatory and financial challenges.

lithium production USA

Demand Surge: Batteries Drive the Lithium Boom

The urgency to expand lithium production is driven by rapid growth in battery demand. Electric vehicles, renewable energy storage, and grid modernization are all increasing lithium consumption.

According to S&P Global, U.S. lithium demand is expected to grow at an average rate of 40 percent annually between 2024 and 2029. Canada is projected to see even faster growth, albeit from a smaller base, with demand rising by around 74 percent per year over the same period.

Globally, battery capacity is forecast to approach 4 terawatt-hours by 2030. This expansion highlights lithiumโ€™s central role in the clean energy transition. Without sufficient supply, battery productionโ€”and by extension, EV adoptionโ€”could face constraints.

lithium demand

Why Progress Takes Time

Turning lithium reserves into operational mines and processing facilities is not straightforward. Projects often face long permitting timelines, environmental scrutiny, and legal challenges. Financing can also be difficult, especially in a volatile commodity market.

Local opposition can further complicate development, particularly in areas with high environmental concerns. These factors can delay projects by several years, slowing the pace of expansion.

To address these barriers, the U.S. government is increasing its involvement through funding, policy support, and efforts to streamline permitting. The Department of Energyโ€™s backing of EnergyX reflects a broader strategy to accelerate domestic critical mineral development.

Conclusion: A Strategic Shift in Motion

Project Lonestarโ„ข represents a meaningful step toward reshaping the U.S. lithium landscape. By proving the viability of direct lithium extraction at an industrial scale, EnergyX has laid the groundwork for larger, commercially viable operations.

The project also aligns with national priorities around energy security, supply chain resilience, and clean energy transition. While challenges remain, the combination of technological innovation, government support, and rising demand creates a strong foundation for growth.

As the world moves toward electrification, lithium will remain at the center of the transition. Projects like Lonestarโ„ข show that the United States is beginning to close the gap between resource potential and real-world productionโ€”one facility at a time.

Canada Doles Out Almost C$29M for CCUS and Renewables as Clean Energy Market Surges

Canada has pledged nearly C$29โ€ฏmillion ($21.6โ€ฏmillion) to support carbon capture, utilization, and storage (CCUS) and renewable energy projects. The funding aims to back new technologies that reduce greenhouse gas emissions and make clean energy more competitive. This commitment was announced by the Canadian government in late March 2026 as part of ongoing efforts to meet climate goals.

The investment is small compared with Canadaโ€™s larger climate budget. But it signals continued federal support for emerging technologies and deployment of clean energy solutions. CCUS is one of several tools that nations are using to curb emissions while keeping energy supplies stable.

What Canada Is Funding? Inside the C$29M Clean Tech Bet

The C$29โ€ฏmillion pledge covers a mix of CCUS and renewable energy efforts. It is intended for 12 projects that capture carbon dioxide (COโ‚‚) from industrial emissions. It also supports systems that convert captured COโ‚‚ into usable products or store it underground so it cannot enter the atmosphere.

The Honourable Tim Hodgson, Minister of Energy and Natural Resources, said:

โ€œCanada is scaling up clean energy while strengthening our electricity grid and responsibly growing our conventional energy industry โ€” because competitiveness means doing more than one thing at the same time. We are investing to provide reliable, affordable and clean power across the country that will propel our economic growth, protect affordability for Canadian families and make Canada a low-risk, low-cost, low-carbon energy superpower.โ€

Carbon capture refers to systems that trap COโ‚‚ from power plants and factories before it is released. The captured gas can be stored deep underground or used in industrial processes, such as making building materials or fuels. Utilization means finding commercial uses for captured COโ‚‚ so that it has economic as well as environmental value.

Renewable energy projects in Canada focus on expanding wind, solar, hydro, and other lowโ€‘carbon power sources. As of 2024, about 79โ€ฏ% of Canadaโ€™s electricity generation came from lowโ€‘carbon sources, with hydropower alone accounting for roughly 55โ€ฏ%. The rest comes from wind, solar, and nuclear energy.

Carbon Captureโ€™s Strategic Role in Net Zero

Canada has a strong track record in CCUS deployment. Several largeโ€‘scale facilities already operate in the country, especially in Alberta and Saskatchewan.ย 

For example, the Quest Carbon Capture and Storage Project in Alberta captures about one million tonnes of COโ‚‚ per year and stores it deep underground.

carbon capture (CCUS) in Canada

Canadian CCUS technology accounts for a notable share of planned global capacity. Canadian projects represent about 11.5โ€ฏ% of planned CCUS storage capacity worldwide.

Notably, Canadaโ€™s carbon capture capacity could increase from about 4.4 million tonnes of COโ‚‚ per year to 16.3 million tonnes annually by 2030. However, much larger growth is still necessary to meet net-zero targets by 2050.

CCUS is considered critical for reducing emissions from hardโ€‘toโ€‘decarbonize sectors like heavy industry and oil and gas. It also plays an important role in achieving Canadaโ€™s longโ€‘term climate targets, including net-zero emissions by 2050. In these scenarios, CCUS helps bridge gaps that electrification and renewables alone cannot fill.

Canadaโ€™s Energy Innovation Program (EIP) is designed to speed up the development of clean energy technologies while keeping the energy system reliable and affordable. It supports early-stage research and development in CCUS.ย 

The program also funds renewable energy demonstration projects that test new ways to generate and integrate clean power, especially those with local benefits. In addition, EIP promotes innovation in electricity systems by supporting new approaches to smart grid regulation and capacity building.

A Power Mix Already Going Green

Renewable energy is another core part of Canadaโ€™s climate strategy. Over the last decade, installed renewable capacity has grown steadily. Between 2014 and 2024, Canadaโ€™s total renewable energy capacity increased from about 89,773โ€ฏMW to 110,470โ€ฏMW.

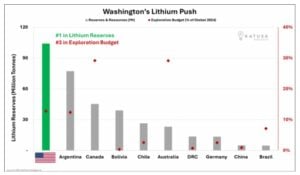
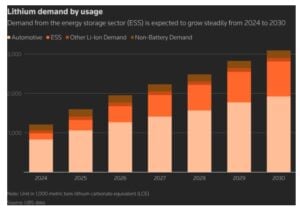
The federal government has supported renewable projects through multiple funding programs. Earlier initiatives included a $964โ€‘million investment targeting wind, solar, storage, hydro, and other renewable technologies.

Canada has also set decarbonization targets tied to renewables. The country aims for netโ€‘zero electricity by 2035, which supports a broader economyโ€‘wide goal of netโ€‘zero greenhouse gas emissions by 2050.

Canada net zero goals 2030 target

CCUS and Renewables on a Global Rise

Investment in CCUS and renewable energy is rising globally. According to industry forecasts, the global clean energy market โ€” including wind, solar, energy storage, and CCUS โ€” is expected to continue strong growth through 2030 as countries push toward climate targets.

For CCUS specifically, analysts project that global installed capacity could grow fivefold by 2030 as more projects move from demonstration to full deployment. Canada is among several countries with mature CCUS infrastructure and planned expansions.

global carbon capture 2030 growth
Source: Rystad Energy

Renewables continue to be the fastestโ€‘growing energy source globally. International agencies like the International Renewable Energy Agency (IRENA) project that renewable capacity will keep expanding rapidly through the end of the decade, driven by falling technology costs and climate commitments.

The Roadblocks to Scaling Clean Tech

While CCUS has potential, it also faces hurdles. Costs are high, and the technologies are still emerging at scale. Critics argue that CCUS has historically underperformed in some early projects, and that a significant amount of captured COโ‚‚ is used in enhanced oil recovery rather than stored permanently.

Some stakeholders also warn that public funds for CCUS must be carefully targeted to avoid subsidizing continued fossil fuel use rather than meaningful emission cuts. Despite these concerns, many policymakers see CCUS as an essential component of climate strategy if Canada is to meet its 2030 and 2050 goals.

Renewable energy projects also face challenges, including grid integration, siting barriers, and supply chain constraints for equipment like turbines and solar panels. However, continued funding and clear policy signals tend to reduce these barriers over time as markets mature.

Cutting Emissions While Keeping Energy Stable

Canadaโ€™s C$29โ€ฏmillion commitment fits into a broader pattern of public funding aimed at accelerating clean energy and decarbonization technologies. Larger federal efforts, such as the Net Zero Accelerator Initiative, provide billions of dollars over multiple years for clean tech, including CCUS deployment and industrial decarbonization.

The CCUS market is evolving from pilot projects to commercial opportunities. Meanwhile, renewable energy continues its growth as a mainstream power source. Together, these developments support Canadaโ€™s longโ€‘term climate and economic goals.

As the global energy landscape changes, investments in both CCUS and renewables help reduce emissions, create jobs, and build resilience in a lowโ€‘carbon economy. Canadaโ€™s latest funding pledge reinforces its ongoing role in these key markets.