The Brent Price extended its winning streak for a fifth consecutive week, trading at 65.90 USD per barrel on Friday, January 23, 2026. This represents a 3.25% increase over the last seven days and contributes to a robust 8.22% gain year-to-date. The benchmark crude contract has found fresh support amid renewed geopolitical instability in the Middle East and physical supply constraints in Central Asia, helping it recover from earlier bearish pressure caused by oversupply forecasts.
Brent Price
Unit: USD/Unit
---
---
Loading Chart...
Brent Price Market Drivers
The primary catalyst for this week’s bullish movement is the escalation of geopolitical rhetoric. President Trump’s recent warning regarding an "armada" heading toward Iran has reintroduced a significant risk premium to the market. Traders are reacting to fears that potential military action could disrupt oil flows from the Persian Gulf, a critical artery for global energy supply. This geopolitical friction has overshadowed earlier concerns about a global supply glut.
Compounding the supply-side anxiety is an ongoing outage at Kazakhstan’s giant Tengiz oilfield. The disruption has tightened immediate physical availability, forcing buyers to seek alternatives and supporting near-term prices. Additionally, a softening U.S. dollar—which slid toward its worst week in months—has made dollar-denominated crude cheaper for international buyers, further buoying demand.
Technical Outlook
Despite the recent rally, the technical ceiling for the Brent Price remains firm. While the momentum is positive, gains may be capped by the International Energy Agency’s (IEA) projections of a 3.7 million bpd stockpile build in 2026. Traders will be watching the $66.50 resistance level closely; a break above this could signal a shift in the longer-term trend, while failure to hold the $65 support could see prices retreat back toward the low $60s as fundamental oversupply concerns resurface.
Gold prices continued their historic ascent on Friday, surging to trade at $4,979.53 USD per ounce. The precious metal has delivered a stunning performance, gaining 8.19% over the last seven days and registering a remarkable 15.31% increase year-to-date. As investors flock to safe-haven assets amidst growing global economic uncertainty, gold is rapidly approaching the psychological resistance level of $5,000.
Gold Price
Unit: USD/oz
---
---
Loading Chart...
Market Drivers
The explosive move in the Gold Price this week can be attributed to three primary drivers:
Escalating Trade Tensions: Markets have been rattled by renewed fears of global trade wars following recent reports of expanding tariffs. Investors are hedging against potential supply chain disruptions and the inflationary pressures that trade barriers often trigger, driving capital into physical assets.
Aggressive Fed Rate Cut Expectations: Recent economic data suggesting a softening U.S. labor market has fueled speculation that the Federal Reserve may implement deeper interest rate cuts earlier than anticipated. Lower rates reduce the opportunity cost of holding non-yielding bullion and weigh heavily on the U.S. Dollar, boosting gold’s appeal.
Geopolitical Safe-Haven Demand: Continued geopolitical instability and sovereign debt concerns have accelerated the trend of central bank diversification. Institutional buying remains a critical floor for prices, amplifying the rally as retail sentiment follows suit.
Technical Outlook
Technically, gold is in uncharted territory, with the steep 8.19% weekly candle confirming strong bullish momentum. The immediate focus is now on the $5,000 psychological barrier. A breakout above this level could trigger a fresh wave of algorithmic buying. However, with the Relative Strength Index (RSI) entering overbought territory, traders should remain cautious of a potential short-term consolidation or pullback to support levels near $4,800 before the next leg higher.
The Silver Price has shattered historical records, surging past the psychological $100 mark to trade at $101.80 USD. In a week defined by extreme volatility and aggressive buying, the white metal has climbed 11.00%, capping a staggering 42.23% year-to-date rally. This historic breakout is being driven by a perfect storm of supply chain shocks and insatiable industrial demand, fundamentally reshaping the global precious metals market.
Silver Price
Unit: USD/oz
---
---
Loading Chart...
Market Drivers: Export Bans and Green Energy Demand
Two primary catalysts are fueling this unprecedented rally. First, China’s new export restrictions have severely tightened global supply. Effective January 1, 2026, Beijing implemented a strict licensing system for silver exports, authorizing only 44 companies to ship the metal. This policy has created an immediate bottleneck, reducing the flow of silver into Western markets just as inventories at the COMEX were already critically low.
Second, industrial consumption has reached a fever pitch. The solar photovoltaic (PV) sector is on track to install a record 665 GW of capacity this year, consuming over 125 million ounces of silver annually. Simultaneously, the rapid expansion of AI data centers has created a new, non-negotiable source of demand for silver’s superior conductivity in high-performance electronics. With the market entering its fifth consecutive year of structural deficit, buyers are scrambling to secure physical metal, driving premiums to record highs.
Technical Outlook: Blue Sky Territory
Technically, the Silver Price has entered “blue sky” territory after decisively clearing resistance at $100. Momentum indicators are currently flashing overbought conditions, but the sheer volume of buying suggests this is a structural repricing rather than a speculative bubble. Analysts suggest that if support holds above $98, the next immediate target could be $120. However, traders should remain cautious of short-term volatility given the speed of the recent ascent.
The Cobalt Price is currently trading at $28.15 USD per pound, holding steady with a 0.00% movement over the last seven days. Despite the quiet week, the market remains bullish year-to-date, posting a robust 6.63% gain since the start of 2026. After a volatile opening to the year, prices have entered a consolidation phase as buyers assess the sustainability of the recent rally prompted by supply-side constraints.
Cobalt Price
Unit: USD/lb
---
---
Loading Chart...
Market Drivers: DRC Quotas and Supply Tightness
The primary driver underpinning the current valuation is the continued impact of strict export quotas implemented by the Democratic Republic of Congo (DRC). Following the government’s intervention to cap exports and replace the previous ban with a quota system, global supply chains have tightened significantly. This structural shift has successfully drained excess inventories that plagued the market in previous years, transitioning the sector from oversupply to a delicate balance.
However, the 0.00% movement this week reflects a temporary standoff between buyers and sellers. Industrial consumers, particularly in the EV battery sector, are seemingly hesitant to chase prices higher after the sharp 6.63% YTD surge. Market reports indicate that trading activity slowed this week as major consumers utilized existing stockpiles rather than purchasing at spot rates. This pause allows the market to digest the new pricing reality of roughly $62,000 per tonne, with the DRC’s strategic supply management acting as a firm floor against significant downsides.
Technical Outlook
Technically, the Cobalt Price has established strong support around the $28.00 level. The flat performance this week suggests a consolidation pattern rather than a reversal. Given the YTD momentum and the fundamental supply deficit projected for later this quarter, the outlook remains cautiously optimistic. A breakout above $28.50 could signal the next leg higher, while a dip below $27.50 might trigger short-term profit-taking before the longer-term uptrend resumes.
The Copper Price is trading at $5.95 USD per pound today, marking a -0.71% decline over the last seven days. After a blistering start to 2026 that saw the red metal hit fresh all-time highs above $6.11, the market has entered a consolidation phase. Despite the weekly dip, copper remains up 7.25% over the last 30 days and 4.78% year-to-date, reflecting continued structural strength despite short-term headwinds.
Copper Price
Unit: USD/lb
---
---
Loading Chart...
Market Drivers: Why is Copper Down?
The recent pullback in the Copper Price can be attributed to a cooling of geopolitical risks and shifting supply dynamics that have prompted profit-taking among speculative investors.
Geopolitical Risk Premium Fades: A primary driver of the recent sell-off was the de-escalation of tensions regarding Greenland. Markets breathed a sigh of relief after reports confirmed that the U.S. administration ruled out aggressive measures and retracted threats of tariffs on allied nations opposed to the acquisition. This removed a significant “fear premium” that had inflated commodity prices earlier in the month, leading to a rotation out of hard assets.
Rising Inventories: Easing supply constraints have also weighed on prices. LME copper stocks have risen to their highest levels since May 2025, with significant inflows reported in U.S. warehouses. This inventory build has alleviated immediate concerns of a supply squeeze, narrowing the arbitrage window between Comex and LME contracts and signaling that physical availability is temporarily improving.
Profit Taking Following Record Highs: After surging nearly 40% year-over-year and hitting record peaks in mid-January, the metal was due for a technical correction. Analysts note that the rapid ascent invited profit-taking, particularly as physical buyers in China showed hesitation at these elevated price levels.
Technical Outlook
Technically, copper is testing support near the $5.80-$5.90 region. While the long-term trend remains bullish driven by AI and green energy demand, the short-term momentum indicators suggest a cooling period. A break below $5.80 could open the door for a deeper retracement toward $5.60, while a reclaim of the psychological $6.00 level is needed to reignite the rally toward new highs.
Artificial intelligence (AI) is reshaping technology and energy systems worldwide. As AI grows, it increases the need for powerful hardware, which also puts stress on electricity grids. Two major trends illustrate this change: the fast-growing data center GPU market and rising global power demand to support AI and digital infrastructure. These trends have implications for technology companies, power operators, governments, and energy planners.
GPU Gold Rush: AI Chips Are the New Power Plants
The data center graphics processing unit (GPU) market is expanding quickly due to AI demand. GPUs are specialized chips that speed up AI training and inference tasks. Today’s AI models require thousands of GPU cores working in parallel to process data.
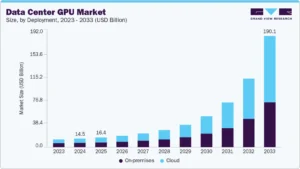
In 2024, the global data center GPU market was estimated at about $14.48 billion. Analysts expect this market to grow rapidly in the coming decade.
One forecast suggests it may hit around $155.2 billion by 2032, about 30.6% increase from 2024. This growth is driven mainly by AI, machine learning, and other high-performance computing workloads.
Source: Grand View Research
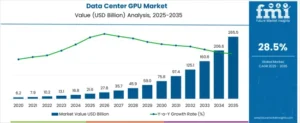
Other market research supports rapid growth but shows variation in future values depending on methodology. A different long-term forecast shows that the data center GPU market might grow from about $21.6 billion in 2025 to $265.5 billion by 2035. This means an annual growth rate of 28.5%.
Source: Future Market Insights
These projections show a clear global trend. Demand for GPU-based data center hardware will triple or more in the next decade. This growth comes as AI services spread across various industries.
Hyperscale cloud platforms, enterprises, and government agencies are among the major buyers driving this demand. AI tools, like generative AI and large language models, are booming. This keeps GPU-based computing central to future digital growth.
Global electricity demand is set to rise sharply over the next decade. A recent UN report says demand will rise by over 10,000 terawatt-hours by 2035. This increase is roughly equal to the total electricity consumption of all advanced economies today. Rapid growth in artificial intelligence and digital infrastructure is a major driver of this trend.
Data centers play a central role in this surge. The International Energy Agency (IEA) estimates that data centers consumed ~415 TWh globally in 2024 (1.5% of total electricity). That’s up from ~240 TWh in 2023—a growth of around 73% driven by AI rollout.
This growth shows the quick rollout of AI systems. They depend on power-hungry GPUs and high-density computing gear.
The IEA predicts that by 2030, data centers will make up over 20% of electricity demand growth in advanced economies. In countries with large AI and cloud computing hubs, data centers are becoming one of the fastest-growing sources of new power demand. This shift pressures grids. It also increases the need for new power generation, grid upgrades, and low-carbon sources.
Power demand growth from data centers will also change how grids operate in key economies. In the United States, data centers are projected to account for nearly half of all growth in power demand through 2030. In other advanced economies, data centers could drive more than 20% of electricity demand growth.
Beyond simple demand growth, the global power system must plan for future capacity needs to meet rising consumption. Reports indicate that by 2035, global electricity demand could grow by around 30% compared with today.
AI-driven demand is a central factor behind this increase, along with electrification in transport, industry, and buildings. Renewables, nuclear, and cleaner energy sources will have to expand to meet this growth while reducing emissions.
Growth in GPU markets and power demand varies by region. North America leads the data center GPU market, with a large share of sales and installed capacity. This success comes from cloud providers and hyperscale platforms.
Europe and Asia have high demand. Asia-Pacific is growing quickly because of investments in digital services and computing infrastructure.
On the energy side, grids in some regions face more strain than others. Advanced economies with many AI data centers, like the U.S., parts of Europe, and China, must balance current power needs with the fast growth of data center loads. Emerging markets might find it hard to keep up with industrialization and digital growth if they don’t invest in their grid.
Renewable energy plays a growing role in addressing power demands from digital infrastructure. By 2024, renewable energy had grown significantly around the world.
Solar and wind power made up a large part of the new installations. In 2023, solar capacity grew by over 32%. Also, global installed renewable power capacity surpassed 4,400 gigawatts. This expansion helps meet part of the rising demand from data centers and other sectors.
GPUs, Power, and Infrastructure Converge
The growth of AI is changing how investors and companies view computing hardware. GPUs are no longer seen as short-term technology tools. Many investors now treat them as long-term physical infrastructure, similar to power plants or transport assets.
A survey by KPMG and Nuway Capital looked at 120 investors in 10 global markets. It found that almost 80% believe generative AI is the main reason to invest in GPU capacity.
Over 70% of high-net-worth investors see GPUs as a better investment than blockchain and quantum computing. Many also ranked GPUs above renewable energy. This shift reflects stable demand, physical limits, and long asset lifetimes.
Power availability has become a critical constraint. As GPU-dense data centers expand, electricity supply now shapes where and how fast AI infrastructure can grow. In response, major technology firms are securing long-term power sources that can deliver large volumes of reliable, low-carbon electricity, such as nuclear.
Several companies are turning to nuclear energy. Meta has announced deals with Vistra, TerraPower, and Oklo to secure up to 6.6 gigawatts of nuclear capacity by 2035. Microsoft made a 20-year deal with Constellation Energy to restart the Three Mile Island nuclear plant. This effort is backed by a $1 billion loan from the U.S. government.
Amazon also has deals for 1.9 gigawatts of nuclear power from the Susquehanna plant. They also have agreements for small modular reactor projects. Google has signed a deal with Kairos Power for energy from multiple small modular reactors, with up to 500 megawatts expected by 2035.
Nuclear to the Rescue: Powering AI 24/7
Industry leaders now describe this link between AI and nuclear power as structural. At a recent International Atomic Energy Agency meeting, officials noted that nuclear energy provides several key benefits. It has low emissions, supplies power around the clock, offers high power density, and is scalable. This makes it a great fit for AI needs.
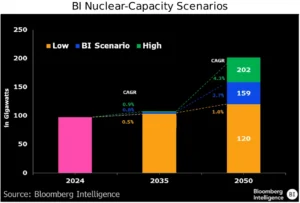
Globally, 71 nuclear reactors are under construction, adding to 441 operating units, with 10 planned in the United States. Bloomberg Intelligence predicts that U.S. nuclear capacity may grow by 63% by 2050. Most of this increase will happen after 2035, as small modular reactors become commercially viable.
At the same time, supply limits are reinforcing the infrastructure view of GPUs. Constraints in chip manufacturing, power access, land, and grid connections are tightening. Hyperscalers are responding with massive spending.
Major cloud companies are expected to spend over $600 billion on capital expenditures in 2026, a 36% increase from 2025, according to analysts. About $450 billion of that will go to AI infrastructure. NVIDIA leads the market, taking nearly 90% of AI accelerator spending. In early 2025, it reported $35.6 billion in quarterly data center revenue.
Together, these trends show a clear shift. The future of AI will depend not just on software, but on access to GPUs, data centers, and reliable power. For investors, utilities, and policymakers, AI is now an infrastructure challenge as much as a digital one.
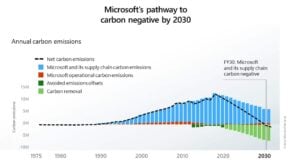
Microsoft sharply expanded its carbon removal activity in 2025. The company announced that it signed agreements covering 45 million metric tonnes of carbon dioxide removal in a single year. This total is more than double the volume the tech giant contracted in 2024 and marks its largest annual increase to date.
The new figure reflects a rapid scale-up in Microsoft’s climate strategy. Since launching its carbon-negative goal, the company has steadily increased its purchases of carbon removal credits.
Microsoft states that these agreements focus on high-quality carbon removal, not avoided emissions. The company prioritizes methods that physically remove carbon dioxide from the atmosphere and store it for long periods.
Phil Goodman, Director of the carbon removal portfolio at Microsoft, remarked:
“With any form of carbon removal, you need someone out there to buy the credits so that the economic model works. By securing that forward demand commitment, suppliers can actually go raise financing, hire staff, and build out their projects. We buy only a fraction of a project’s total credits, and we hope other companies can make faster procurement decisions knowing that projects in our portfolio underwent deep due diligence.”
Mixing Nature and Tech: How Microsoft Removes Carbon
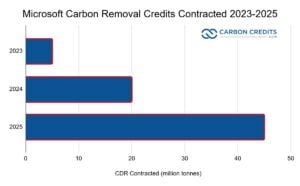
In 2023, Microsoft contracted about 5 million tonnes. In 2024, that number rose to roughly 20 million tonnes. The jump to 45 million tonnes in 2025 signals a shift from pilot-scale deals to long-term market building.
The 45 million tonnes come from a wide range of carbon removal pathways. Microsoft spreads its purchases across both engineered and nature-based solutions. This approach helps reduce risk and supports multiple technologies at once.
Key removal methods in Microsoft’s portfolio include:
Direct Air Capture (DAC), where machines pull CO₂ directly from the air and store it underground
Bioenergy with carbon capture and storage (BECCS), which captures emissions from biomass energy and locks them away
Enhanced weathering, which accelerates natural rock processes that absorb carbon
Afforestation and reforestation, which store carbon in trees and soils
Soil carbon projects, which increase carbon stored in farmland
Microsoft confirmed that a growing share of its 2025 agreements came from durable removals, meaning storage lasting hundreds to thousands of years. This includes DAC, BECCS, and mineralization projects.
Source: Data from Microsoft
The company also works with suppliers across North America, Latin America, Europe, Asia, and Africa. This global spread helps scale carbon removal beyond a few regions. As noted by Microsoft, the goal of all these efforts is to:
“…help restore carbon balance lost through carbon dioxide emissions generated by modern life – from agriculture and construction to chemical and energy production.”
Why Microsoft Is Scaling Carbon Removal So Fast
Microsoft’s emissions have risen in recent years. The company reported that its Scope 1, 2, and 3 emissions were up more than 30% from 2020 levels by the early 2020s. The main driver is rapid growth in data centers, cloud services, and AI computing.
AI systems require large amounts of electricity and hardware. This has made it harder for Microsoft to reduce emissions through efficiency alone. Carbon removal now plays a key role in balancing residual emissions that cannot be eliminated quickly.
Microsoft’s climate targets are clear:
Carbon negative by 2030, removing more CO₂ than it emits each year
The company sees carbon removal as essential to meeting these goals. Microsoft states that emissions reductions remain the priority. Carbon removal comes after efficiency, clean energy, and supply-chain action.
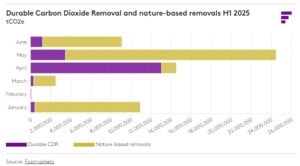
Microsoft leads the carbon removal market, but other large buyers are also active. In the first half of 2025, companies signed at least 61.5 million tonnes of carbon removal offtake agreements worldwide. Microsoft accounted for about 56.3 million tonnes, or roughly 91% of that total. This shows how concentrated demand still is among a few major buyers.
Other tech firms are contributing at smaller scales. Google signed carbon removal agreements totaling about 728,300 tonnes of CO₂ across multiple projects.
Financial institutions such as JPMorgan Chase have also purchased durable removal credits, including BECCS and DAC. In addition, companies including Google and Stripe are part of a coalition that plans to spend $1 billion on carbon removal by 2030.
Nature-based removal also plays a role. Large firms, including Microsoft, Google, Meta, and Salesforce, have committed through joint initiatives to secure up to 20 million tonnes of nature-based carbon removal credits by 2030. These projects focus on forests, soils, and other land-based solutions.
The carbon removal market remains small but is growing fast. In 2024, total carbon removal purchases reached nearly 8 million tonnes, up 78% from 2023. Most purchases still come from repeat buyers with long-term climate targets.
Looking ahead, McKinsey & Company estimates the carbon removal market could reach $40 billion to $80 billion per year by 2030. If the industry scales to meet climate needs, annual revenues could rise to between $300 billion and $1.2 trillion by 2050. These forecasts depend on falling costs, strong standards, and broader corporate participation.
Source: McKinsey & Company
Overall, demand is expanding, but leadership remains concentrated. Microsoft’s scale helps anchor the market, while smaller commitments from other firms show early signs of wider adoption.
Trust in the Numbers: MRV Matters
Microsoft places strong emphasis on Measurement, Reporting, and Verification (MRV). Each project must prove how much carbon it removes and how long it stays stored. The big tech firm works with independent third-party verifiers and recognized carbon standards.
The company also applies internal quality criteria. These include permanence, additionality, and low risk of reversal. Projects that fail to meet these benchmarks do not qualify.
Microsoft states that improving MRV systems remains a priority. Accurate data builds trust and supports long-term market growth. This focus also reflects broader industry concerns about credibility in voluntary carbon markets.
Hurdles Ahead: Costs, Supply, and Permanence
Despite rapid growth, carbon removal faces several hurdles:
High costs: DAC and other engineered methods can cost hundreds of dollars per tonne
Limited supply: Most technologies remain early-stage
Long development timelines: Infrastructure takes years to build
Microsoft acknowledges these limits. The company says large early purchases help push costs down over time through learning and scale. This mirrors how renewable energy prices fell after early corporate and policy support.
The Future of Corporate Carbon Removal
Microsoft plans to continue expanding its carbon removal portfolio beyond 2025. The company expects annual contracting volumes to remain high as AI and cloud growth continue.
Other large firms are following similar paths. Technology companies, airlines, and consumer brands are increasingly signing long-term removal contracts. However, none yet match Microsoft’s scale.
The 45 million tonnes contracted in 2025 mark a turning point. Carbon removal is shifting from niche pilots to a recognized climate tool. Microsoft’s approach shows how corporate demand can help build an entirely new climate industry.
As global emissions remain high, the role of carbon removal is likely to grow. Microsoft’s strategy offers one of the clearest examples to date of how large buyers are shaping this emerging market.
The Middle East and North Africa are no longer on the sidelines of the energy transition. The MENA Energy Outlook 2026 by Dii Desert Energy shows the region has reached a turning point. Renewable capacity jumped 44% in 2025 to about 43.7 GW. Solar PV led the surge, accounting for 34.5 GW.
The growth is unprecedented. MENA took five years to rise from about 14 GW in 2020 to 30 GW in 2024. Then, in just one year, it added nearly 15 GW. This was not gradual progress. It was a rapid scale-up driven by cheap solar power, competitive auctions, and a booming project pipeline.
Falling costs are at the core of this shift. In 2025, solar and wind tenders set new global records. Solar PV prices dropped to around 1.09 US cents per kWh. Wind fell to about 1.33 US cents per kWh. These prices are reshaping expectations for large-scale clean energy worldwide.
Policy, Pipeline, and Project Momentum Poised for Scale
The region’s renewable energy project pipeline has ballooned to ~202 GW — a figure that now nearly matches aggregated national targets out to 2030. That pipeline isn’t theoretical; it includes 38 GW under construction and a deep roster of gigawatt-scale solar programs ready to move into execution.
Under Dii’s updated scenario framework for 2030, three pathways emerge:
A Conservative baseline: 165 GW total renewables.
A Balanced transition: 235 GW, roughly aligned with national ambitions.
A Green Revolution: 290 GW, representing full regional potential.
Even the conservative outlook reflects a dramatic acceleration — the result of policy clarity, cost competitiveness, and private capital intent on capturing the region’s unparalleled solar resource.
Source: MENA Energy Outlook 2026
Saudi & UAE Leading Deployment
Saudi Arabia has emerged as a standout. Operational capacity nearly tripled in one year, reaching around 11.7 GW, and it now stands as a regional leader not only in volume but in setting cost benchmarks.
Meanwhile, the UAE continues to punch above its weight with flagship projects. Masdar and Emirates Water and Electricity Company (EWEC) have begun the construction of a 5.2 GW solar park integrated with 19 GWh of battery storage – one of the largest renewable + storage complexes globally. This project is intended to deliver baseload clean power at scale, significantly reducing reliance on gas-fired generation.
Solar is the centerpiece of the MENA transition — and for good reason.
Market share: Solar PV dominates the region’s current renewable fleet, making up roughly 79% of deployed renewables with 34.5 GW.
Pipeline strength: Of the total 202 GW pipeline, solar accounts for the majority — around 130 GW — leaving wind and storage to complement its growth.
Economics: First-of-their-kind auction prices have pushed levelized costs to historic lows, intensifying private-sector interest and reducing capital-cost risk for long-duration financing.
This solar dominance aligns with broader global forecasts that see solar accounting for most of renewable growth in the decade ahead, especially as project cost declines continue to outpace projections.
The critical driver here is not just sunshine but economics: solar power in MENA is now among the cheapest baseload energy available, challenging even entrenched natural gas generation in many markets.
Source: MENA Energy Outlook 2026
From Panels to AI: MENA’s New Demand Drivers
One of the most interesting insights in the Outlook is the emergence of AI infrastructure as a renewable energy demand driver.
The report highlights that data centers — spurred by the rapid adoption of AI — are becoming “super offtakers” of clean energy. These facilities require long-term, high-capacity power contracts, which in turn improve the bankability of large renewable power purchase agreements (PPAs).
This is a structural shift. Traditionally, renewable PPAs in the corporate sector were dominated by manufacturing and export industries. Now, the AI ecosystem’s appetite for reliable, low-carbon power is helping unlock financing and long-duration contract structures that support gigawatt-scale solar and storage.
In effect, AI is not just a user of clean power — it’s becoming a market catalyst, compressing risk premia and enabling developers to sell projects at scale with predictable cash flows. This is exactly the type of demand signal that carbon markets and corporate net-zero strategists value most: stable, creditworthy offtake linked to decarbonization commitments.
Source: MENA Energy Outlook 2026
Energy Storage: The Key to 24/7 Clean Power
Solar’s growth creates a natural need for storage solutions, and MENA is responding. Battery Energy Storage Systems (BESS) are rising fast — with about 25 GWh operational today and projections showing ~156 GWh by 2030 (a more than six-fold increase).
This shift is pivotal: storage enables firm, dispatchable renewables, bridging gaps between peak solar output and evening demand. It also reduces grid stress and curtails reliance on fossil peaking units — which, in carbon accounting terms, lowers actual emissions and improves marginal grid intensity.
The shift toward BESS over thermal energy storage reflects global trends in cheaper lithium-ion systems and increased merchant storage markets, signaling that long-duration storage will be a defining piece of the region’s decarbonization story.
MENA’s transition — led by solar — has direct implications for carbon reduction pathways:
The region’s power sector emissions are highly carbon-intensive today. Replacing fossil generation with low-carbon solar and storage can materially reduce grid emissions intensity.
Large-scale deployment and low costs improve the economics of displacement, especially for gas. That in turn strengthens the case for deeper cuts aligned with Paris Agreement goals.
However, challenges remain. Natural gas still dominates power generation in many countries and will likely remain part of the mix through 2030. That underscores the importance of carbon pricing, power market reform, and long-term PPAs to accelerate coal-to-solar displacement and enable hydrogen sectors to scale.
MENA: Forecast to 2030 and Beyond
Balanced transition (235 GW): Renewable power capacity grows significantly, narrowing the gap to climate targets and improving energy security.
Green Revolution (290 GW): If finance, supply chains, and permitting keep pace, MENA could exceed current national goals and unlock deeper emissions reductions.
Global modeling from other sources also suggests that solar and wind could respectively represent the majority of electricity growth in the next decade — a pattern that amplifies the MENA trajectory.
MENA has shifted from potential to performance, driven by low-cost solar, strong project pipelines, and rapid growth in energy storage. New demand from AI is adding fresh momentum.
This progress creates fertile ground for carbon markets. Large, contract-backed renewable projects offer credible, long-term emissions reductions. As power markets mature, MENA is emerging as a key player in energy security and global decarbonization.
Mitsui O.S.K. Lines, also known as MOL, one of Japan’s biggest shipping companies, announced its first carbon removal results under its long-term environmental plan. This move marks a real step beyond reducing emissions. MOL aims to reach net-zero greenhouse gas (GHG) emissions by 2050 under its Environmental Vision 2.2.
Shipping emissions are hard to cut, so removal methods help tackle the remaining CO₂. MOL’s actions also reflect the global growth of the carbon removal market. Companies and countries are investing more in solutions that take CO₂ out of the air for long-term storage. This trend is rising as climate targets push industries to go beyond emission cuts.
DAC, Ocean Capture & Rocks: A Trio of MOL’s First Carbon Removal
In fiscal 2024, MOL announced its first verified carbon removal achievements. This progress builds on its Environmental Vision 2.2 strategy. The shipping giant secured measurable removal commitments using several technologies.
In its LinkedIn post, the company notes:
“In FY2024, MOL reported credits equivalent to 2,000 tons of CO₂ emissions- marking the company’s first tangible achievement in CDR… As MOL continues to diversify its CDR portfolio, it remains committed to finding and scaling the most effective solutions- both natural and technological- to advance toward a decarbonized future.”
MOL partnered with Climeworks, a leading Direct Air Capture (DAC) company. Through this partnership, the company agreed to procure 13,400 tonnes of CO₂ removal by 2030 using Climeworks’ DAC systems.
MOL is the first shipping company globally to set up this type of DAC purchase. DAC pulls CO₂ directly from the air and stores it permanently.
MOL also signed an offtake agreement for 30,000 tonnes of carbon removal credits from Captura’s Direct Ocean Capture technology. This method removes CO₂ from seawater, which draws CO₂ from the air over time.
In addition, MOL made a deal with Alt Carbon for 10,000 tonnes of carbon removal credits. These credits come from enhanced rock weathering in India. Enhanced weathering helps pull CO₂ from the air into minerals in soil, a type of removal considered higher quality and more durable. This deal is the first of its kind between a Japanese shipping company and an Indian climate tech firm.
MOL is also buying enhanced rock weathering removal credits through another multiyear offtake. This brings added diversity to its removal portfolio. These deals help the company support different removal paths rather than relying on a single method.
The global shipping industry carries about 90% of traded goods by volume. It also produces roughly 3% of global CO₂ emissions. If trade grows, emissions could rise unless action is taken.
The International Maritime Organization (IMO) aims for shipping emissions to drop. The targets are: 20-30% reduction by 2030, 70-80% by 2040, and net-zero by 2050, all compared to 2008 levels.
Source: IMO
Even with cleaner fuels like ammonia or hydrogen, some emissions will remain hard to avoid. Energy efficiency and fuel switches help, but they cannot remove all CO₂ from long ocean voyages. Carbon removal fills this gap. It helps shipping companies offset their leftover emissions while future fuel solutions scale up.
MOL’s Environmental Vision 2.2 plan aims to remove 2.2 million tonnes of CO₂ by 2030. This goal covers all its removal initiatives. This creates demand for early‑stage removal solutions and helps scale emerging technologies.
Partnerships on the Horizon: Forests, Carbon Credits, and Cross-Industry Moves
MOL’s carbon removal work includes broader moves with partners and industry players. The company is supporting carbon credits to cut emissions and expand negative emissions. All credits are third-party certified and independently verified to ensure quality and impact.
In January 2025, MOL and Marubeni Corporation started Marubeni MOL Forests Co. This joint venture will create, trade, and retire nature‑based carbon credits. Its first project aims to plant around 10,000 hectares of new forest in India. This will generate credits from afforestation and reforestation. These forests will start producing removals around 2028. Nature‑based solutions help store carbon while boosting biodiversity and soil quality.
Also, MOL signed a deal with ITOCHU Corporation. This agreement aims to promote environmental attribute certificates. These certificates help cut Scope 3 emissions in transportation. This work is the first Japanese model linking shipping and aviation in environmental certificate use. Scope 3 emissions come from supply chains and end‑use.
Another related program is the NX‑GREEN Ocean Program by Nippon Express, launched in February 2025. It uses carbon inset certificates tied to low‑carbon shipping by MOL vessels. These certificates help companies reduce their Scope 3 freight emissions. The program shows how removal and decarbonization can work together for supply chains.
Together, these partnerships show MOL’s expanding role. The company is connecting technical and natural removal solutions with marine decarbonization and cross‑industry climate efforts.
Riding the Carbon Market Wave
The global carbon removal market is growing fast. Corporations and governments are investing more in long-lasting removal methods. These include DAC, ocean capture, enhanced weathering, and nature-based solutions. This growth matches scientific calls for big removals to keep warming under 1.5°C.
Source: McKinsey & Company
MOL is helping to expand the removal market by investing in multiple technologies. A joint venture for a NextGen CDR Facility, including MOL and other buyers, aims for over 1 million tonnes of certified removals by 2025. These projects include DAC and biomass removal with long-term storage. Early demand helps drive down costs over time and encourages more technological development.
Shipping companies are also investing in emission reduction technologies. These include more efficient ship designs, alternative fuels, and onboard carbon capture systems.
Global shipping firms continue to align with the IMO’s decarbonization goals through technology upgrades, fuel changes, and climate partnerships. This includes work on hull design, logistics efficiency, and fuel alternatives such as ammonia and hydrogen. Those efforts reduce emissions intensity and support long-term climate targets.
High Costs and Early Stage Technology: Direct Air Capture and ocean capture remain expensive and are still early in deployment, making them less appealing than traditional emission reductions.
Need for Strong MRV and Certification: Measurement, Reporting, and Verification systems must stay robust to ensure credits reflect real and lasting CO₂ removal. Independent certification is critical for market trust.
Nature-Based Risks: Forest and land projects require careful planning. Carbon storage can be reversed if forests burn, degrade, or are mismanaged. High-quality MRV standards help protect long-term carbon value.
Sailing Toward 2050: MOL’s Vision for Net-Zero Maritime
Despite challenges, experts say removals will be necessary for sectors that cannot eliminate emissions by 2050. Shipping, aviation, and heavy industry will likely cut emissions and use durable removals to meet climate goals.
For MOL, investing in removal markets, partnerships, and strong MRV frameworks positions the company as a leader in maritime decarbonization. The first results under Environmental Vision 2.2 show how shipping firms can add new climate solutions to their sustainability plans.
By partnering with DAC, ocean capture, and enhanced weathering technologies, and by investing in nature-based solutions, MOL is expanding its climate action beyond traditional emission cuts.
As shipping and corporate climate planning evolve, carbon removal will remain a key part of long-term strategies. MOL’s progress with Environmental Vision 2.2 shows how companies can blend technology, nature, and market forces to achieve bold climate goals.
Canada’s climate journey is entering a more uncertain phase. Emissions are trending lower, investments continue to flow, and clean technologies remain in play. Yet momentum is clearly weakening. That is the central message of Climate Action 2026: Retreat, Reset or Renew, the third annual report from the RBC Climate Action Institute.
The report paints a nuanced picture. Progress has not stopped. But it has slowed. Policy reversals, economic pressures, and shifting public priorities are weighing on climate ambition at a time when speed matters most.
Canada now faces a defining question: retreat from climate action, reset its approach, or renew its commitment with a sharper focus.
Emissions Are Falling, but Not Fast Enough
Canada’s total greenhouse gas emissions are projected to be 7% lower in 2025 than in 2019, according to RBC’s estimates. That marks real progress, especially after years of volatility during and after the pandemic.
However, this pace remains well short of what Canada needs to hit its longer-term targets. The country has committed to reducing emissions by 40% to 45% below 2005 levels by 2030 and by 45% to 50% by 2035. Current trends suggest those goals will be difficult to reach without stronger policy signals.
Several sectors have reduced emissions intensity:
Electricity: down 27%
Buildings: down 19%
Oil and gas: down 19%
These gains reflect cleaner power generation, improved efficiency, and gradual technology upgrades. Still, absolute emissions reductions remain modest, especially in sectors tied to economic growth and population expansion.
Climate Action Barometer Hits a Turning Point
For the first time since its launch, the Climate Action Barometer declined. This index tracks climate-related activity across policy, capital flows, business action, and consumer behavior.
The drop was broad-based. No single sector drove the decline. Instead, multiple pressures hit at once.
Key factors include:
The removal of the consumer carbon tax
The rollback of electric vehicle incentives
Economic uncertainty and rising trade tensions
Alberta’s restrictions on new renewable energy projects
Together, these shifts weakened confidence. Businesses delayed or canceled projects. Consumers pulled back on major clean-energy purchases. Climate policy slipped down the priority list for governments focused on affordability and job creation.
While climate action remains above pre-2019 levels, the trendline has clearly flattened.
Capital Flows Hold Steady, but Growth Has Stalled
Climate investment in Canada has leveled off at around $20 billion per year. That figure has barely moved in recent years.
Public funding remains a stabilizing force. Nearly $100 billion in incentives for clean technology and climate programs is already budgeted for deployment through 2035 by Ottawa and the largest provincial governments.
However, private capital is showing signs of caution. Investment declined compared to 2024, driven largely by cooling sentiment toward early-stage climate technologies. Policy uncertainty has amplified investor risk concerns, especially in capital-intensive sectors like renewables and clean manufacturing.
Some bright spots remain. Wind projects on Canada’s East Coast have supported investment flows, even as renewable development slowed elsewhere.
Carbon Pricing Changes Ease Pressure
The federal government eliminated the consumer carbon tax in April 2025, refocusing carbon pricing solely on industrial emitters. The change had a limited impact on national emissions coverage, as only around three percent of agricultural emissions were subject to consumer pricing.
For farmers, the move delivered meaningful financial relief. Many agricultural operations rely on propane to dry grain or heat livestock facilities. Few cost-effective, lower-carbon alternatives exist in rural regions, making the tax a direct burden on operating costs. Removing it eased pressure without significantly weakening the overall emissions policy.
Still, the decision lowered Canada’s climate policy score and sent mixed signals to investors and businesses evaluating long-term decarbonization strategies.
Consumer behavior has become a significant hindrance to climate momentum. Electric vehicle adoption slowed sharply in 2025. EVs accounted for just eight percent of total vehicle sales in the first half of the year, down from twelve percent during the same period in 2024. Passenger EVs now make up only about four percent of Canada’s total vehicle stock.
Higher interest rates, the removal of purchase incentives, and uncertainty around future mandates all contributed to the pullback.
The federal government also delayed the Electric Vehicle Availability Standard, which was set to require EVs to represent 20% of new vehicle sales by 2026. That pause further weakened confidence across the market.
At the same time, not all clean technologies lost ground. Heat pump adoption edged higher, supported by new efficiency funding, particularly in Ontario. The province’s $10.9 billion commitment to energy efficiency programs could support further uptake, even as other consumer-facing climate actions slow.
Public priorities have also shifted. Only about a quarter of Canadians now identify climate change as a top national issue. Cost of living pressures, healthcare access, and economic stability dominate public concerns, reshaping how households weigh climate-related decisions.
Source: RBC report
Buildings Sector Becomes the New Battleground
The RBC Institute’s 2026 “Idea of the Year” focuses squarely on Canada’s buildings sector, which has quietly become one of the country’s most challenging emissions sources. Emissions from buildings rose 15% between 1990 and 2023 and now represent a larger share of national emissions than heavy industry.
Today, buildings account for roughly 18% of Canada’s greenhouse gas emissions when electricity-related emissions are included. Progress remains slow. Emissions from the sector are projected to fall by just one percent in 2025, a pace that leaves Canada far from its net-zero target for buildings by 2050.
New construction adds to the risk. If projects continue to follow prevailing building codes, emissions could rise by an additional 18 million tonnes over time, locking in higher emissions for decades.
Source: RBC Report
Responsible Buildings Pact Points to a Reset
Against this backdrop, the Responsible Buildings Pact offers a potential reset. Launched in 2024 under the Climate Smart Buildings Alliance, the initiative aims to accelerate the adoption of low-carbon designs and materials across the construction sector.
The pact focuses on scaling the use of mass timber and low-carbon concrete, steel, and aluminum. These materials can significantly reduce embodied carbon in new buildings while strengthening domestic supply chains. The approach is particularly timely as Canadian producers face constraints from U.S. trade tariffs, limiting access to lower-emissions materials.
If widely adopted, the pact could transform how Canada builds homes, offices, and infrastructure. By embedding emissions reductions into construction decisions today, the sector could deliver long-term climate gains while supporting industrial competitiveness.
Electricity Progress Slows After Early Success
Canada’s electricity sector remains one of its strongest climate performers. Emissions have fallen an estimated 60% since 2005, surpassing Paris Agreement targets. Coal phase-outs continue to drive reductions, with more than six terawatt-hours of coal power expected to be removed from the grid this year.
Still, progress slowed in 2025. Uncertainty surrounding Alberta’s renewable energy policies led to the cancellation of 11 gigawatts of planned capacity, roughly half of the province’s existing generation. At the same time, natural gas use rose sharply, offsetting some of the emissions gains from coal retirements.
Canada now faces a dual challenge: doubling electricity capacity while fully decarbonizing it by 2050. Estimates suggest the required investment could exceed $1 trillion, underscoring the scale of the task ahead.
Source: RBC Report
Climate Action at a Defining Moment
The RBC report makes one point clear. Canada has not abandoned climate action, but it has lost momentum. Emissions are lower, capital remains available, and technology continues to advance. Yet policy clarity has weakened, consumer confidence has faded, and investment growth has stalled.
With just 25 years left to reach net zero, the choices made now will shape Canada’s emissions trajectory for decades. Renewed coordination between governments, businesses, and consumers will be essential, along with policies that balance economic realities without sacrificing long-term climate goals.
Canada still has time to reset and renew. What it cannot afford is continued drift.
To provide the best experiences, we use technologies like cookies to store and/or access device information. Consenting to these technologies will allow us to process data such as browsing behavior or unique IDs on this site. Not consenting or withdrawing consent, may adversely affect certain features and functions.
Functional
Always active
The technical storage or access is strictly necessary for the legitimate purpose of enabling the use of a specific service explicitly requested by the subscriber or user, or for the sole purpose of carrying out the transmission of a communication over an electronic communications network.
Preferences
The technical storage or access is necessary for the legitimate purpose of storing preferences that are not requested by the subscriber or user.
Statistics
The technical storage or access that is used exclusively for statistical purposes.The technical storage or access that is used exclusively for anonymous statistical purposes. Without a subpoena, voluntary compliance on the part of your Internet Service Provider, or additional records from a third party, information stored or retrieved for this purpose alone cannot usually be used to identify you.
Marketing
The technical storage or access is required to create user profiles to send advertising, or to track the user on a website or across several websites for similar marketing purposes.