Tech Giants Like NVIDIA and Google Eye Space to Power AI with Orbital Data Centers

Some of the worldโ€™s biggest tech companies and space startups are racing to build data centers in space. These orbital data centers are meant to support the massive computing needs of artificial intelligence (AI). Companies see space as a place to get abundant solar energy and natural cooling without the limits of Earthโ€™s power grids. This idea moved from theory to early testing in late 2025โ€“2026 and gained spotlight at the AIAA SciTech Forum 2026 in Orlando, Florida, last week.

Several tech giants, including Google, SpaceX, and Blue Origin, are exploring spaceโ€‘based computing. At the same time, startups like Starcloud have already launched prototypes with advanced AI hardware into orbit. These efforts reflect growing interest in solving energy, cooling, and infrastructure challenges that terrestrial data centers face.

Why the Tech Giants Look to Space

AI needs more computing power than ever. Traditional data centers on Earth use huge amounts of electricity and water for power and cooling. In the U.S., data centers used over 4% of total electricity in 2024 and could increase to between 6.7% and 12% by 2028 if current trends continue.

At the same time, global data center electricity demand may nearly double by 2030 to about 945โ€“980 terawattโ€‘hours per year due to AI and cloud services.

AI data center energy GW 2030

  • Space offers two major advantages: nearโ€‘constant solar power and natural cooling.

Solar panels in orbit can be up to 8x more efficient than on Earth because there is no atmosphere to block sunlight. Heat can also be released directly into space by radiation, without the need for waterโ€‘based cooling systems.

These factors could lower energy costs and help AI computing scale without straining terrestrial power systems. Companies see space as a place where solar energy is abundant, and energy from the sun is almost always available, especially in certain orbits.

What the Tech Giants Are Doing

Google: Project Suncatcher

Google has announced a research initiative called Project Suncatcher. The project aims to put AI computing hardware into orbit using solarโ€‘powered satellites.

The tech giant plans to launch two prototype satellites equipped with its own AI chips by early 2027 to test whether they can run in space. The goal is to create blueprints for future spaceโ€‘based data centers.

Google says these satellites will use Tensor Processing Units (TPUs), chips designed for AI tasks, and connect via laser links instead of traditional wires. The companyโ€™s CEO said that using solar energy in space could help support the AI industryโ€™s rapidly rising computing needs.

Starcloud: First AI Model in Orbit

Starcloud, a startup backed by Nvidia and venture capital firms, has achieved an important milestone. In late 2025, the company launched a satellite called Starcloudโ€‘1 carrying an Nvidia H100 GPU. This satellite successfully trained and ran AI models, including a version of Googleโ€™s Gemma model, in orbit. This marked the first AI model training in space.

Starcloud aims to expand this capability with future satellites. The company has proposed building a large space data center with about 5 gigawatts (GW) of solar panels spread over several kilometers. The design would deliver more compute power than many terrestrial data centers with efficient energy use.

SpaceX and Blue Origin

Elon Musk‘s SpaceX and Blue Origin are also exploring space data centers. SpaceX plans to use its Starlink satellite network and future satellites that could carry AI compute hardware.

Reports suggest SpaceX may launch upgraded Starlink satellites with terabitโ€‘class capacity starting in 2026. Musk has also talked about using reusable rockets to place larger compute hubs into orbit at scale.

Blue Origin, backed by Jeff Bezos, reportedly has a team working on technology for orbital data centers. The aim is to develop systems that can support AI workloads beyond Earth. These efforts build on Blue Originโ€™s long history in rocket and space technology.

Global Competition: Startups and Nations Join In

Space data centers are attracting attention beyond the big tech names. Multiple startups and international players are racing to build compute infrastructure in orbit.

Companies like PowerBank Corporation and Orbit AI are planning spaceโ€‘based nodes or cloud services powered by solar energy. Moreover, Axiom Space has outlined plans for data center modules on its private space station by 2027.

Outside the U.S., China is also advancing space compute projects. The Threeโ€‘Body Computing Constellation aims to deploy thousands of satellites equipped with highโ€‘performance GPUs and AI models. The longโ€‘term goal is to provide a combined computing capacity of 1,000 petaโ€‘operations per second (POPS) โ€” a measure of compute power far beyond many groundโ€‘based supercomputers.

This global competition highlights how nations and companies see orbital data centers as strategic infrastructure for AI and other advanced computing tasks.

Challenges and Engineering Hurdles Above the Atmosphere

Building data centers in space is not easy. Engineers must solve many technical problems before fullโ€‘scale orbital centers become common.

  • Radiation: Space radiation can damage GPUs and other chips. Orbital data centers need heavy shielding and backup hardware.
  • Cooling: Space has no air or water. Systems must use radiative cooling, which is complex but essential.
  • Debris: Crowded orbits raise collision risks. Large structures could worsen the Kessler syndrome.
  • Costs: Launching hardware is costly. Firms expect costs to fall to about $200 per kilogram by the mid-2030s, improving feasibility.

Potential Benefits: Solar, Cooling, and Scaling

Despite the challenges, spaceโ€‘based data centers offer potential benefits that are hard to match on Earth. More remarkably, the market is set for rapid growth as demand for AI compute expands.

Analysts expect the market to rise from about $1.77 billion in 2029 to nearly $39.1 billion by 2035. This shows an annual growth rate of about 67.4%. This surge is driven by rising AI workloads, growing satellite constellations, and the need for more sustainable, high-performance computing beyond Earth-based limits.

orbital data center market growth 2035

Major advantages of orbital data centers include:

Continuous Solar Power

Satellites in certain orbits can receive sunlight almost 24 hours a day. This could allow data centers to run on clean solar energy constantly, without interruptions from night, clouds, or weather. Solar panels in orbit operate at efficiencies up to eight times those on Earthโ€™s surface.

Natural Cooling

The vacuum of space can help with cooling. Heat radiates into cold space at temperatures as low as 4 Kelvin (โˆ’269ยฐC). This natural cooling eliminates the need for waterโ€‘intensive cooling systems used by terrestrial data centers.

Compute Scaling

As AI models grow larger, so too does their compute demand. Space data centers could provide new capacity that is not limited by Earthโ€™s land, water, or grid constraints. If prototypes prove successful, large orbital systems might be scaled over the next decade.

Future Outlook: Will AI Go Beyond Earth?

Tech companies and startups are actively exploring spaceโ€‘based data centers to meet the rapidly rising computing requirements of AI. Googleโ€™s Project Suncatcher, Starcloudโ€™s prototypes, and efforts by SpaceX and Blue Origin show that orbital compute infrastructure is moving from concept to early reality.

Space offers nearly constant solar energy and natural cooling, which could ease the energy and environmental pressures associated with traditional data centers. Still, radiation, heat management, space debris, and launch costs are major challenges ahead.

The next few years โ€” especially prototype launches around 2027 โ€” will show whether space data centers can become a practical part of the future AI infrastructure landscape.

China’s One Month Lithium Battery Energy Storage Installations Beat America’s One Whole Year

Lithium battery energy storage systems (BESS) are now an essential part of the worldโ€™s energy transition. These systems store electricity from wind, solar, and other clean power and help keep grids stable when demand rises.

In 2025, the BESS market grew at a record pace. China has taken the lead, and global demand for lithium batteries is climbing fast. These trends show how battery storage is reshaping energy systems around the world.

2025: A Record-Breaking Year in BESS Deploymentsย 

Lithiumโ€‘ion chemistry remains the dominant technology in both largeโ€‘scale and behindโ€‘theโ€‘meter storage systems. These batteries help balance power grids. They support renewable energy and allow utilities and businesses to use energy flexibly.ย 

BESS installations are becoming essential for clean energy infrastructure. This is due to more renewables being added and demand for stable power increasing.

The year 2025 was a landmark year for lithium BESS installations. According to Benchmark Mineral Intelligence, around 315โ€ฏGWh of battery energy storage capacity was installed worldwide in 2025. This figure represents nearly 50% yearโ€‘onโ€‘year growth compared with 2024. China and the United States led global deployments, with China far outpacing all other countries.

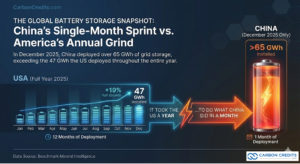
A striking sign of Chinaโ€™s dominance came in December 2025. China installed 18โ€ฏGW (65โ€ฏGWh) of largeโ€‘scale battery storage in that month alone. That amount of capacity was greater than all the battery storage that the United States installed over the entire year. This shows how rapidly China has expanded its energy storage footprint.

BESS installations China vs US 2025

Through October 2025, global gridโ€‘scale BESS capacity reached 156โ€ฏGWh, a 38โ€ฏ% increase from the same period in 2024. China contributed a significant share of this growth, but Europe, North America, and the rest of the world also showed gains in deployment.

Data from Benchmark Mineral Intelligence shows a clear trend: BESS capacity grew in several months of 2025. In October, installations surged by 29% compared to last year. China contributed around 8.8 GWh of new grid-scale capacity that month.

Global Lithiumโ€‘Ion Demand Skyrockets

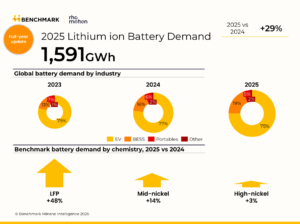
The surge in BESS deployment is part of a larger rise in lithiumโ€‘ion battery demand. In 2025, global demand for lithiumโ€‘ion batteries grew 29โ€ฏ%, reaching about 1.59โ€ฏterawattโ€‘hours (TWh).

global-lithium-ion-battery-demand-rose-29-in-2025-image1

Energy storage growth in 2025 outpaced demand in the electric vehicle (EV) market. This increase came from both stationary storage and EVs.

Stationary storage demand in particular jumped by 51โ€ฏ% in 2025, compared with 26โ€ฏ% growth in EV battery demand. This shift signals that storage is becoming a major driver of lithium consumption alongside traditional EV markets.

Researchers highlight that battery chemistries also changed in 2025. Lithium iron phosphate (LFP) batteries grew faster than other cell types, with demand rising 48% yearโ€‘onโ€‘year. Chinaโ€™s EV sector remains strong, but LFPโ€™s share outside China also climbed to over 30โ€ฏ% of global battery demand.

Industry analysis shows that global lithium use for energy storage may rise by 45.6% from 2025 to 2030. By 2030, it could reach about 312,934 metric tons. This forecast reflects the growing use of storage systems on power grids and for industrial demand.

Why China Leads the Storage Boom

Chinaโ€™s expansion in the BESS market traces back to sustained support and rapid industrial growth. Chinaโ€™s cumulative battery storage capacity doubled in 2024, reaching roughly 62โ€ฏGW (141โ€ฏGWh) by yearโ€‘end. Lithiumโ€‘ion batteries made up over 96โ€ฏ% of this capacity.

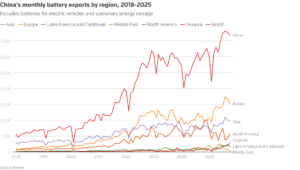
Chinese firms dominate both production and deployment. In 2025, Chinese manufacturers boost global shipments of lithium-ion cells for storage by around 75%. This growth is fueled by demands from power grids, renewable energy, and the expansion of data centers.

china monthly battery exports by region
Source: Reuters
  • Chinese exports of battery systems were valued at over $65โ€ฏbillion in the first ten months of 2025, reflecting strong global demand.

Chinaโ€™s leadership also stems from policy reforms that improve storage economics. Changes in market rules have allowed more battery storage to operate profitably. Batteries that can capture price differences throughout the day now have stronger business cases. This shift encourages more installations and higher utilization of gridโ€‘connected storage.

Energy Storage: The Gridโ€™s New Backbone

Lithium BESS installations play an important role in supporting the clean energy transition. Storage systems help keep electrical grids stable even when wind or solar power is variable. These systems can store excess renewable electricity during low demand and release it in times of high demand.

This capability helps grids handle peak demand and reduces the need to rely on fossil fuel peaking plants. It also helps spread renewable energy. It smooths out output and offers backup when sunlight or wind decreases. As renewable energy generation expands, storage will remain critical to grid flexibility.

The growth of storage also reflects falling battery costs. Battery pack prices for stationary storage dropped significantly in 2025.

Some industry reports say stationary storage costs dropped to about $70 per kilowatt-hour. This makes it one of the cheapest parts of the battery market. Lower costs help accelerate deployment and make storage investment more attractive for utilities and developers.

Looking Forward: Challenges, Innovation Paths, and Projected Growth

While growth remains strong, the battery storage sector faces some challenges. S&P Global forecasts a small drop in global storage installations in 2026. They predict capacity will fall by about 2.7% by 2025. This expected dip is linked to changes in Chinaโ€™s requirement for pairing storage with new solar projects.

Despite this shortโ€‘term dip, longโ€‘term forecasts still point to strong growth through the 2030s as storage becomes central to grid modernization. Battery demand from grid installations is expected to rise even as some geographies adjust policies.

Beyond supply, the industry must also address innovation in longโ€‘duration storage technologies. Lithium-ion systems still lead the market. However, alternatives like flow batteries and sodium-ion cells are starting to emerge. These technologies may help meet storage needs that require longer discharge durations.

Global production capacity for rechargeable lithiumโ€‘ion batteries is also growing rapidly. In 2025, total production capacity is set to surpass 2โ€ฏTWh per year, having doubled from 1โ€ฏTWh just a few years earlier. This expansion supports both EV demand and energy storage.

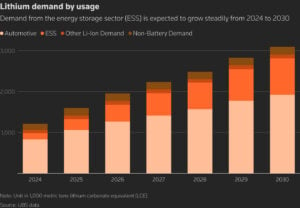
As storage continues to scale, its share of overall lithium demand is expected to grow. Some industry estimates suggest that by 2026, energy storage could account for around 31% of total lithium consumption, up from about 23โ€ฏ% in 2025. This shift underscores how storage is gaining ground relative to other uses like EV batteries.

lithium demand by use 2030
Source: Reuters

China has emerged as the dominant force in both production and deployment. Its policy reforms and manufacturing scale are driving rapid growth. Meanwhile, falling battery costs and strong demand from grids and renewables are pushing stationary storage into the mainstream.

As BESS becomes more important for clean energy and grid reliability, investments, deployments, and innovations in lithium systems are likely to continue rising well into the next decade.

Lโ€™Orรฉal Taps 13 Global Startups to Boost Climate, Nature, and Circular Innovation

Lโ€™Orรฉal, the global beauty giant, has unveiled its first cohort of startups participating in its new sustainable innovation program, Lโ€™AcceleratOR. The program chose 13 startups focused on climate, nature, and circularity. They were selected from nearly 1,000 applicants across 101 countries. It aims to find, pilot, and scale solutions that address key environmental challenges in the beauty industry and beyond.

The initiative is part of Lโ€™Orรฉalโ€™s larger sustainability plan, called โ€œLโ€™Orรฉal for the Future.โ€ This plan includes bold goals for climate action, resource use, and a shift to a circular economy by 2030 and beyond.

Inside Lโ€™AcceleratOR: Funding, Pilots, and Scale

Lโ€™AcceleratOR is a โ‚ฌ100 million (about US$116 million) sustainable innovation program. The funding will be provided over a five-year period. The program helps startups and small to medium-sized enterprises (SMEs) that create sustainable solutions for Lโ€™Orรฉal and the beauty industry.

Lโ€™AcceleratOR is in partnership with the University of Cambridge Institute for Sustainability Leadership (CISL). Selected startups will enter an intensive support phase led by CISL. They will receive funding, expert guidance, and access to Lโ€™Orรฉalโ€™s research and testing capabilities. The aim is to help these companies become pilot-ready and scale their solutions for broader use.

The accelerator focuses on key strategic themes tied to Lโ€™Orรฉalโ€™s sustainability goals:

  • Next-generation packaging and materials
  • Nature-sourced ingredients
  • Circular solutions
  • Data intelligence tools to measure and reduce environmental impacts

Startups may run six- to nine-month pilots with Lโ€™Orรฉal and its partners. Successful pilots may be scaled across global operations if they show measurable benefits.

Ezgi Barcenas, Chief Corporate Responsibility Officer, remarked:

โ€œTo accelerate sustainable solutions to market, we are being even more intentional and inclusive in our pursuit of partnerships through โ€œLโ€™AcceleratORโ€. We are really energized to be co-designing the future of beauty with the University of Cambridge Institute for Sustainability Leadership,ย and these 13 change makers.”

The 13 Startups and Their Focus Areas

The selected startups and SMEs represent a range of sustainable innovations across climate, nature, and circularity. They fall into four main categories:

  • Packaging and materials
  • Nature-sourced ingredients
  • Circular solutions
  • Data intelligence
Lโ€™Orรฉal Lโ€™AcceleratOR, 13 Selected Startups by Category
Source: Lโ€™Orรฉal

These 13 startups use different ways to cut environmental impact. They focus on product design, supply chain management, and manufacturing to promote circularity.

How Lโ€™AcceleratOR Fits Lโ€™Orรฉalโ€™s 2030 Strategy

Lโ€™AcceleratOR is part of Lโ€™Orรฉalโ€™s broad 10-year sustainability roadmap, โ€œLโ€™Orรฉal for the Future.โ€ The roadmap covers four main areas: climate, nature, materials circularity, and communities. It includes the 2030 goals that aim to transform operations while driving innovation in sustainable solutions.

L'Orรฉal net zero 2030 goal
Source: L’Orรฉal

Some of Lโ€™Orรฉalโ€™s key targets under the roadmap include:

  • 100% renewable energy for all operations.
  • Sustainable sourcing of at least 90% bio-based materials in formula and packaging.
  • 100% recycled or reused water for industrial purposes.
  • Reducing virgin plastic use by 50%.
  • Sourcing 50% of packaging from recycled or bio-based materials.
  • Cutting Scope 1 and 2 emissions by 57% and some Scope 3 emissions by 28% against a baseline year.
L'Orรฉal net zero roadmap 2030
Source: L’Orรฉal

The Lโ€™AcceleratOR program expands these efforts by tapping external innovation. Lโ€™Orรฉal supports startups to speed up solutions that can cut environmental impacts throughout its value chain.

Lโ€™Orรฉalโ€™s Scope 3 emissions are by far the largest part of its footprint, as seen below. This reflects impacts from sourcing, production inputs, logistics, product use, and end-of-life. In 2024, Scope 1 and 2 fell further to about 227,051 tCOโ‚‚e, showing continued reductions in direct and energy-related emissions. Total emissions, though, remained roughly stable at 7.41 million tCOโ‚‚e, increased with Scope 3 again the largest component.

Lโ€™Orรฉal Group GHG Emissions 2024
Source: Lโ€™Orรฉal

Lโ€™Orรฉal also has other sustainability initiatives. For example, its Fund for Nature Regeneration has invested more than โ‚ฌ25 million (about US$29.1 million) in projects like forest, mangrove, and marine ecosystem restoration. This reflects Lโ€™Orรฉalโ€™s commitment to nature and biodiversity alongside climate action.

Water stewardship is another strategic focus. In 2024, 53% of the water used in Lโ€™Orรฉalโ€™s industrial processes came from reused and recycled sources. This was supported through water recycling systems in areas facing water stress.

Implications for the Beauty and Consumer Goods Sector

Lโ€™Orรฉalโ€™s accelerator initiative reflects a larger industry trend. Many global companies are increasingly investing in sustainable technologies through partnerships, incubators, and venture funds. These partnerships aim to speed up climate, nature, and circular solutions. They combine corporate scale with startup agility.

The Lโ€™AcceleratOR program connects Lโ€™Orรฉal with companies that use innovation and partnerships to achieve their environmental goals. It also shows that sustainability strategies can go beyond internal changes. They can support the larger ecosystem, too. Helping startups scale can benefit whole industries, not just single companies.

This trend is important in areas like packaging, materials science, green chemistry, and digital climate tools. Packaging waste and carbon emissions from supply chains are major problems for consumer goods. This is especially true in beauty and personal care.

The beauty industry accounts for about 0.5% to 1.5% of global greenhouse gas emissions. Most of these emissions come from the value chain, not from company factories. For many beauty companies, around 90% of total emissions are Scope 3, such as raw materials, packaging, transport, and product use.

Raw material sourcing, including agricultural inputs and plastics, can make up 30% to 50% of industry emissions. Consumer use also adds a large share, especially for products that require water and heat.

beauty industry emissions

The industry produces about 120 billion beauty packaging units each year worldwide. Much of this packaging is single-use and hard to recycle. A typical beauty product can generate several kilograms of COโ‚‚-equivalent over its life cycle, from production to disposal.

Notably, most emissions are in the value chain. So, new solutions in packaging, materials, and data tools are key to cutting the beauty sectorโ€™s climate impact. This is what Lโ€™Orรฉal seeks to address. By supporting solutions in these areas, it hopes to change old industry practices.

Early Expectations and Next Stepsย 

The 13 selected startups will now enter the pilot readiness phase of the Lโ€™AcceleratOR program. During this phase, the startups will refine their technologies with CISL guidance and Lโ€™Orรฉal support. The goal is to ensure their solutions are ready for real-world testing in commercial environments.

If pilot outcomes are successful, solutions may be scaled beyond initial tests. Some could fit into Lโ€™Orรฉalโ€™s global operations or be used by industry partners. This would speed up sustainable progress.

Lโ€™Orรฉal and CISL plan future cohorts for the Lโ€™AcceleratOR program. Future rounds will create chances for more companies. They will also expand the pipeline of sustainable solutions.

By partnering with the University of Cambridge Institute for Sustainability Leadership and supporting startups across packaging, materials, ingredients, circular systems, and data tools, Lโ€™Orรฉal aims to fast-track real solutions that reduce environmental impacts.

The initiative boosts Lโ€™Orรฉalโ€™s sustainability plan, โ€œLโ€™Orรฉal for the Future.โ€ This plan sets bold goals for 2030, focusing on renewable energy, resource use, cutting emissions, and promoting circularity.

The pilot and scaling opportunities in the program can help new technologies join global supply chains. This support will aid Lโ€™Orรฉal and its partners in tackling climate, nature, and circular economy challenges towards its net-zero goals.

Microsoft (MSFT) Signs 2.85 Million Soil Carbon Credit Deal With Indigo in Landmark Regenerative Agriculture Move

On January 15, Indigo Carbon PBC announced one of the largest soil carbon transactions to date, marking a major milestone for regenerative agriculture in the voluntary carbon market. Under a 12-year agreement, Microsoft will purchase 2.85 million soil carbon credits generated through the Carbon by Indigo program, a large-scale, U.S.-based initiative focused on delivering high-integrity carbon removals.

This agreement underscores the increasing confidence of large corporate buyers in nature-based carbon removal pathways, particularly those that integrate climate impact with tangible on-the-ground benefits for farmers and ecosystems.

Third Transaction Strengthens Microsoftโ€™s Carbon-Negative Path

Microsoftโ€™s FY24 climate data reflects a 23.4% increase in overall emissions compared to its base year, largely due to rapid business expansion. Despite this, Microsoft retired 595,922 metric tons of carbon removals to meet its annual carbon-neutral target.

The latest purchase represents the third carbon credit transaction between Microsoft and Indigo. It follows earlier deals for 40,000 tonnes of credits in 2024 and 60,000 tonnes in 2025. Together, these agreements underscore Microsoftโ€™s long-term strategy to meet its commitment to become carbon negative by 2030.

Looking ahead, Microsoft has contracted for nearly 22 million metric tons of carbon removals to be delivered over the next 15 years or more. This includes 2.8 million tons expected in FY30, the companyโ€™s carbon-negative target year, with additional volumes planned beyond FY31.

microsoft carbon emissions carbon removal
Source: Microsoft

READ MORE:ย 

Indigo Ag Strengthens High-Integrity Carbon Removal Supply

The broader regenerative agriculture market continues to gain momentum.

  • Research showed that, valued at $1.52 billion in 2025, the market is projected to grow from $1.76 billion in 2026 to around $5.77 billion by 2034, reflecting a CAGR of 15.97%.

Practices such as cover cropping, rotational grazing, reduced tillage, and compost application improve soil carbon levels and microbial diversity. As voluntary carbon markets mature, regenerative agriculture is emerging as a durable climate solution and a scalable economic opportunity for farmers.

For Indigo, the deal further cements its leadership in scaling verified soil carbon removals, demonstrating that regenerative agriculture can deliver credits at volumes large enough to meet enterprise-level demand.

regenerative market
Source: Precedence Research

Regenerative Agriculture: Climate Impact Plus Farm Productivity

Governments and climate institutions increasingly recognize regenerative agriculture as a powerful carbon removal tool.

  • Research suggests these practices could remove more than 3.5 gigatons of COโ‚‚ equivalent annually, while also improving soil health, increasing crop resilience, and stabilizing yields.

Beyond carbon, regenerative practices deliver critical co-benefits. They enhance water infiltration, reduce erosion, and support water conservationโ€”key advantages as drought and water scarcity intensify across agricultural regions. These outcomes also strengthen rural economies by improving long-term farm productivity.

New Revenue Streams for Farmers

At a time when farmers face rising costs, climate volatility, and market uncertainty, the Microsoft-Indigo agreement delivers meaningful financial incentives. By rewarding farmers for adopting regenerative practices, the deal improves farm resilience while creating new, non-government revenue streams.

Indigo currently works with farmers across more than eight million acres and has paid $40 million through its programs to date. These payments are independent of government subsidies, offering farmers greater financial flexibility and stability.

High-Integrity Credits Meet ICVCM Core Carbon Principles

Credit integrity is a defining feature of the agreement. It is among the first soil carbon deals to include credits approved under the Integrity Council for the Voluntary Carbon Marketโ€™s (ICVCM) Core Carbon Principles.

Indigo has issued 927,296 carbon removal and reduction credits under CAR1459 using the Climate Action Reserveโ€™s Soil Enrichment Protocol. The company relies on peer-reviewed science, field data, remote sensing, and machine learning to measure and verify soil carbon outcomes.

To address permanence risks, Indigo has added safeguards across the 40-year durability period agreed with Microsoft, complementing the protocolโ€™s 100-year monitoring and reversal compensation requirements.

On an end note, Meredith Reisfield, Senior Director of Policy, Partnerships, and Impact at Indigo, said:

โ€œMicrosoftโ€™s purchase highlights the transformative power of regenerative agriculture to support watersheds, support farming communities, and advance global net-zero goals. Indigo is a proud catalyst of todayโ€™s soil carbon market, with our long-standing history of farmer collaboration and proven impact, already saving 64 billion gallons of water and issuing nearly one million tonnes of CO2e carbon removal credits since 2018.โ€

Gold Prices Smash Another Record: Spot Gold Hits $4,689 Allโ€‘Time High as Central Banks Go on a Buying Spree

Gold prices have climbed to historic levels in global markets, with Bloomberg reporting that spot gold hit an intraday allโ€‘time high ofย 4,689.15 dollars per ounce on January 19, 2026. This milestone underscores intense safeโ€‘haven demand as investors navigate ongoing macroeconomic uncertainty and shifting expectations for future interestโ€‘rate cuts.

Goldโ€™s latest surge extends a powerful bull run. In 2025, the metal posted more than 50 new record highs and delivered a yearly return of over 60 percent, drawing in institutional investors, central banks, and retail traders seeking diversification and protection against market volatility.

Over the past two years, gold prices have roughly doubled, a rare feat for a major, highly liquid commodity, reinforcing its statusย as a store of value and hedge against inflation and geopolitical risk.

Gold price chart
Source: Bloomberg

Why Investors Flock to Gold: Safe Haven and Policy Signals

A key driver of the gold rally is shifting expectations around monetary policy, especially in the United States. Many investors now expect the Federal Reserve to cut interest rates in 2026.

When interest rates fall, gold becomes more attractive because it does not pay interest or dividends. This lowers the opportunity cost of holding gold compared with bonds or savings.

The U.S. dollar has also shown signs of weakening against other major currencies at times, another factor that boosts gold demand. A weaker dollar makes gold cheaper for holders of nonโ€‘U.S. currencies, increasing global buying pressure.

During periods of market stress and geopolitical tension, investors often treat gold as a safe haven. These conditions have become more common in late 2025 and early 2026, driving flows into goldโ€‘related investments.

Central Banks: The Steady Hands Behind Goldโ€™s Rally

Central banks have played an unusually large role in supporting gold prices. According to World Gold Council data, global central banks added 1,044.6 metric tons of gold to reserves in 2024. This was the third year in a row that purchases exceeded 1,000 tons. This amount is much higher than the long-term average of about 473 tons from 2010 to 2021.

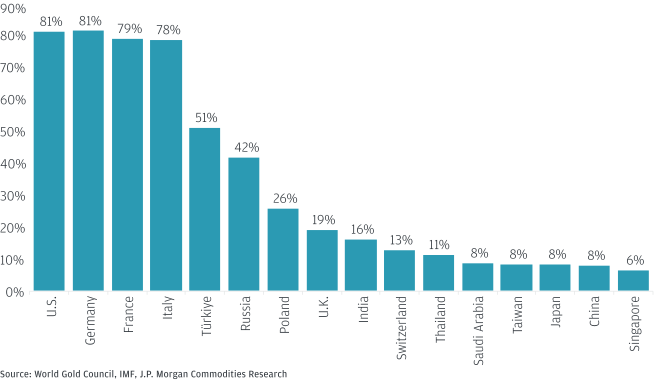
Gold as a percentage of total reserve holdings across select central banks

Bar chart showing gold as a percentage of total reserve holdings across select central banks, led by the U.S. with 74%, followed by Germany, France and Italy.

The trend continued into 2025, with central banks acquiring substantial amounts through the third quarter. Net quarterly demand from investors and central banks hit about 980 tons. This equals roughly $109 billion in gold inflows for Q3 2025.

Major buyers include emerging market central banks such as Poland, China, India, and Turkey, each adding significant quantities to their reserves. These purchases help reduce reliance on foreign currencies and support financial diversification strategies.

gold reserves by country q3 2025
Source: World Gold Council; data as of Q3 2025

Strong central bank buying has limited the amount of gold available on the markets for other buyers. Because these purchases tend to be longโ€‘term and priceโ€‘insensitive, they act as a stable base of demand, supporting higher price levels.

Supply Tightness Keeps Prices Elevated

Gold supply has struggled to keep pace with rising demand. Mining production reached a record 3,661 metric tons in 2024, a modest increase of 0.6% yearโ€‘overโ€‘year.

Production gains happened in Mexico, Canada, and Ghana. However, rising costs have offset some of this growth. Overall cost to produce gold, measured as allโ€‘in sustaining cost (AISC), rose to about $1,399 per ounce in 2024, up roughly 8% from the prior year.

Mined gold production 2024
Source: World Gold Council

Recycling and secondary supply help the market, but they have limits. These sources havenโ€™t eased market tightness much. The combination of constrained supply and strong demand keeps pressure on prices.

Global Ripple Effects: From Central Banks to Exploration

Rising gold prices have real economic and financial impacts. In the Philippines, for instance, the Bangko Sentral ng Pilipinas noted that its gold holdings jumped about 70% in 2025. They reached a record $18.6 billion. This rise was mainly due to a big increase in gold prices. Gold now makes up about 17% of the central bankโ€™s foreign exchange reserves.

Around the world, strong gold prices have influenced central bank profits and balance sheets. The Swiss National Bank reported one of its highest profit levels in history in 2025, driven in part by gains on its gold holdings as prices rallied.

High prices have also affected exploration activity. Australia’s gold exploration spending jumped about 34% year-over-year in Q2 2025. This rise shows growing interest in new projects as prices have gone up.

What This Means for Investors and Markets

The current rise in gold prices shows a mix of economic risks, expectations about monetary policy, and high demand from official sectors. These forces suggest that goldโ€™s role as a defensive asset remains important in the current environment.

While gold does not produce income, it continues to attract buyers seeking stability and diversification. Central banks are accumulating gold. This, along with strong investor demand and limited supply, pushes prices up.

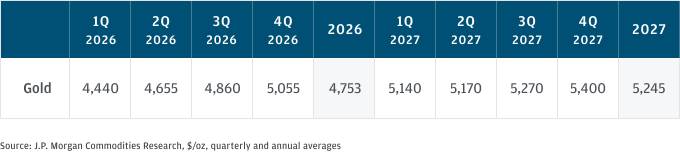
Analyst forecasts suggest that gold may remain elevated in the coming year if these conditions persist. Some forecasts suggest gold might average around $4,753 per ounce until 2026, per J.P. Morgan’s forecast. It could rise more in 2027 if global economic stress grows.

Table showing gold price forecasts for 2026 and 2027 with prices forecast to average $4,400/oz in 1Q, $4,655/oz in 2Q and $4,860/oz in 3Q and $5,055 in 4Q 2026.

In this context, goldโ€™s rise is not just a shortโ€‘term spike. It highlights key changes in how investors, banks, and governments deal with uncertainty and risk. As these trends evolve, gold is likely to remain a key asset in global financial markets.

Beyond market forces and central bank demand, the gold industry is also under pressure to reduce its environmental impact and align with global climate goals.

Gold Goes Green: Miningโ€™s Climate and Net-Zero Push

Gold mining produces greenhouse gas emissions, mostly from fuel and electricity used in mining and processing. In 2023, primary gold mines around the world released about 46.6 million metric tons of COโ‚‚ equivalent (COโ‚‚e) from direct (Scope 1) and electricity (Scope 2) emissions. This number reflects the energyโ€‘intensive nature of mining operations.

Leading gold producers have set clear climate targets to reduce emissions and improve sustainability. For example, Barrick Gold aims to cut its own operational Scopeโ€ฏ1 and Scopeโ€ฏ2 emissions by at least 30% by 2030 from a 2018 baseline. It also plans to reach netโ€‘zero emissions by 2050 as part of its longโ€‘term climate strategy. The company is investing in big solar power plants to reduce the use of fossil fuels. One of these is a 200 MW solar farm for the Nevada Gold Mines complex.

Newmont Corporation, a leading gold producer, also plans to cut greenhouse gas emissions by 30% by 2030. They also aim for net-zero carbon emissions by 2050. The company is shifting its energy mix and investing in cleaner technologies to meet these goals.

Gold Fields has committed to cutting its Scopeโ€ฏ1 and Scopeโ€ฏ2 emissions by 30% by 2030 from a 2016 baseline and to reach netโ€‘zero emissions by 2050. In 2023, the company reduced its emissions intensity to 660โ€ฏkg COโ‚‚e per ounce of gold, compared with 669โ€ฏkg COโ‚‚e per ounce in 2022. It plans further cuts through increased use of renewables, energy efficiency, and lowerโ€‘carbon mine equipment.

Renewables Powering Gold Production

Some producers are already deploying renewable energy at scale. For example, Barrickโ€™s Nevada operations have reduced electricityโ€‘related emissions by investing in solar power and renewable energy credits.

Other mines are testing battery-electric haul trucks. Theyโ€™re also using renewable microgrids and off-grid solar and wind sites. This helps cut diesel use and lower carbon output.

These company commitments show that gold mining firms are integrating emissions reduction into their business plans. Many have set 2030 interim goals to lower emissions, and most aim for netโ€‘zero emissions by 2050, in line with global climate targets.

Beyond individual companies, the gold industry as a whole is moving toward sustainability. The World Gold Councilโ€™s Net Zero by 2050 framework guides miners across the sector. It focuses on greater use of renewable energy, electrification of operations, and closer engagement with suppliers.

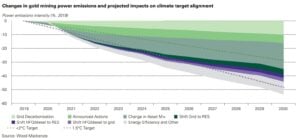
gold mining power emissions

In 2024, renewable sources accounted for about 35% of electricity used in gold mining, up from roughly 15% in 2019. This shows steady progress in cutting power-related emissions.

Goldโ€™s recent price rise shows global economic uncertainty. It also reflects strong demand from investors and central banks. At the same time, the industry is taking meaningful steps to reduce emissions and advance sustainability. This shows that gold can be both a safe investment and a cleaner, more responsible choice.

Rio Tinto and Amazon Web Services (AWS) Join Forces to Supply Low-Carbon Copper for U.S. Data Centers

Rio Tinto has taken a decisive step toward reshaping the future of copper supply. The mining major announced a strategic collaboration with Amazon Web Services (AWS) that connects breakthrough mining technology with surging demand from data centers and artificial intelligence. Under the agreement, AWS became the first customer of Nutonยฎ Technology following its successful industrial-scale deployment at the Johnson Camp copper mine in the United States.

The deal links cleaner copper production with the digital infrastructure powering the global AI economy.

How AWS Cloud Technology Is Powering Nutonโ€™s Bioleaching Breakthrough

Nuton, a Rio Tinto venture, focuses on nature-based bioleaching technologies designed to extract copper from low-grade and previously uneconomic ores. Last month, the company achieved a major milestone by deploying its proprietary system at an industrial scale at Gunnison Copperโ€™s Johnson Camp mine in Arizona.

NUTON rio tinto copper
Source: Nuton

The press release highlights that under the two-year agreement, AWS will use the first Nuton-produced copper in components across its U.S. data centers. Copper is essential to these facilities, playing a critical role in electrical cables, busbars, transformers, motors, printed circuit boards, and processor heat sinks.

At the same time, AWS will also provide cloud-based data and analytics to support Nutonโ€™s operations. This digital support will speed up process optimization and improve copper recovery.

AWS platforms will simulate heap-leach performance and feed advanced analytics into Nutonโ€™s decision systems. As a result, the company can fine-tune acid and water use. It can also better predict copper recovery.

Significantly, Amazonโ€™s Chief Sustainability Officer Kara Hurst said the companyโ€™s net-zero goal for 2040 requires innovation across all operations, including how it sources materials for its infrastructure.

She also noted:

โ€œThis collaboration with Nuton Technology represents exactly the kind of breakthrough we needโ€”a fundamentally different approach to copper production that helps reduce carbon emissions and water use. As we continue to invest in next-generation carbon-free energy technology and expand our data centre operations, securing access to lower-carbon materials produced close to home strengthens both our supply chain resilience and our ability to decarbonize at scale.โ€

Microbe-Driven Copper, Digitally Scaled

Nutonโ€™s modular bioleaching system uses naturally occurring microorganisms to extract copper from primary sulphide ores. Unlike traditional mining methods, the process avoids energy-intensive crushing, concentrating, and smelting.

When combined with digital tools, the technology can scale faster and adapt to different ore bodies. Overall, this approach shortens the path from pilot testing to full production. At the same time, it lowers environmental impact.

Shorter Supply Chains and Cleaner Copper

Additionally, Nutonโ€™s process produces 99.99% pure copper cathode directly at the mine gate. This eliminates the need for concentrators, smelters, and refineries, significantly shortening the mine-to-market supply chain.

Compared with traditional processing routes, Nuton is expected to use substantially less water and generate lower carbon emissions. The system also recovers copper from material previously classified as waste, improving overall resource efficiency.

At Johnson Camp, these benefits are already material. The mine is now the lowest-carbon primary copper producer in the United States on a mine-to-refined-metal basis commonly used by the industry.

copper
Source: Nuton

Verified Low Carbon and Water Footprints

A third-party life cycle assessment confirmed that Nuton copper from Johnson Camp is expected to have a full-scope carbon footprint of 2.82 kg COโ‚‚e per kilogram of copper, covering Scope 1, 2, and 3 emissions. By comparison, global primary copper production typically ranges from about 1.5 to 8.0 kg COโ‚‚e per kilogram, depending on technology and location.

Nuton has also matched 100% of the siteโ€™s electricity consumption by purchasing 134,000 Green-e Energy certified renewable energy certificates. Water intensity is expected to be 71 liters per kilogram of copper, well below the global industry average of roughly 130 liters.

Skarn Associates independently validated both the carbon and water intensity data. Additional environmental benefits include lower energy use, on-site clean energy generation, and zero tailings, removing the risk of tailings dam failures.

A Strategic Copper Asset for the United States

Johnson Camp is one of the largest open-pit copper projects in the U.S., with measured and indicated resources of 551 million tons at an average grade of 0.35% copper. At scale, it could supply around 8% of recent annual U.S. domestic copper production.

The project is targeting production of approximately 30,000 tonnes of refined copper over a four-year deployment period. This comes as the U.S. has formally designated copper as a critical mineral due to its importance for energy systems, digital infrastructure, and national security.

u.s. copper
Data Source: USGS

IEA and S&P Global Warn of Surging Demand and Supply Risks

The International Energy Agency (IEA) has highlighted that the rapid growth of artificial intelligence is driving a sharp expansion of data centers worldwide. While estimates vary widely, the IEA notes that copper use in data centers could reach 250,000 to 550,000 tonnes by 2030, accounting for up to 12% of global copper demand, depending on how quickly AI adoption accelerates.

demand copper
Source: IEA

At the same time, a fresh analysis from S&P Global has warned that growth in artificial intelligence, electrification, and defense could push global copper demand up by 50% by 2040. However, without major investment in new mining projects and recycling, supply is expected to fall short.

global copper demand
Source: S&P Global

Yet, as existing copper resources age and ore grades decline, the market could face a 10 million metric ton annual supply shortfall by 2040.

copper demand and supply
Source: S&P Global

Why the Rio Tintoโ€“AWS Deal Matters

Against this backdrop, the collaboration between Rio Tinto and AWS carries strategic weight. It connects low-carbon copper supply directly with one of the worldโ€™s fastest-growing sources of demand. It also shows how digital infrastructure and nature-based mining solutions can work together to reduce emissions while expanding supply.

As AI, electrification, and energy transition pressures continue to build, innovations like Nutonโ€™s bioleaching technology could play a critical role in closing the global copper gapโ€”cleanly, efficiently, and at scale.

To summarize the importance of this deal, Rio Tinto Copper Chief Executive Katie Jackson said,ย 

โ€œThis collaboration is a powerful example of how industrial innovation and cloud technology can combine to deliver cleaner, lower-carbon materials at scale. Nuton has already proven its ability to rapidly move from idea to industrial production, and AWSโ€™s data and analytics expertise will help us to accelerate optimisation and verification across operations.

She further added:

โ€œImportantly, by bringing Nuton copper into AWSโ€™s U.S. data-centre supply chain, weโ€™re helping to strengthen domestic resilience and secure the critical materials those facilities need, closer to where theyโ€™re used. Together we can supply the copper critical to modern data infrastructure while demonstrating how mining can contribute to more sustainable supply chains.โ€

Google Powers U.S. Data Centers with 1.2 GW of Carbon-Free Energy from Clearway

Google has agreed to buy nearly 1.2 gigawatts (GW) of carbon-free energy to power its data centers across the United States. The tech company signed a set of long-term power purchase agreements (PPAs) with Clearway Energy Group (Clearway). These deals will deliver clean electricity from new wind and solar projects in Missouri, Texas, and West Virginia.

The energy will support the electric grid regions where Googleโ€™s data centers are located. The agreements are a big step for the tech giant. They help meet its rising electricity needs and cut carbon emissions from its operations.

Amanda Peterson Corio, Global Head of Data Center Energy, Google, stated:

“Strengthening the grid by deploying more reliable and clean energy is crucial for supporting the digital infrastructure that businesses and individuals depend on. Our collaboration with Clearway will help power our data centers and the broader economic growth of communities within SPP, ERCOT, and PJM footprints.”

How Google Secures Carbon-Free Power

A Power Purchase Agreement is a long-term contract between a power buyer and a clean energy producer. In Googleโ€™s case, these contracts ensure that the projects Clearway builds will sell electricity to the grid. In return, Google pays for the energy produced over many years.

Clearway agreed to provide Google with 1.17 GW of new carbon-free energy. This energy will support regional grids like SPP, ERCOT, and PJM. The total partnership includes a 71.5 megawatt (MW) clean power deal in West Virginia. This brings the total to around 1.24 gigawatts (GW) of clean energy for Googleโ€™s use.

These projects will generate wind and solar power and deliver it into U.S. grid systems that serve Googleโ€™s data centers. The total investment in the new energy infrastructure tied to these deals exceeds $2.4 billion.

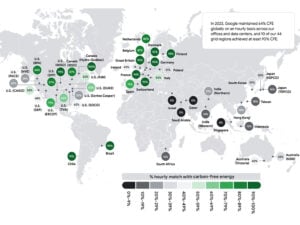
google data center map
Google’s data center map; Source: Google

Construction for the new wind and solar assets is expected to begin soon, with the first facilities planned to start operations in 2027 and 2028.

The states involved are Missouri, Texas, and West Virginia. These states cover parts of major grid regions like SPP (Southwest Power Pool), ERCOT (Electric Reliability Council of Texas), and PJM Interconnection, which deliver power to millions of customers and data centers.

Why Google Is Investing in Clean Power

Google has set clear climate goals tied to its fast-growing energy use. In 2020, the company became the first major corporation to match 100% of its annual electricity use with renewable energy purchases. This means Google buys enough clean power each year to equal all the electricity its operations consume. However, this approach does not guarantee clean energy at every hour.

Google carbon-free energy goal 2030
Source: Google

To address this gap, Google launched a more ambitious target. The company aims to operate on carbon-free energy, 24 hours a day, 7 days a week, by 2030. This goal goes beyond traditional renewable matching. It requires clean electricity to be available every hour in the same regions where Google uses power. This makes energy sourcing more complex and increases the need for new clean generation near data centers.

Google has also committed to reaching net-zero emissions across its operations and value chain by 2030. This includes direct emissions, purchased electricity, and indirect emissions from suppliers and construction.

  • The tech company does not plan to rely heavily on carbon offsets for this goal. Instead, it focuses on cutting emissions at the source, mainly by cleaning up the electricity supply.

Progress so far shows both gains and challenges. In 2024, Google reported net emissions of about 18 million metric tons of COโ‚‚-equivalent, up from 14.3 million in 2023. The increase came largely from data center expansion and higher electricity demand from artificial intelligence workloads.

Google carbon emissions 2024

At the same time, Google reduced the carbon intensity of its electricity use by about 12% compared with the previous year. This shows efficiency gains, even as total energy use rose.

google emissions
Source: Google

Clean energy purchases play a key role in this strategy. By signing long-term power purchase agreements, Google helps bring new wind and solar projects online. These projects add clean power to local grids and lower emissions over time.

The nearly 1.2 GW of carbon-free energy announced for U.S. data centers supports this approach. It increases clean supply in regions where Googleโ€™s power demand is growing fastest.

Broader Clean Energy Strategy

Googleโ€™s clean energy purchasing strategy goes beyond these 1.2 GW agreements. The company continues to enter renewable contracts around the world. For example:

  • Google and TotalEnergies signed a 15-year PPA to supply 1.5 terawatt-hours (TWh) of certified renewable electricity from the Montpelier solar farm in Ohio. This power will help support Googleโ€™s data centers in that region.

  • Google is also active in international renewable power agreements. It has signed a 21-year PPA with TotalEnergies. This deal provides 1 TWh of solar power for its data centers in Malaysia.

  • In India, Google made a deal with ReNew Energy. They will build a 150 MW solar project in Rajasthan. This project will generate about 425,000 MWh of clean electricity each year, which is enough to power more than 360,000 homes.

These deals illustrate how Google is diversifying its clean energy supply by securing multiple sources and technologies across continents.\

Impact on Data Centers and Regional Grids

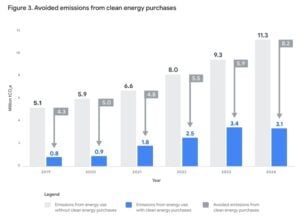
Data centers use large amounts of electricity. U.S. data centers’ electricity consumption reached 183 TWh in 2024, accounting for more than 4% of the nation’s total power demand amid surging AI workloads. โ€‹This marked a continued rise from 176 TWh (4.4%) in 2023. Projections suggest 5% or higher in 2025 as hyperscale facilities expand rapidly.

US data center power use 2030 BLoomberg

When powered by fossil fuels, they also produce high carbon emissions. Clean energy purchases help reduce the carbon footprint of these facilities over time.

Source: Google

As data center demand continues to grow, companies like Google are adding new clean power to the grid. Long-term power purchase agreements support the construction of new wind and solar projects. These projects supply clean electricity to regional grids and benefit all users, not only data centers. This helps lower the overall carbon intensity of power systems.

What This Means for Corporate Renewable Leadership

Googleโ€™s nearly 1.2 GW clean energy purchase reflects a wider industry shift. Large technology firms are becoming some of the worldโ€™s biggest buyers of renewable power. As artificial intelligence and cloud services expand, long-term clean energy contracts help companies secure a stable power supply and manage energy costs.

These corporate agreements also play a key role in the U.S. energy market. Long-term PPAs give developers the financial certainty needed to build new renewable projects. Supported by policy incentives and rising corporate demand, U.S. wind and solar capacity continues to grow. This makes large clean energy portfolios increasingly viable for companies like Google.

The Clearway deal adds to Googleโ€™s global portfolio of renewable energy contracts. This portfolio spans multiple regions and energy technologies. By securing large volumes of clean power, Google is strengthening the sustainability of its data centers as digital demand continues to rise.

eBay Maps Out Path to Net-Zero by 2045 with Science-Based Climate Plan

eBay has released its first Climate Transition Plan, outlining how the company will reduce emissions and reach netโ€‘zero greenhouse gas (GHG) emissions by 2045. The plan covers actions across eBayโ€™s operations and its broader business ecosystem. It also sets nearโ€‘term milestones and embeds climate action into corporate governance and planning.

The strategy was validated by the Science Based Targets initiative (SBTi), aligning it with climate science and the Paris Agreementโ€™s 1.5ยฐC goal.

The Climate Transition Plan reflects eBayโ€™s commitment to sustainable commerce. It builds on years of progress in cutting emissions, scaling renewable energy, and driving circular economy practices.

The plan also shows how the company will cut emissions in its operations and value chain. This includes transportation, logistics, and the marketplace. At the same time, it aims to grow its global business.

eBayโ€™s Climate Transition Plan: Sustainable Commerce at the Core

eBayโ€™s Climate Transition Plan is a detailed roadmap for climate action through 2045. It identifies both climate risks and opportunities for the business. The plan focuses on four main areas: sustainable commerce, emissions reduction, governance integration, and value chain collaboration.

eBay net zero actions
Source: eBay

Sustainable Commerce

The plan emphasizes eBayโ€™s circular marketplace model, which extends the life of products and reduces waste. This model supports resale and reuse, helping customers make more sustainable choices. The company has framed this as a way to grow while cutting environmental impact.

Clear Path to Net Zero

eBay has outlined scienceโ€‘aligned pathways to reach netโ€‘zero GHG emissions by 2045. These pathways include near-term targets for 2030 and long-term goals for 2045. The SBTi validates them to ensure they align with climate science.

Governance and Planning

Climate action is now embedded into how eBay governs and plans its business. The company has strengthened oversight by senior leadership and aligned climate goals with financial planning. eBay says this integration helps ensure climateโ€‘related decisions influence business outcomes.

Value Chain Collaboration

eBay will partner with carriers, suppliers, policymakers, and its buyers and sellers to cut emissions beyond its own operations. The focus is on expanding low-carbon delivery options. It also aims to reduce emissions from shipping and logistics.

eBayโ€™s Net Zero Targets: 2030 Milestones and Beyond

eBayโ€™s climate goals cover both emissions cuts and longโ€‘term netโ€‘zero targets. These goals are scienceโ€‘based and validated by the Science-Based Targets initiative. This validation shows that the targets match the reductions needed. They aim to keep global warming below 1.5ยฐC above pre-industrial levels, which aligns with the Paris Agreement.

Netโ€‘Zero by 2045: eBay has committed to achieving netโ€‘zero GHG emissions across its entire value chain by 2045. This means cutting total emissions by 90% from 2019 levels. Also, we will use strong, lasting carbon removals to offset any emissions left between 2030 and 2045.

2030 Nearโ€‘Term Targets: To support the longโ€‘term netโ€‘zero goal, eBay set interim targets for 2030:

  • Reduce absolute Scope 1 and 2 emissions by 90% compared with 2019.
  • Reduce Scope 3 emissions from downstream transportation and distribution by 27.5% compared with 2019.

Progress to Date: eBay has already achieved significant cuts in operational emissions:

eBay emission reductions scope 1 and 2
Source: eBay
  • The company has achieved a 92% reduction in Scope 1 and 2 emissions relative to 2019.
  • It has reached 100% renewable electricity for all offices, data centers, and authentication centers ahead of its original 2025 target.
eBay Electricity Supply from Renewable Energy Sources
Source: eBay
  • Downstream transportation and distribution emissions have fallen 21% compared with 2019, moving toward the 27.5% 2030 target.

These results show that eBay is ahead in some areas and making progress in others as it works toward its future climate goals.

Scope 3 Challenges: The largest portion of eBayโ€™s emissions comes from Scope 3, particularly shipping. Shipping accounts for almost 84% of Scope 3 emissions, making it the toughest category to decarbonize. eBay is focusing on partnerships with carriers and lowโ€‘carbon options to reduce these emissions over time.

eBay carbon emissions 2024
Source: eBay

eBayโ€™s Broader Sustainability Initiatives

eBay goes beyond reducing greenhouse gases. It takes various sustainability steps that link climate goals to its business strategy.

  • Renewable Energy

eBay achieved its goal of sourcing 100% renewable energy for its operations in 2024, one year ahead of schedule. This renewable energy covers electricity for offices, data centers, and related facilities.

  • Circular Economy and Recommerce

eBay focuses on recommerce. This means used and refurbished goods are bought and sold. In 2024, this recommerce activity:

    • Generated about $5 billion in positive economic impact.
    • Helped avoid 1.6 million metric tons of carbon emissions.
    • Prevented 70,000 metric tons of waste. These figures show how extending product life can reduce environmental impact.

eBay aims to build on these results by encouraging resale and reuse as mainstream shopping choices. The company views a circular business model as a climate tool and a way to create value for its users.

  • Tracking and Transparency

eBay tracks its environmental performance through frameworks like the Task Force on Climateโ€‘Related Financial Disclosures (TCFD). It also takes part in the CDP Corporate Questionnaire.

These actions help ensure the e-commerce’s transparency and accountability in climate reporting.

Leading by Example

eBay’s climate goals align it with other tech and retail companies. They have set science-based net-zero targets and interim reduction goals. For example, other eโ€‘commerce and tech firms like Amazon and Alibaba have also set longโ€‘term climate targets. However, their timelines and scopes differ.

Validating targets through the SBTi adds credibility and aligns eBay with companies that aim to match the most ambitious climate science benchmarks. The SBTiโ€™s validation process makes sure that reduction goals are clear. They follow a framework that aims to keep global temperature rise to 1.5ยฐC.

In addition, eBayโ€™s focus on shipping emissions highlights a common challenge for online retail platforms. Many companies are exploring low-carbon logistics. They are using consolidated delivery, local pickup, and shifting modes, like moving from air to ground transport. These steps help cut supply chain emissions.

eBay GHG Emissions by Category, 2024
Source: eBay

eBay focuses on circular commerce and sustainable logistics in its transition plan. This aligns environmental efforts with business trends that value resource efficiency and low-carbon operations.

Low-Carbon Innovation for the Future

eBayโ€™s Climate Transition Plan sets a clear and scienceโ€‘based path to netโ€‘zero GHG emissions by 2045. The plan includes nearโ€‘term and longโ€‘term targets that have been validated by the Science Based Targets initiative.

The e-commerce company has already achieved major milestones, such as a 92% reduction in direct emissions and 100% renewable electricity by 2024. It also continues to invest in renewable energy, promote reuse and resale, and engage partners to cut emissions across its value chain.

The plan further shows eBayโ€™s goal to include climate action in its strategy, governance, and financial planning. It also illustrates how sustainable commerce and circular economy practices can support longโ€‘term environmental and business goals. As shipping and logistics remain the largest emissions source, future efforts will focus on creative and lowโ€‘carbon solutions to meet eBayโ€™s ambitious climate goals by 2045.

EU Carbon Prices Hit Highest Since August 2023: What Causes The Surge?

Carbon permits in the European Union have recently climbed to their highest levels since August 2023. The rise reflects tighter supply, policy decisions, and shifting market demand under the EU Emissions Trading System (ETS).

The ETS is the worldโ€™s largest cap-and-trade system for greenhouse gas emissions. It mandates large emitters to buy allowances for the carbon dioxide they emit. These allowances are known as EU Allowances (EUAs).

EUAs are now trading at a price over โ‚ฌ92 per tonne โ€” the strongest level in about 18 months. This rise shows that companies and markets expect fewer allowances to be available in the future as the EU tightens its emissions cap.

What Is the EU Emissions Trading System?

The EU ETS began in 2005 as a tool to reduce greenhouse gas emissions through market forces. It sets a cap on total emissions from major sectors such as power generation, manufacturing, and aviation. Companies must hold enough allowances to cover their emissions each year.

The cap reduces over time, meaning fewer EUAs are issued. This creates scarcity. As allowances become scarcer, their price tends to rise, which increases costs for polluters. In theory, this pushes companies to reduce emissions or invest in cleaner technology.

In 2026, the system also overlaps with the Carbon Border Adjustment Mechanism (CBAM), a tax on imported carbon-intensive goods. CBAM began to apply in January 2026 and makes carbon costs visible on imports like steel and cement. The measure aims to cut down on โ€œcarbon leakage.โ€ This happens when industries move production to areas with cheaper carbon prices.

Recent Price Moves: Highest Since August 2023

In early January 2026, EU carbon permits climbed as high as about โ‚ฌ91.82 per tonne on EU markets, up from lower levels earlier in 2025. Now, it’s trading at over โ‚ฌ92 per tonne, showing 27% increase from January 2025 prices. The rise represents a fourth consecutive weekly gain in allowances for the December 2026 contract.

EU Carbon Prices January 2025 - January 2026
Data source: TradingEconomics

The price rise reflects tightening supply โ€” fewer allowances are available through auctions and free allocations. Reduced supply increases competition among companies that must surrender EUAs to match their emissions. This dynamic pushes the price higher.

Market analysts also note that colder weather and more heating needs in winter often boost industrial energy demand. This can lead to higher carbon prices during the season.

Why Prices Have Risen?

The recent uptick in EU carbon prices is driven by several key factors:

  • Reduced Supply of Allowances:

The EU continues to tighten its emissions cap and reduce the number of new allowances issued. Estimates from the European Exchange auction calendar and Market Stability Reserve show that auction volumes will drop. They are expected to fall from about 588.7 million EU Allowances in 2025 to around 482.4 million in 2026. A stronger cap reduces the total pool of tradable EUAs, creating scarcity and upward pressure on prices.

  • Policy Signals and Reform Expectations:

Investors and companies anticipate future regulatory tightening. The EUโ€™s long-term climate goals include cutting net emissions by 90% by 2040 compared with 1990 levels. Such policy signals can strengthen confidence that carbon costs will rise further.

  • Market Confidence and Funds:

Investment funds have increased their holdings of EU carbon futures. Trading positions and speculation can also influence price momentum, especially as market sentiment shifts toward tighter futures.

  • Compliance Demand:

Industries covered by the ETS are required to surrender allowances to match their emissions by compliance deadlines. As deadlines near, buying activity can increase, adding short-term upward pressure on prices.

  • Carbon Border Adjustment Mechanism:

With CBAM now active, imported products from outside the EU face carbon costs similar to domestic industries. This mechanism can reduce free allowance allocations and tighten supply further.

Looking Back and Ahead: Carbon Price Trends and Forecasts

Carbon prices in the EU ETS have fluctuated over recent years. Prices surged above โ‚ฌ100 per tonne in early 2023. Then, they eased back in 2024 and 2025. This decline was due to shifting market conditions and wider economic factors.

In 2024, the average price of EU ETS carbon permits was around โ‚ฌ65 per tonne, down from โ‚ฌ84 per tonne the year before. High prices in 2023 reflected strong policy signals from the Fit for 55 climate package and global energy disruptions.

Looking ahead, analysts and forecast models expect prices to continue rising over the coming decade:

  • A survey of market participants predicts that the average EU ETS carbon price will rise to almost โ‚ฌ100 per tonne from 2026 to 2030. This increase will happen as demand exceeds supply.
  • Energy market analysts predict that the average price could hit about โ‚ฌ126 per tonne by 2030. This rise is due to stricter caps and wider emission coverage.
  • Under the EU ETS II framework, starting in 2027, more sectors will be included, like buildings and transport. In some scenarios, prices might average โ‚ฌ99 per tonne from 2027 to 2030.
  • BNEF’s EU ETS II Market Outlook projects carbon prices reaching โ‚ฌ149 per metric ton ($156/t) by 2030, driving substantial emissions reductions.
EU carbon prices 2030 BNEF
Source: BNEF

Overall, these forward estimates imply that allowance prices may continue to rise as the EU strengthens its emissions targets to meet climate goals.

Emissions Reductions Under the ETS

The EU ETS has contributed to measurable emissions reductions. In 2024, emissions under the system were roughly 50% lower than in 2005. This progress is set to help the EU meet its 2030 goal of a 62% reduction from 2005 levels. The decline was driven mainly by cuts in the power sector, with increased renewable energy and a shift away from coal and gas.

Renewable energy growth, including wind and solar, played a role. Increases in renewables helped lower emissions by reducing reliance on fossil fuels.

The drop in emissions may lead to higher demand for allowances in the long run. With fewer emissions, companies will need more allowances to meet the cap.

What Higher Carbon Prices Mean for Industry

Higher carbon prices affect the European economy in many ways. For polluting industries, rising carbon costs increase operating expenses. Companies may invest more in cleaner technologies to reduce their allowance needs. This can accelerate decarbonization technology adoption.

Policy makers face the challenge of balancing climate goals with economic competitiveness. Some EU governments, like France, want price limits in the ETS. This could stop big swings in carbon costs. It would also help industries plan better.

The Market Stability Reserve (MSR), a mechanism to absorb excess allowances, also plays a role. It intends to reduce surplus permits and stabilize prices. Combined with the tightening cap, the MSR tends to push prices higher over time.

The ETSโ€™s expansion to include more sectors โ€” such as maritime transport and potentially buildings and road transport under EU ETS II โ€” expands the share of emissions subject to carbon pricing. This broadening can further tighten supply and push prices up.

Why EU Carbon Prices Matter Beyond Europe

The EU ETS remains the largest carbon market in the world. According to global carbon pricing data, carbon pricing instruments currently cover about 28% of global greenhouse gas emissions, up from about 24% previously. The EUโ€™s system is a key driver of this trend.

GHG emissions covered by carbon pricing
Source: World Bank Report

Many national and regional carbon markets have prices much lower than the EUโ€™s. This shows differences in climate policies and economic situations. The ETSโ€™s tightening emissions cap, reduced auction volumes, and shifting market sentiment all play roles in supporting higher carbon prices.

Forecasts suggest that prices may continue upward in the years to come, potentially averaging over โ‚ฌ100 per tonne by the end of the decade. Meanwhile, the ETS continues to help reduce emissions in key sectors and supports the EUโ€™s broader climate targets.

These price trends and policy developments make the EU carbon market a central piece of Europeโ€™s climate strategy and an important bellwether for global carbon pricing efforts.

BMW Outpaces Mercedes 2.5x in EV Sales, Proving Electrification Is the Emissions Lever

BMW widened its lead over Mercedes-Benz in the global electric vehicle market in 2025, selling more than 2.5 times as many fully electric cars as its longtime German rival. The growing gap highlights not only BMWโ€™s strong execution but also the mounting pressure on Mercedes-Benz to reset its EV strategy amid weak demand and regional headwinds.

While both automakers faced a challenging macro environment, their electric vehicle performance moved in sharply different directions. BMW accelerated, especially in Europe. Mercedes, by contrast, lost momentum in key markets such as China and North America, forcing difficult product and portfolio decisions.

BMWโ€™s EV Strategy Delivers Scale and Stability

BMW ended 2025 with 442,072 fully electric vehicle deliveries, including more than 105,000 electric Minis, marking a 3.6% increase from the previous year. Over the same period, Mercedes delivered 168,800 battery-electric vehicles, a 9% year-on-year decline. The contrast underscored BMWโ€™s growing dominance in the premium EV segment.

More broadly, the BMW Group delivered 2.46 million vehicles across all powertrains in 2025, slightly higher than the previous year.

  • Electrified vehiclesโ€”including plug-in hybridsโ€”reached 642,087 units, up 8.3%, and accounted for 26% of total group sales. This balance between combustion engines, hybrids, and EVs continued to shield BMW from abrupt demand swings.

BMW executives described electrified models as the companyโ€™s strongest growth driver. Demand proved especially resilient in Europe, where supportive regulations, charging infrastructure, and consumer incentives remained relatively stable compared to other regions.

bmw EV sales
Source: BMW

Jochen Goller, member of the Board of Management of BMW AG, responsible for Customer, Brands, Sales, said,

โ€œIn 2025, in a challenging environment, the BMW Group sold more vehicles than in the previous year. Our electrified vehicles were in particularly high demand. Europe reported especially strong growth, with battery-electric vehicles accounting for about a quarter of total sales, and BEVs and PHEVs combined reaching a share of over 40% across the region. We remain fully on track to meet our EU COโ‚‚ fleet target for 2025.ย 

Europe Anchors BMWโ€™s Electric Momentum

Europe emerged as the backbone of BMWโ€™s electric success in 2025. Fully electric deliveries surged 28.2% across the region, with battery-electric vehicles representing roughly one-quarter of BMWโ€™s total European sales. When plug-in hybrids are included, electrified vehicles exceeded 40% of sales in several major markets.

This performance also helped BMW stay on track to meet its EU fleet COโ‚‚ targets, a growing priority as emissions rules tighten further later this decade. The companyโ€™s ability to scale EV sales without sacrificing profitability reinforced confidence in its multi-powertrain strategy.

Meanwhile, BMWโ€™s British subsidiary Mini reached a notable milestone. The brand delivered its 100,000th fully electric Mini, and more than one in three Minis sold in 2025 featured a battery-electric drivetrain. This success demonstrated that smaller, urban-focused EVs continue to resonate strongly with European buyers.

Warning Signs Emerge in the U.S. Market

Despite strong annual results, BMWโ€™s fourth-quarter performance revealed emerging challenges. Global EV deliveries fell 10.5% year over year in the final quarter, reflecting broader softness in consumer demand.

The United States stood out as a weak spot. BMWโ€™s BEV sales in the U.S. plunged 45.5% in Q4, falling to just 7,557 vehicles. For the full year, U.S. electric deliveries dropped 16.7%, underscoring the impact of high interest rates, uneven incentives, and lingering infrastructure concerns.

Even so, BMWโ€™s diversified geographic exposure helped offset U.S. weakness. Strong European demand and early interest in upcoming models provided confidence heading into 2026.

bmw
Source: BMW

Neue Klasse Signals BMWโ€™s Next Growth Phase

BMWโ€™s outlook received an additional boost from early demand for its upcoming Neue Klasse platform. The first modern model under this architecture, the electric iX3, generated strong initial orders across Europe.

In fact, customer reservations already cover nearly all of BMWโ€™s planned European production for the model in 2026. The Neue Klasse platform is central to BMWโ€™s long-term strategy, combining new battery technology, improved efficiency, and a software-first vehicle architecture.

By 2027, BMW expects to launch or update more than 40 models across various drive options, reinforcing its belief that flexibilityโ€”not a single-technology betโ€”offers the safest path through an uncertain transition.

In this context, Goller further noted,

โ€œEspecially in Europe, 2026 will be marked by the NEUE KLASSE. At the same time, we will be introducing several new models this year, such as the BMW X5, BMW 3 Series, and BMW 7 Series. In total, the BMW Group will launch more than 40 new and revised vehicles with various drive options by 2027.โ€ย 

Mercedes Faces Structural EV Headwinds

Mercedes-Benz entered 2025 under pressure, and conditions worsened as the year progressed. Global car sales fell 8% in the first nine months, with particularly sharp declines in China (-27%) and North America (-17%). Trade tensions and tariffs further complicated the picture.

The car maker delivered 168,800 BEVs, down 9%. Mercedes achieved higher total electrified sales, including plug-in hybrids (PHEVs), at 368,600 units, flat year-over-year.

Mercedes Benz EV
Source: Mercedes

In the United States, Mercedes paused orders for its EQS and EQE sedans and SUVs mid-year, citing unfavorable market conditions. As per reports, customer feedback highlighted design concerns and price sensitivity, particularly as competitors introduced newer platforms and faster charging capabilities.

As a result, Mercedes decided to phase out the EQE sedan and SUV by 2026, only four years after launch. The move marked a rare admission that parts of its first-generation EV strategy failed to connect with buyers.

Mercedes Bets on a Reset, Not a Retreat

Rather than scaling back electrification, Mercedes is attempting a reset. The company plans an aggressive product offensive, with 18 new or refreshed models in 2026 alone and 25 new models globally over three years.

However, Merc’s electric CLA boosted demand. It’s aย new 800-volt EV architecture, starting with the upcoming electric CLA and GLC. Mercedes claims the new CLA can add up to 325 kilometers of range in just 10 minutes, with charging speeds reaching 320 kW. The company hopes these improvements will directly address earlier criticisms around charging and efficiency.

CEO Ola Kรคllenius has described the coming period as the most intense launch cycle in Mercedesโ€™ history. Still, execution risks remain high, particularly as competition intensifies and EV demand growth moderates in some markets.

Sustainability Becomes a Competitive Divider

Beyond sales volumes, sustainability strategies increasingly shape long-term competitiveness. BMW continues to position electrification as the biggest lever for emissions reductions while maintaining optionality across technologies, including hydrogen and efficient combustion engines.

The company aims to cut COโ‚‚e emissions across its value chain by 90% by 2050, using 2019 as a baseline. Interim targets include a 40 million-ton reduction by 2030 and a 60 million-ton reductionby 2035. BMW has already mandated renewable energy use across its battery supply chain and sourcing contracts, including Tier-n suppliers.

Mercedes, meanwhile, is pursuing its โ€œAmbition 2039โ€ plan, targeting a net carbon-neutral new vehicle fleet across the full lifecycle. The company plans to reduce COโ‚‚ emissions per passenger car by up to 50% within the next decade, while increasing renewable energy use in production to 100% by 2039.

Mercedez benz climate

Both automakers recognize that as EV adoption rises, emissions reductions must increasingly come from manufacturing and supply chains, not just vehicle usage.

The Gap Widens, but the Race Continues

By the end of 2025, BMW had clearly established itself as the premium EV leader among Germanyโ€™s luxury brands. Its combination of steady electrification, regional balance, and early success with next-generation platforms set it apart.

Mercedes, however, is not conceding the race. Its upcoming models and platform overhaul could still narrow the gap, especially if global EV demand rebounds. For now, though, BMWโ€™s lead remains firmly intactโ€”and the pressure on Stuttgart continues to build.