The carbon dioxide removal (CDR) industry has raised a strong red flag. As per reports, a new open letter, signed by 55 buyers and stakeholders across the permanent carbon removals value chain, calls on the Science Based Targets initiative (SBTi) to revise key parts of its draft Corporate Net-Zero Standard Version 2.0. The signatories warn that if the current language remains unchanged, it could slow or even prevent companies from reaching true net-zero.
This joint action, led by the Nordic Carbon Removal Association, follows SBTi’s decision to open a second public consultation on November 6. The consultation runs until December 12. As a result, companies, experts, and climate groups now have a short window to shape the final version of the world’s most influential private-sector net-zero framework.
CDR Stakeholders Say Draft Rules Create Uncertainty
The CDR industry believes the draft standard sends the wrong signal. They warn that the current wording creates confusion about whether permanent carbon removals can count toward neutralizing residual emissions. Without clarity, companies may struggle to finish their net-zero journey.
The concern centers on two parts of the draft: the rules on double counting and corresponding adjustments, and the additionality language in Annex E.
According to the signatories, these sections ignore the realities of permanent removal projects. Many projects rely on public funding. Many also fall under national climate targets. If SBTi does not allow companies to use removals that also appear in national inventories, corporate investment could collapse.
This uncertainty makes it harder for companies to plan ahead. It also raises costs. In some cases, it could make net-zero impossible. Therefore, the signees urge SBTi to revise the language and give companies confidence that high-quality removals remain valid tools for neutralization.
The letter argues that SBTi’s draft does not accurately reflect the challenges of scaling permanent removals. Today, only a few projects have reached the Final Investment Decision (FID) stage. Most needed is heavy government support. Private buyers often commit early to help these projects advance. However, these buyers will hesitate if SBTi casts doubt on future eligibility.
Climate scientists, including Johan Rockström, have stressed that the world must scale permanent CDR rapidly to stay on track for 1.5°C. Yet this scale-up depends on strong public-private partnerships. These partnerships often use co-funding models and a dual-ledger system that allows both companies and nations to count climate outcomes. This model already works for emission reductions. The CDR community argues it must also apply to removals.
Some critics worry that corporate involvement might weaken national ambition. The open letter rejects this concern for permanent removals. These removals are expensive and complex. When companies invest, they actually raise ambition.
Their involvement brings more projects, more learning, and more durable tonnes. It also frees governments to direct public funds to other climate needs. Therefore, the CDR sector believes co-funding strengthens, not weakens, climate action.
SBTi Tries to Improve Clarity—But Falls Short on Removals
SBTi designed the updated draft to improve clarity and credibility. It asks companies to link near-term actions to long-term climate goals. It also expects companies to publish transition plans and maintain separate targets for Scope 1 and Scope 2 emissions. Moreover, SBTi aims to give companies more flexibility by recognizing that sectors and regions face different challenges. The draft introduces a recognition mechanism for early action on ongoing emissions. It also sets stronger expectations for transparency.
However, the CDR community argues that these improvements lose impact if the draft restricts permanent removals. Companies need clear rules. They also need confidence that investments in high-durability removals will help them meet net-zero targets. If SBTi creates barriers, companies may fall short even after making major decarbonization efforts.
Additionally, the open letter urges SBTi to acknowledge the importance of dual-ledger accounting. Allowing both nations and companies to count the same climate outcomes would boost demand and support faster growth. It would also create a stable market signal for investors. Without this flexibility, the permanent CDR sector could stall just as it begins to scale.
David Kennedy, Chief Executive Officer at the Science Based Targets initiative, said:
“Businesses are driving global decarbonization, and will be key to achieving our climate objectives. Taking science-based action both reduces emissions and manages transition risks, maintaining competitiveness and offering growth opportunities in a carbon-constrained world. By contributing to our public consultation stakeholders can help shape the future of corporate climate action and ensure the Standard helps companies to turn ambition into action, and action into impact.”
What Comes Next for the Net-Zero Framework
The next steps will shape how thousands of companies plan their climate pathways. SBTi’s final standard will influence how businesses cut emissions, choose climate tools, and invest in removals. If SBTi responds to the concerns raised, the permanent removals industry could grow faster. Companies would also gain more confidence in the tools they need to balance unavoidable emissions.
But if SBTi keeps the restrictive language, many firms may face shrinking options for meeting net-zero. This could slow climate progress at a critical time.
Both sides agree on a key reality: emissions reductions alone are not enough. Permanent carbon removals must play a role. The question now is how to build a standard that protects scientific credibility while still supporting the growth of essential climate technologies.
Disseminated on behalf of Surge Battery Metals Inc.
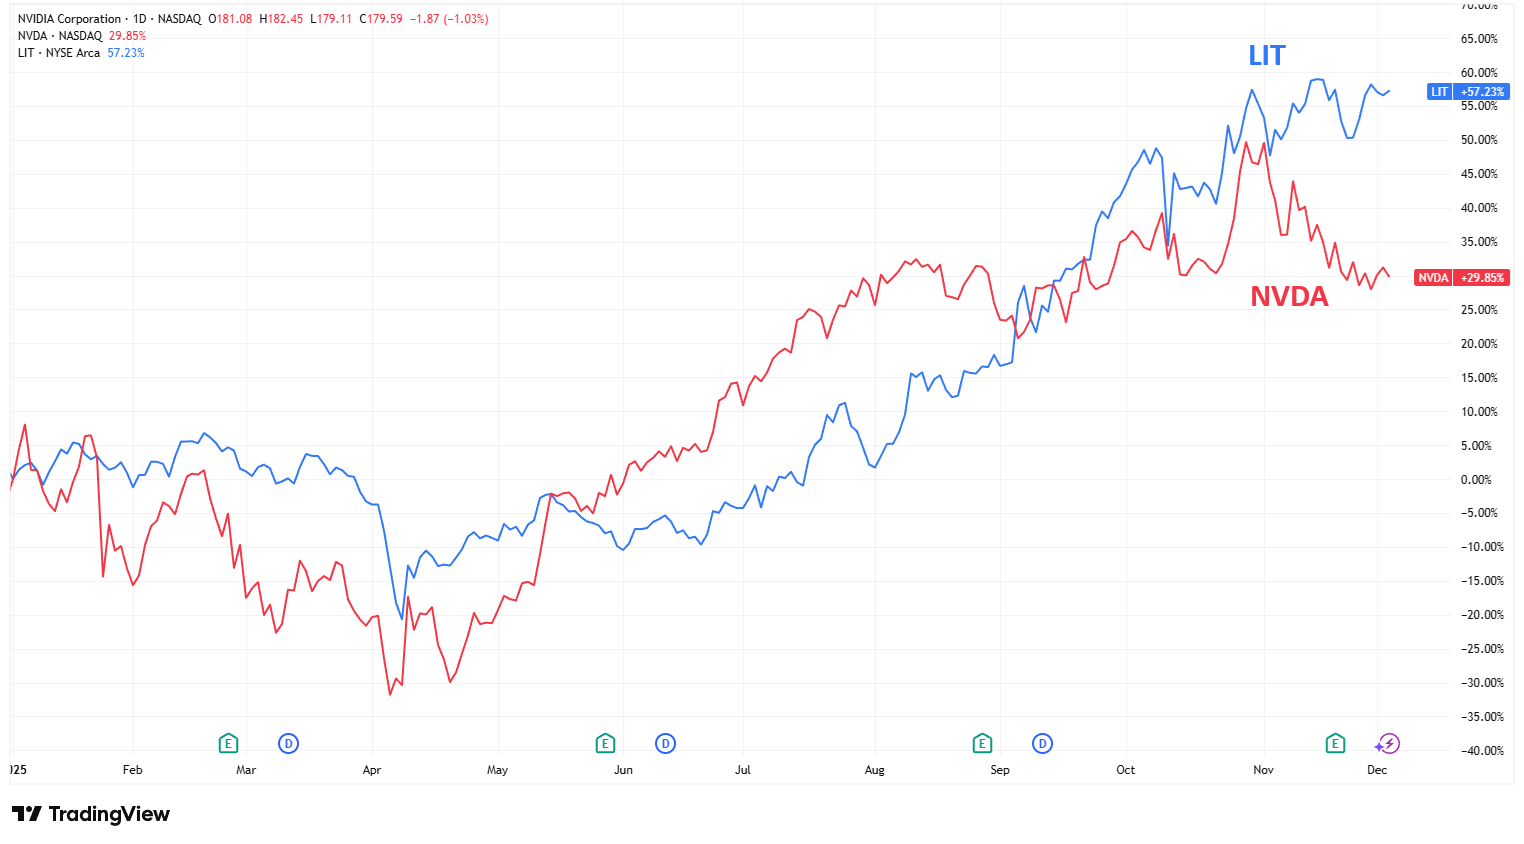
In an unprecedented turn for 2025, the Global X Lithium Battery Tech ETF (LIT) has surged ahead as a standout performer, eclipsing even traditional tech giants like NVIDIA. With lithium increasingly seen as a foundational material driving the clean energy transition, LIT’s year-to-date returns have soared, outpacing NVIDIA and spotlighting the essential role of lithium in global decarbonization efforts. Lithium’s real-world impact is reshaping transportation and energy infrastructure, establishing it as the backbone of electric vehicles (EVs), renewable energy storage, and advanced battery technologies.
Investor priorities are changing. Policy makers, corporate leaders, and major funds are focusing on domestic lithium production, battery innovation, and secure critical mineral supply chains in response to skyrocketing global demand. Electric vehicle adoption and grid-scale energy storage set new records, pushing the lithium value chain into the spotlight and attracting increasing capital from those eyeing long-term sustainability and tech-driven value.
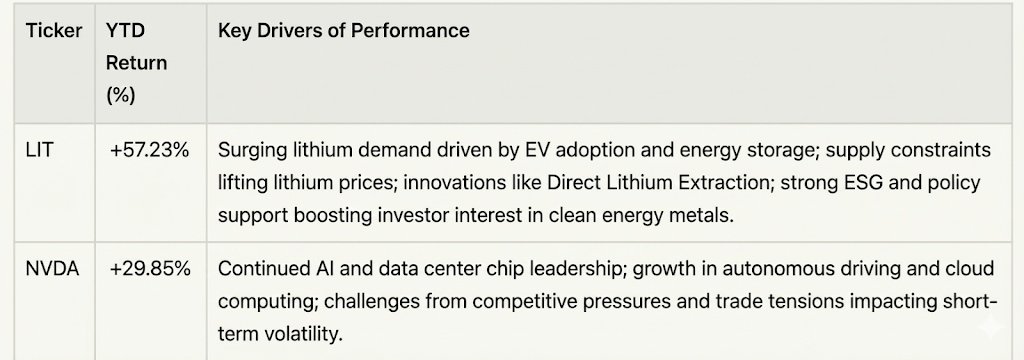
As of December 03, 2025, the Global X Lithium & Battery Tech ETF (LIT) traded near $63, showing +57.23% growth in lithium and battery supply chain sectors since the start of 2025. Nvidia (NVDA) stock traded at around $180, up about 30% year-to-date. This gap reflects rising confidence in lithium as a key material for our energy shift. Unlike tech stocks that focus on digital trends, lithium drives real changes in transport and energy. Investors see lithium as vital for a low-carbon economy.
Performance Comparison: LIT ETF Vs NVDA Stock vs LIT ETF
LIT covers a wide part of the lithium value chain. It includes major miners like Ganfeng Lithium Group, Albemarle, and Lithium America, battery makers like Tesla, CATL, etc., and firms focused on advanced energy storage. Even though lithium demand has soared, lithium ETFs skyrocketed after the White House revealed plans to take a stake in Lithium Americas.
However, the gap between LIT and NVIDIA shows a growing awareness of lithium’s role in clean energy. NVIDIA symbolizes digital progress, while LIT reflects the energy shift driving electrification and clean tech.
Next, we’ll explore LIT’s growth drivers, trends in lithium supply and demand, and investor interest in lithium stocks.
LIT ETF’s Unique Exposure
Global X Lithium & Battery Tech ETF (LIT) tracks the entire lithium value chain. It includes companies in mining, refining, chemical processing, battery cell production, and advanced battery technology. This ETF provides diversified exposure to a fast-growing market, unlike investing in a single company. This variety allows LIT to benefit from both raw material demand and battery innovation, positioning it well for long-term growth.
The fund’s structure offers stability. Individual stocks can be volatile due to earnings reports or regulations. By investing across the supply chain, LIT reduces risk and taps into the electrification trend. This mix of breadth and depth has helped LIT outperform traditional tech leaders in 2025.
A Boom in Lithium Demand
The main driver of LIT’s success is rising lithium demand. Lithium powers lithium-ion batteries found in everything from EVs to home energy systems and grid storage.
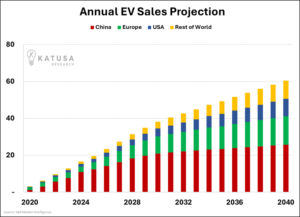
IEA says that global EV sales in 2025 are set to reach around 20 million units, breaking records. Thus, the EV boom is reshaping the lithium market, with electric cars now making up nearly 90% of lithium use worldwide.
Source: Katusa Research
This demand surge isn’t just from more vehicles. Battery packs are growing larger for longer ranges and faster charging. Each new EV requires more lithium than older models. Additionally, the rapid growth of stationary energy storage boosts lithium use further.
Grid-scale battery installations exceeded 90 gigawatt-hours (GWh) in 2024, with annual growth rates above 30% expected in the coming years. These batteries store energy from renewable sources and release it during peak demand, making lithium crucial for a renewable future.
The combination of EV adoption and grid storage creates a strong, multi-layered growth story for lithium. Investors increasingly view lithium as a key part of global clean energy infrastructure.
Lithium Supply Dynamics and Technological Innovation
While demand is rising, lithium supply struggles to keep pace. Mining and refining require significant capital, long permits, and strict environmental compliance. Many major lithium deposits are concentrated in specific areas, adding geopolitical risks.
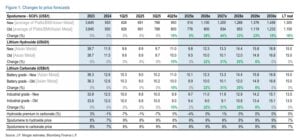
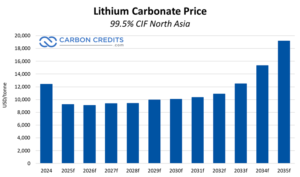
These supply constraints have kept lithium prices high, with battery-grade lithium carbonate expected to be around $9,250 in 2025.
Emerging technologies are reshaping the supply landscape. Direct Lithium Extraction (DLE) is gaining attention for its efficiency and sustainability. DLE extracts lithium from brine or geothermal sources using less water and causing less land disturbance. Companies using DLE can produce a higher-purity product faster than with traditional methods. For ESG-focused investors, DLE represents a greener way to boost production.
Companies in LIT’s portfolio are adopting these technologies and securing strategic supplies. Lithium Americas, a major holding, recently acquired a 59% stake in the Thacker Pass lithium project in the U.S. through a government initiative. This highlights the importance of domestic lithium sources amid global supply uncertainties.
Investor enthusiasm for lithium stocks and ETFs has surged with global clean energy efforts. Governments are promoting domestic lithium production, supporting EV adoption, and funding battery manufacturing. The U.S., European Union, and China have ambitious plans to secure critical battery materials.
Analysts at Albemarle and other top lithium producers predict that global lithium demand could more than double by 2030, reaching up to 3.7 million tonnes of lithium carbonate equivalent (LCE).
Source: Katusa Research
This long-term outlook attracts both retail and institutional investors wanting to join the clean energy transition. LIT offers a liquid, diversified way to tap into this growth without relying on a single company.
The rising focus on lithium aligns with broader trends in sustainable investing. Markets favor assets linked to real decarbonization strategies and infrastructure projects. Lithium, as a backbone for EVs and energy storage, fits this narrative well.
Comparing LIT and NVIDIA (NVDA Stock) Performance in 2025
NVDA stock remains a standout performer, driven by its leadership in AI chips, data centers, and autonomous vehicle tech. Analysts see growth potential and have set high price targets for 2025. However, NVIDIA faces challenges like competition from new chipmakers and pricing pressures. While the stock is strong, its growth depends on digital and AI trends rather than energy transformation.
LIT, in contrast, thrives on real shifts in energy and transport systems. While NVIDIA represents the digital revolution, LIT embodies the energy revolution. Lithium’s key role in EVs and storage gives the ETF unique exposure to a megatrend likely to continue. This explains why LIT has outperformed major tech leaders in 2025.
Risks and Challenges
Investing in lithium comes with risks, even with strong prospects. Supply chain delays, regulatory issues, and changes in battery technology can affect demand. These factors may reduce lithium’s role in batteries. Companies in LIT require continuous capital investment to grow, which can impact profits. Price swings in lithium markets can also threaten stability for cautious investors.
Still, strong growth in EV adoption and energy storage, along with supportive policies and tech advances, provides a solid foundation for continued lithium demand.
Lithium as a Strategic Investment Theme
LIT ETF’s 2025 jump shows a broader investment shift. Lithium has evolved from a niche material to a vital part of the clean energy economy. In 2025, LIT is expected to outperform top tech stocks, making it a strong investment opportunity today.
Apart from ETFs, another way to gain exposure to the lithium theme is through Surge Battery Metals (TSXV: NILI | OTCQX: NILIF). The company’s flagship asset, the Nevada North Lithium Project (NNLP) in Elko County, Nevada, hosts the highest-grade lithium clay resource currently reported in the United States.
Source: Surge Battery Metals
According to its latest resource estimates, NNLP holds an Inferred Resource of 11.24 million tonnes of lithium carbonate equivalent (LCE) grading 3,010 ppm Li at a 1,250 ppm Li cut-off, according to its latest mineral resource estimate.
This high-grade claystone deposit positions NNLP as a potential future source of domestic lithium for electric vehicles and energy storage, as the Company now advances the project toward Pre-Feasibility, including ongoing economic studies, technical work, and permitting.
This grade makes NNLP the highest-grade lithium clay resource currently reported in the United States.
New Era Publishing Inc. and/or CarbonCredits.com (“We” or “Us”) are not securities dealers or brokers, investment advisers, or financial advisers, and you should not rely on the information herein as investment advice. Surge Battery Metals Inc. (“Company”) made a one-time payment of $50,000 to provide marketing services for a term of two months. None of the owners, members, directors, or employees of New Era Publishing Inc. and/or CarbonCredits.com currently hold, or have any beneficial ownership in, any shares, stocks, or options of the companies mentioned.
This article is informational only and is solely for use by prospective investors in determining whether to seek additional information. It does not constitute an offer to sell or a solicitation of an offer to buy any securities. Examples that we provide of share price increases pertaining to a particular issuer from one referenced date to another represent arbitrarily chosen time periods and are no indication whatsoever of future stock prices for that issuer and are of no predictive value.
Our stock profiles are intended to highlight certain companies for your further investigation; they are not stock recommendations or an offer or sale of the referenced securities. The securities issued by the companies we profile should be considered high-risk; if you do invest despite these warnings, you may lose your entire investment. Please do your own research before investing, including reviewing the companies’ SEDAR+ and SEC filings, press releases, and risk disclosures.
It is our policy that information contained in this profile was provided by the company, extracted from SEDAR+ and SEC filings, company websites, and other publicly available sources. We believe the sources and information are accurate and reliable but we cannot guarantee them.
CAUTIONARY STATEMENT AND FORWARD-LOOKING INFORMATION
Certain statements contained in this news release may constitute “forward-looking information” within the meaning of applicable securities laws. Forward-looking information generally can be identified by words such as “anticipate,” “expect,” “estimate,” “forecast,” “plan,” and similar expressions suggesting future outcomes or events. Forward-looking information is based on current expectations of management; however, it is subject to known and unknown risks, uncertainties, and other factors that may cause actual results to differ materially from those anticipated.
These factors include, without limitation, statements relating to the Company’s exploration and development plans, the potential of its mineral projects, financing activities, regulatory approvals, market conditions, and future objectives. Forward-looking information involves numerous risks and uncertainties and actual results might differ materially from results suggested in any forward-looking information. These risks and uncertainties include, among other things, market volatility, the state of financial markets for the Company’s securities, fluctuations in commodity prices, operational challenges, and changes in business plans.
Forward-looking information is based on several key expectations and assumptions, including, without limitation, that the Company will continue with its stated business objectives and will be able to raise additional capital as required. Although management of the Company has attempted to identify important factors that could cause actual results to differ materially, there may be other factors that cause results not to be as anticipated, estimated, or intended.
There can be no assurance that such forward-looking information will prove to be accurate, as actual results and future events could differ materially. Accordingly, readers should not place undue reliance on forward-looking information. Additional information about risks and uncertainties is contained in the Company’s management’s discussion and analysis and annual information form for the year ended December 31, 2024, copies of which are available on SEDAR+ at www.sedarplus.ca.
The forward-looking information contained herein is expressly qualified in its entirety by this cautionary statement. Forward-looking information reflects management’s current beliefs and is based on information currently available to the Company. The forward-looking information is made as of the date of this news release, and the Company assumes no obligation to update or revise such information to reflect new events or circumstances except as may be required by applicable law.
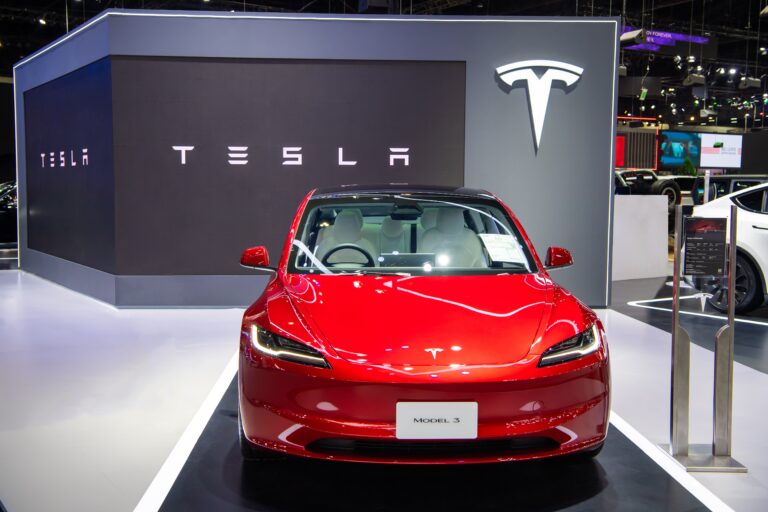
Tesla, long seen as the flagship of electric vehicles (EVs), is now facing two related challenges at once. On one side is the weakening of sales in the U.S. market. On the other is the rising concern that regulatory changes abroad could affect EV demand. These pressures could challenge Tesla’s resilience and strategy. They show that even industry leaders face changing market forces and policy uncertainties.
U.S. Sales Hit a New Low — But Q3 Shows Strength
Tesla’s U.S. deliveries fell to 39,800 vehicles in November 2025, marking the lowest monthly total for the company so far this year. This slump follows a high point in August 2025, when Tesla sold about 55,500 vehicles in a single month.
Over the first eight months of 2025, sales totaled 337,079 vehicles, roughly 24% fewer than in the same period in 2024. This drop signals that consumer demand is softening, despite earlier rebounds.
However, looking at Tesla’s global figures provides a more complete picture. In Q3 2025, the company delivered 497,099 vehicles worldwide, a 7.4% increase compared with the same quarter in 2024. This growth was partly driven by U.S. tax credit expirations that encouraged buyers to act before incentives ended.
Tesla earned over $28 billion in global revenue in Q3. This is a 12% increase from last year. It shows that the company is financially strong, even with changes in regional sales.
Despite these positive global trends, U.S. inventory levels are a concern. As of early December 2025, about 10,799 Tesla vehicles were waiting to be sold. While this is higher than the low points earlier in the year, it signals a potential oversupply risk.
If demand does not pick up, Tesla may need to adjust production or introduce new incentives to prevent inventory from piling up.
Competition is also intensifying. U.S. EV market share remains around 10%, but Tesla is facing stronger challenges from Ford and GM hybrids. These competitors have been steadily increasing their presence in the EV and hybrid segments. This could limit Tesla’s growth in its biggest market.
The U.S. case shows that even a leading EV manufacturer must constantly adapt to market dynamics and competitor strategies.
Tesla’s challenges are not confined to the U.S. In Europe, the situation is uneven, with regulatory uncertainty adding pressure.
Tesla’s European sales continued to struggle in November 2025. Vehicle registrations dropped 58% in France to 1,593 units and 49% in Denmark to 534 units compared to the same month a year earlier.
In Denmark, the Model Y fell 74% to 206 units, while the Model 3 rose 29% to 326 units, making it the country’s eighth best-selling vehicle. These figures reflect growing competition in Europe and a challenging market environment for Tesla.
In the United Kingdom, Tesla has warned policymakers about potential changes to the Zero Emission Vehicle (ZEV) mandate, as reported by The Guardian.
The proposal under review aims for 28% EV sales by 2027, but it is facing delays due to industry pushback. Tesla says that weakening these rules might slow EV adoption. It could make battery-electric vehicles less appealing and hurt climate goals. The company stated that changes will:
“suppress battery electric vehicle (BEV) supply, carry a significant emissions impact and risk the UK missing its carbon budgets.”
Germany reveals a similar trend. Tesla’s sales in Germany have declined sharply. Year-to-date sales in 2025 totaled only 17,358 vehicles. That’s nearly half of what the company sold in the same period last year. November 2025 alone saw a 20.2% drop compared with November 2024.
Meanwhile, the broader German EV market has grown steadily, and competitors such as BYD have gained market share. BYD’s cheaper models are grabbing consumer attention. This shows that Tesla faces not just regulatory issues but also growing competition in Europe.
This gap between markets highlights an important point for Tesla. Regulatory signals and local market conditions now greatly influence performance.
Europe used to be a strong growth area for Tesla, but now demand is slowing. Competitors are taking advantage of changes in pricing and policy. Tesla must adapt its strategy to address these regional differences while maintaining global competitiveness.
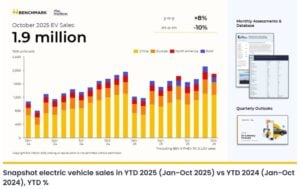
Still, the chart below shows that the Tesla Model Y is the top-selling EV in the region from January to October 2025.
China remains a strong market for the EV maker, showing resilience despite weaknesses in other regions. In November 2025, Tesla’s China-made EV sales rose 10% year-over-year to 86,700 units. This growth contrasts with BYD, whose new energy vehicle (NEV) sales fell 5.3% to 480,186 units.
Tesla’s strong performance in China comes from high demand for cars made at its Shanghai factory. The launch of new model variants has also helped.
Global EV trends also highlight China’s dominant position. More than half of all new cars sold in China are now electric. In contrast, the U.S. lags at 10%, and Europe is showing signs of cooling.
This imbalance emphasizes the importance of China in Tesla’s growth strategy. Success in the Chinese market is critical not only for revenue but also for sustaining global market momentum.
Strategic Moves: Energy Storage and Diversification
Tesla is taking steps to mitigate these pressures. One important area is energy storage. In Q3 2025, Tesla deployed 12.5 GWh of storage capacity, including both commercial and home battery systems. These products provide a buffer against volatility in auto sales, allowing Tesla to diversify revenue sources and strengthen its long-term resilience.
Notably, investors recently sent Tesla’s stock up after reports that the U.S. government may soon push a major expansion of the robotics industry. Shares rose about 1%. This was due to growing hope that support for robotics and automation could help Tesla beyond just car sales.
This matters because the company is positioning itself as more than a carmaker. It’s also a tech-driven firm focused on robotics, artificial intelligence, and autonomous driving systems. The stock rise shows that investors are hopeful. They believe investments in robots, software, and self-driving services can help Tesla offset weak demand for traditional cars.
Tesla’s challenges are part of a larger story for the EV market. Weak sales in major regions could slow the transition to low-emission transport. Regulatory rollbacks, like the UK’s possible easing of the ZEV mandate, could lead automakers to keep selling petrol and diesel cars.
Investors may become more cautious, reducing support for EV infrastructure, production, and innovation if market signals remain unpredictable. Policymakers, automakers, and consumers must remain aligned to sustain momentum in electrification. Without steady incentives, clear rules, and ongoing consumer adoption, the move to EVs might slow down. This can happen even if the technology and business case are solid.
Navigating an Uncertain Road Ahead
The EV giant is facing a crossroads. U.S. sales are slowing, Europe is showing uneven performance, and regulatory uncertainty could affect future adoption.
Whether Tesla recovers — or whether the EV transition slows — depends less on product features or brand name and more on broader economic conditions, government policy, and consumer confidence. The company’s ability to adapt its strategy, balance production, and diversify revenue streams will be critical in the coming months.
For the company and the EV industry as a whole, this is a defining moment: how Tesla responds could shape the future of electric mobility globally.
China strengthened its dominance in the global electric vehicle battery landscape in 2025. Fresh data from SNE Research showed that six major Chinese battery manufacturers controlled 68.9% of all EV battery installations worldwide from January to October 2025. Their combined installed capacity hit 644.4 GWh during the period, almost three percentage points higher than last year. This rise confirmed China’s firm leadership in a market that continues to grow quickly despite uneven EV sales trends across regions.
During the same period, worldwide EV battery installations reached 933.5 GWh, marking a 35.2% year-over-year increase compared to 690.7 GWh in 2024. The surge was driven by stronger adoption of battery-powered vehicles across categories, including pure EVs, plug-in hybrids, and hybrid models. Even with policy uncertainty in Europe and inflationary pressure in the U.S., global demand for high-quality battery packs remained strong.
Source: SNE Research
CATL Extends Its Lead While BYD Accelerates Overseas
CATL maintained its dominant position and continued to widen the gap with its competitors. Between January and October, CATL installed 355.2 GWh of batteries, claiming 38.1% of the global market. This share was slightly higher than its 37.6% share a year ago. The company posted a 36.6% annual increase in installed capacity, supported by broad adoption across both domestic and international automakers.
The battery giant powered Chinese brands like Zeekr, AITO, Li Auto, and Xiaomi, while also serving global giants such as Tesla, BMW, Mercedes-Benz, and Volkswagen. This combination gave CATL unmatched scale and brand presence across segments.
Meanwhile, BYD ranked second with 157.9 GWh installed and a 16.9% market share. Its performance reflected both strong Chinese sales and a sharp rise in overseas momentum.
In November alone, BYD sold more than 130,000 vehicles outside China, nearly four times higher than the previous year. This rapid expansion helped push BYD’s battery usage in Europe to 11.2 GWh in the January–October period, a remarkable 216% year-over-year increase.
Its batteries power both its pure electric and plug-in hybrid models, and its vertical integration keeps production costs low and efficiency high.
Other Chinese players also solidified their positions in the top tier:
CALB: 44.3 GWh (4.7%)
Gotion High-Tech: 38.7 GWh (4.1%)
EVE Energy: 24.6 GWh (2.6%)
SVOLT: 23.7 GWh (2.5%)
Collectively, China’s six leading battery suppliers now shape global supply, technology standards, and pricing power, creating challenges for competitors in Korea, Japan, and Europe.
While Chinese companies gained momentum, South Korean and Japanese suppliers faced growing pressure. Their combined market share fell as Chinese manufacturers expanded scale, lowered costs, and strengthened ties with global automakers.
Source: SNE Research
LG Energy Solution Holds On but Faces Tesla Slowdown
LG Energy Solution stayed in third place globally with 86.5 GWh and a 9.3% market share. Its installed battery volume grew 12.8% from last year, but market share fell from 11.1%. The main reason was slower Tesla sales for models using LG batteries. Tesla’s move toward LFP batteries and using multiple suppliers cut LG’s Tesla-related battery usage by 14.5%.
However, it still gained from strong global sales of Kia’s EV3 and steady demand for GM’s Ultium-based models like the Chevrolet Equinox, Blazer, and Silverado EV in North America. These helped, but not enough to fully protect LG’s global share.
SK On Sees Mixed Results
SK On installed 37.7 GWh, capturing 4% of the global market. Its batteries power Hyundai models like the Ioniq 5 and EV6, and Volkswagen’s ID.4 and ID.7. Sales of Ford’s F-150 Lightning were slower, but demand for the Explorer EV helped SK On. Overall, Ford-related battery usage rose 18.1%.
Samsung SDI Faces Rivian Shift
Samsung SDI posted 25.1 GWh and a 2.7% market share, down from last year. Rivian switched some models to Gotion’s LFP batteries, reducing SDI’s share. Rivian’s overall slowdown also hurt. Positive sales from BMW and Audi helped offset some losses. Models like the BMW i4, i5, i7, and iX, along with Audi’s Q6 e-Tron, kept European demand steady.
Together, LGES, SK On, and Samsung SDI held 16% of the global market, down 3.5 percentage points from last year.
Panasonic Works to Diversify
Panasonic ranked seventh with 35.9 GWh and a 3.8% market share. The company focused on reducing reliance on Tesla and growing in North America. Efficiency upgrades at its Kansas and Nevada factories, along with work on next-generation 4680 and 2170 cells, helped stabilize costs. Panasonic also expanded talks with North American automakers to diversify its customers.
Regional Strategy Becomes the New Competitive Driver
By late 2025, growth remained strong, but the global competitive landscape grew more complicated. Each major region pursued a different policy direction, forcing battery makers to adjust both technology and supply chain strategies.
North America: Automakers increasingly secured long-term procurement deals to manage battery costs and reduce supply risks. Local production and the U.S. Inflation Reduction Act (IRA) compliance drove rapid investment in domestic supply chains.
Europe: European automakers accelerated efforts to reduce their reliance on imported Asian batteries. As a result, local pack assembly, localized mineral sourcing, and near-shoring became top priorities to comply with EU rules and reduce geopolitical exposure.
Asia: Asian suppliers focused on product differentiation through high-energy-density chemistries, fast-charging cells, long-life platforms, and intelligent battery-management systems. They also expanded partnerships with global OEMs to extend their market reach.
EV Boom Helps Flatten China’s Carbon Emissions
The global EV battery industry is shifting from simply scaling up production to focusing on regional strategies and flexible supply chains. Companies that quickly adapt to new policies, create market-specific products, and strengthen local supply chains are gaining a clear edge.
This shift is playing a significant role in reducing China’s emissions and advancing a cleaner energy future. According to a recent CarbonBrief report, China’s carbon dioxide (CO2) emissions have stabilized over the past 18 months, from March 2024 through the third quarter of 2025.
This marks a notable change for the world’s largest emitter, as strong growth in renewable energy and EVs begins to offset emissions from heavy industry.
The report also highlighted that transport fuel emissions fell by 5% year-on-year in the third quarter of 2025, as more drivers switched from gasoline and diesel vehicles to EVs.
All in all, China enters this next phase with overwhelming scale and strong global partnerships. Still, rising regionalization means that long-term leadership will depend on the ability to operate diverse portfolios—not just on dominating global market share.
In late 2025, the market for carbon credits based on biochar, a carbon removal method, is showing stable prices. However, behind the calm surface, many players say sentiment is weakening, which comes from fewer retirements, lower demand, and a tight supply.
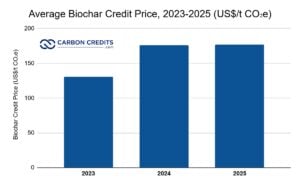
A recent report by S&P Global found that in October 2025, U.S. biochar credits for delivery in 2025 stayed at around $150 per tonne of CO₂e. Credits for next year’s delivery were about $148 per tonne. This is slightly lower due to less buying activity and hopes for more supply.
Still, the drop in retirements signals weaker demand. Tech-based carbon removal retirements slipped to just 3,327 metric tons (mt) in October, down sharply from 57,417 mt in September. So, while prices held steady for now, the weak market mood raises questions about how the biochar credit market may perform in the coming months.
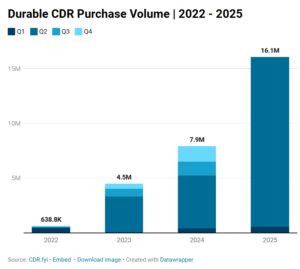
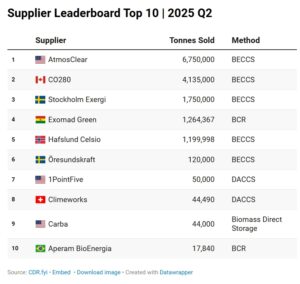
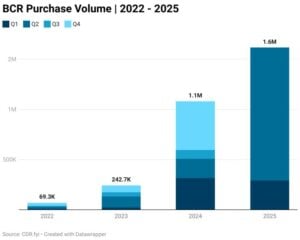
However, reports from the largest open data platform on the durable CDR market, CDR.fyi paint a different picture of annual biochar contracted volume, purchases, delivered, and retired.
Turning Waste Into Value: How Biochar Works
Biochar comes from heating organic waste, such as agricultural leftovers. This happens in a low-oxygen process known as pyrolysis. Doing this locks in carbon and converts plant waste into a stable, carbon-rich material. That carbon can be stored for decades or centuries.
Biochar removes carbon instead of just avoiding emissions. So, its credits fall under the “carbon dioxide removal (CDR)” category. Over the last few years, buyers in the voluntary carbon market have shown growing interest in CDR credits.
Some traditional “emissions-avoidance” credits are criticized. They often lack permanence and strong verification.
Biochar has a co-benefit: it can boost soil health, water retention, and agricultural yields when added to soil. However, these benefits come after its main role in carbon removal.
Biochar is appealing because it’s relatively affordable compared to pricier carbon removal methods, like direct air capture. It also offers two benefits: removing carbon and improving soil health.
Supply Chains and Demand: The Fragile Balance
Recent data by CDR.fyi points to a mixed and fragile state for the biochar carbon credit market. The key findings include:
A 2025 market snapshot from CDR.fyi shows that from 2022 to mid-2025, around 3.04 million tonnes (Mt) of biochar carbon removal (BCR) credits were contracted. Roughly 1.6 Mt of that was purchased in the first half of 2025 alone.
Deliveries and retirements of BCR credits have also increased. By the end of Q2 2025, around 302,000 tonnes had been retired. That’s about double the amount from previous years.
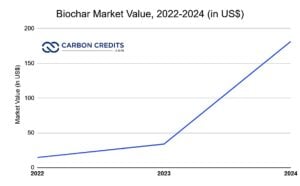
The biochar market also saw strong yearly growth, especially from 2023 to 2024, with a 435% increase.
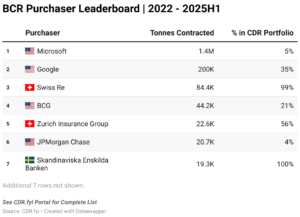
Despite this, the number of active buyers remains low. A few big companies, like Microsoft, Google, and JPMorgan Chase, make most of the purchases.
On the supply side, biochar credits remain constrained. Many projects face delays in certification or in building out production capacity. Recent data shows that some biochar projects are still validating or just issuing their first credits. This limits the credits available for immediate delivery or sale.
High demand from big buyers, limited supply, and delays in new projects explain why prices remain strong. Yet, it also exposes the fragility of the market: if even a few big buyers step back, or if supply improves markedly, prices could shift.
Notes: 2024 price is from market estimates, while 2023 and 2025 figures are from Sylvera
Faced with weak sentiment and supply constraints, many biochar developers are rethinking their strategies. Some are trying to expand the market beyond a few large corporations.
A broker in the S&P Global report said there’s a rising push to reach “smaller buyers.” This includes small companies and possibly individuals. This could help broaden demand, reduce concentration risk, and create a more stable base for biochar credits.
Meanwhile, developers are seeking diversified revenue streams. Many are now focusing on the actual biochar product instead of just selling carbon credits. They sell it as soil amendments, bio-fertilizers, and for other uses. This strategy can boost the “bankability” of projects. This makes them more appealing to investors. It also cuts down on reliance on the unstable credit market.
Long-term purchase agreements (offtake deals) are also becoming more common. For buyers seeking certainty, signing multi-year contracts with biochar producers ensures a steady supply.
It may also provide price advantages compared to unpredictable spot markets. That can be a win–win: producers get steady funding, buyers get a reliable supply.
These measures only partly tackle the bigger problem. The supply is still small and fragmented compared to the high demand from companies wanting to offset emissions on a large scale.
What Forecasts Say: Growth is possible, but big challenges remain
Industry analysts are cautiously optimistic about the long-term prospects of biochar carbon credits. Stratistics MRC predicts that the global biochar carbon credit market may rise from about $304.1 million in 2025 to nearly $1,847.3 million by 2032. That implies a compound annual growth rate of about 29.4%.
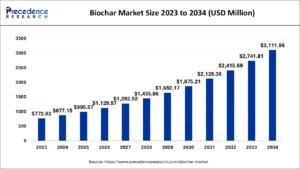
In another estimate, the biochar market can reach over $3 billion by 2034. That’s a more conservative projection, at a 13.5% annual growth rate.
Other forecasts, such as MSCI Carbon Markets, say demand for biochar credits might rise a lot in the next decade. This rise is fueled by corporate net-zero goals and a greater focus on lasting carbon removal.
Still, several major hurdles stand in the way of scalable growth, such as:
Supply chain bottlenecks: Many biochar projects remain small or underfunded; building larger plants requires capital and time. Delays in certification, pyrolysis equipment supply, and feedstock sourcing continue to slow expansion.
Market concentration: A small number of buyers still dominate demand. This means that changes in their demand — or shifts in corporate climate strategies — could strongly affect the whole market.
Competition and price pressure: If supply grows faster than demand in the medium term, credit prices might come under pressure. Some models even anticipate short-term price compression before a rebound.
Policy and integration challenges: Many analysts believe that biochar needs more than just voluntary credits to grow. It may need integration into compliance markets, support from government policies, or large public funding.
Implications for Buyers, Producers, and the Climate
For buyers, whether big firms or small businesses, biochar credits are a great way to offset emissions. They are durable and often more credible than traditional offsets. Plus, they can improve soil health and offer other benefits. But buyers should be aware: the current supply-demand mismatch and limited buyer base introduce risk.
For producers, biochar remains a difficult but possibly rewarding business. Diversified income streams and long-term agreements may help stabilize revenue.
For the climate, biochar represents one of the more promising carbon removal tools available today. If done carefully and combined with larger climate actions, it could help remove and store a lot of CO₂.
A Fragile but Promising Path Forward
The biochar carbon credit market in late 2025 is at a delicate balance. Prices remain steady, thanks largely to tight supply and committed offtake deals. But weaker retirements and shrinking buyer activity hint at deeper structural challenges.
Still, signs of adaptation show promise for biochar. New buyers are emerging, business models are diversifying, and long-term contracts are forming. These changes suggest many believe biochar can grow beyond a niche solution. If the industry can fix supply bottlenecks and broaden demand beyond a few big companies, biochar could be a strong part of global carbon removal.
Hyundai Motor Group is taking a major step in electric mobility. The company is building a large new research and development hub in Anseong, South Korea. Called the Future Mobility Battery Campus, the center will focus on advanced battery design, real-world testing, and smarter energy services that link EVs with homes and power grids.
The auto giant recently revealed in its press release that it is investing KRW 1.2 trillion, and the campus will be complete by the end of 2026. It will help Hyundai, Kia, and Genesis develop safer, more efficient, and higher-performing batteries.
A Major Investment in Next-Generation Battery Technology
Hyundai recently celebrated the topping-out ceremony of the Future Mobility Battery Campus. The building sits inside Anseong’s Fifth General Industrial Complex and covers a large area of 197,000 square meters, with a total floor space of 111,000 square meters. Construction has been steady since it began in January 2025.
Here’s a snapshot of the facility
Source: Hyundai
Battery technology drives EV performance. Range, safety, charging speed, and durability all depend on battery design and construction. Hyundai wants greater control over these technologies instead of relying solely on suppliers.
Moreover, consolidating operations under one roof lets Hyundai move faster. It also reduces risks and ensures new battery technologies are safe and reliable before reaching customers.
How the Campus Strengthens Research and Development
Before this new site, Hyundai’s battery development mostly happened at its Namyang and Uiwang R&D centers. These facilities focus on battery materials, cell design, and early-stage process development. However, they mainly perform small-scale validation.
The new Future Mobility Battery Campus goes much further. It introduces continuous process validation, which means Hyundai can test batteries again and again under conditions that mimic real manufacturing and real-world use.
This approach helps in several ways, for example:
improves quality and consistency.
reveals problems earlier in the design process.
allows for testing large numbers of cells and packs quickly.
ensures that the final product works smoothly when installed in vehicles.
In short, Hyundai will be able to evaluate every stage—from raw materials to full battery packs inside a car.
Heui Won Yang, President and Head of the R&D Division at Hyundai Motor Group
“Through the Future Mobility Battery Campus, we aim to seamlessly connect the entire battery ecosystem to foster cross-industry collaboration and accelerate technological advancement. We are committed to strengthening Hyundai Motor Group’s EV battery competitiveness and advancing global electrification through strategic collaborations.”
Key Focus Areas Inside the Future Mobility Battery Campus
Hyundai has outlined three main areas of focus at the new facility.
High-Precision Testing and Validation
Hyundai will recreate the full battery production process, including electrode creation, cell assembly, and activation and formation.
These steps will be tested using equipment similar to what will be used in mass-production factories. Researchers can then adjust the process repeatedly to improve safety, performance, and cost-efficiency.
The campus will also host an integrated testbed that allows researchers to perform continuous, repeat-cycle testing. Batteries can be evaluated from their earliest cell stage all the way to full pack integration. Hyundai can check how a battery ages, how it behaves under stress, and how it performs across different temperatures and driving conditions.
High-performance lithium-ion cells for EVs and Extended-Range Electric Vehicles (EREVs)
New formats and chemistries to improve range and charging speed
Better battery durability and safety
High-energy designs suited for future mobility sectors
As the EV market grows, battery innovation must keep pace. Hyundai wants to be ready for rapid changes in demand, regulations, and global supply chains.
Digital and AI-Powered Development
Hyundai will use advanced digital tools to speed up battery development. These include:
AI-based predictive modeling for faster and more accurate research
Automated testing equipment to reduce human error
Big data analytics to improve battery safety and performance over time
By combining AI with hands-on testing, Hyundai can shorten development cycles and react more quickly to discoveries and safety requirements.
A Hub for Collaboration Across the Battery Industry
Collaboration is a key goal of the Future Mobility Battery Campus. Hyundai will use it to share testing platforms, accelerate the commercialization of new battery chemistries, reduce early-stage risks, strengthen Korea’s battery supply chain, and promote growth across partners. The hub will create a broader ecosystem where innovation happens faster and more safely.
The company also signed an MOU with Gyeonggi Province, Anseong City, and Gyeonggi Housing and Urban Development Corporation to create a regional industrial cluster. This partnership aims to attract battery companies, support research, and promote sustainable economic development.
Looking Beyond EVs: Robotics, AAM, and More
Hyundai isn’t limiting the new campus to car batteries. The company wants to use its research for robotics, Advanced Air Mobility (AAM), industrial applications, and other future mobility technologies
These markets will require batteries that are lighter, safer, and more powerful, and Hyundai wants to be ready for long-term growth in these sectors.
Hyundai Expands V2X Services: EVs as Energy Providers
Alongside its battery initiative, Hyundai is also expanding its Vehicle-to-Everything (V2X) strategy. These services allow EVs to store energy and send it back to homes, the grid, or devices. Instead of being only transportation tools, EVs become mobile power sources.
Its key services are: V2G, V2H, V2L, and smart charging services across Korea, Europe, and the U.S.
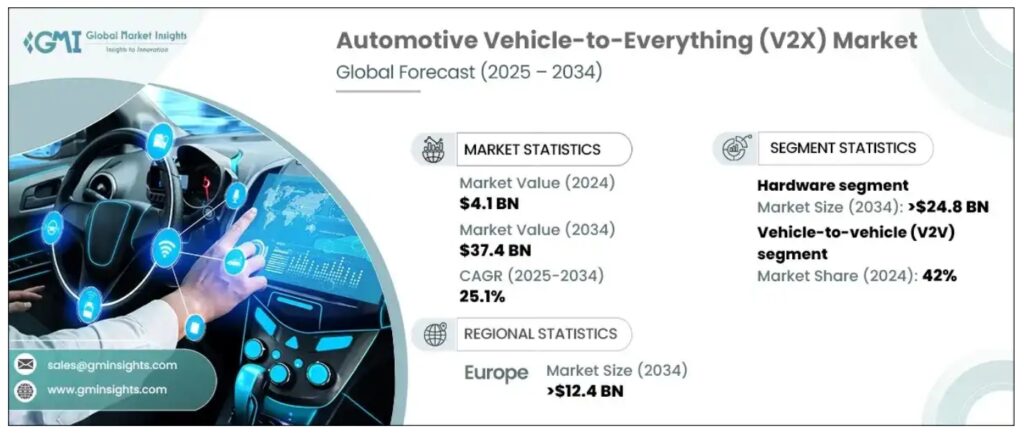
As per expert reports, the global vehicle-to-everything (V2X) market was worth USD 4.1 billion in 2024. It is expected to grow fast, with a 25.1% annual growth rate from 2025 to 2034.
This rise is mainly due to the need for safer roads and the progress being made in autonomous driving, which both increase demand for connected car technologies.
Korea’s V2G Pilot: EVs Stabilizing the Grid
By the end of 2025, Hyundai will launch Korea’s first Vehicle-to-Grid (V2G) pilot on Jeju Island with the Kia EV9 and Hyundai IONIQ 9. The program lets EVs absorb excess renewable energy and feed it back during peak demand, stabilizing the grid and lowering costs. Hyundai leads the project, with policy support from Jeju Province, KEPCO managing the grid, and Hyundai Engineering analyzing charging stations
Europe and U.S.: Lower Costs and Energy Security
In the Netherlands, Hyundai offers commercial V2G, letting drivers charge during low-cost hours and sell surplus energy at peak rates, reducing bills and supporting renewables. While in the U.S., V2H services allow EVs to power homes during outages or peak-demand periods. Kia EV9 and Hyundai IONIQ 9 owners can store energy off-peak and use it during high-demand hours, improving energy resilience.
Hyundai’s 2030 Electrification Goals
The company is pushing hard to meet its 2030 electrification goals. It is boosting battery production in major EV markets, developing next-gen batteries, and using modular designs to cut costs and speed up development. It is also making EVs more competitive by improving how hardware and software work together.
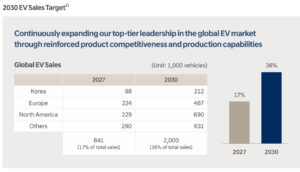
To reach carbon neutrality, the company plans to go fully electric in Europe by 2035 and in major markets by 2040. By 2030, it expects EVs to account for 36% of global sales, supported by new plants and upgraded production lines that shift the focus away from Korea.
Source: Hyundai
Net-Zero Target and Scope Emissions
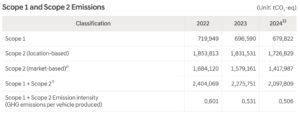
Hyundai aims to achieve carbon neutrality by 2045. In 2024, the company reported over 2.1 million tCO₂e in Scope 1 and 2 emissions and is working to cut upstream Scope 3 emissions through broader supply chain improvements.
It also signed major renewable energy deals in Korea, India, and the United States to support its RE100 commitment, aiming to run all operations on 100% renewable power by 2045.
Source: Hyundai
In conclusion, we can say that, by combining advanced battery research with smart energy services, Hyundai positions itself at the forefront of the global shift toward cleaner, more flexible, and more efficient energy systems.
Stellantis Korea recently announced that owners of its electric vehicles (EVs) can convert the mileage they have accumulated into carbon credit rewards. The company, through a carbon credit specialist, Hooxi Partners, will trade these credits and return the money as a reward to vehicle owners. This turns miles driven into a green credit benefit.
The move, the first in Korea, marks a novel incentive. Stellantis Korea doesn’t only offer discounts or rebates. They view driving an EV as building a true carbon reduction “asset.” By turning EV use into carbon credits, the company lets EV owners share in the carbon credit market.
How Stellantis Korea’s Carbon Credits Work
Carbon credits represent cuts in greenhouse gas emissions. Each credit equals one ton of avoided or removed CO₂. Credits often come from renewable energy, reforestation, or reduced industrial emissions.
For EVs, credits exist because they produce little or no tailpipe CO₂. If the electricity used for charging is low-carbon, the emission savings can be measured and turned into credits.
In South Korea, the grid emits between 0.42 and 0.45 kg CO₂ per kWh, according to industry estimates. Industry estimates that every 1,000 km driven by EVs avoids roughly 0.15–0.25 tCO₂e, depending on the energy mix.
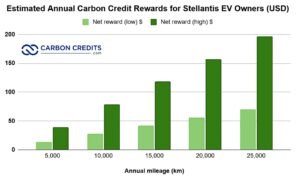
Credits are retroactive for existing mileage via app tracking and can be sold on the Korea Exchange or voluntary markets at ₩30,000–50,000 per tCO₂e ($22–37 USD). Average drivers covering 15,000 km per year could earn 2.25–3.75 credits, equivalent to ₩67,500–187,500 ($50–140 USD), with Stellantis retaining a fee.
The chart above shows the potential carbon credit rewards an EV owner could earn in a year. The program applies to all Stellantis EVs from 2023 onward, including the Peugeot e-208, Fiat 500e, and Jeep Avenger.
This gives EVs two benefits: encouraging cleaner transport and creating a tradable asset for automakers or owners. For companies like Stellantis, carbon credits are becoming part of the business model, as they can earn and sell credits worldwide.
Why The Move Is Significant? The Local Impact
In South Korea, EV adoption has surged. H1 2025 sales jumped 45.7% year-on-year to 74,000 units, giving EVs a 9.2% share of new car sales. August sales hit 18.4% amid subsidies, and full-year projections suggest an 11–20% market share with 407,000 units produced.
Still, many automakers, including Stellantis, struggled. In 2024, Stellantis Korea held less than 1% of the EV market. This year, the company aims to increase sales by about 30% in 2025. They will focus on boosting the Jeep Avenger and Peugeot due to weak EV performance.
This development matters for the East Asian country, aligning with its climate goals.
South Korea’s 2035 Climate Plan
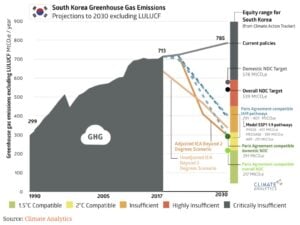
South Korea has approved a climate plan aiming to cut greenhouse gas emissions by 53–61% from 2018 levels. National emissions are expected to fall from 742 million tonnes to 348.9–289.5 million tonnes by 2035.
The transport sector faces one of the steepest cuts: 60–63%, from 98.8 million tonnes in 2018 to roughly 36.8 million tonnes in 2035. EV adoption is key to meeting this target.
South Korea pledged to join the Powering Past Coal Alliance. This marks its first promise to stop new coal power plants that lack carbon controls. It also plans to phase out existing coal plants gradually.
The carbon credit reward plan brings new value. For buyers, it offers more than just subsidies or discounts. For Stellantis, it might boost EV sales, build brand trust, and meet global demands for carbon accountability.
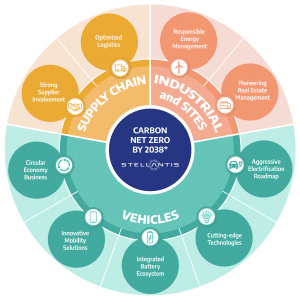
The program may also attract environmentally conscious buyers by offering a tangible “reward for clean driving.” For Stellantis, it is one way to show its commitment to its net zero goal.
Driving Toward Zero: Stellantis’ Roadmap to a Carbon‑Neutral Future
Stellantis continues to advance its net zero ambitions, with new data showing meaningful progress as of 2024.
By 2024, the company had cut its Scope 1 and 2 greenhouse‑gas emissions by about 39 % relative to its 2021 baseline. At the same time, the share of decarbonized electricity powering its own operations rose to 59 %, up from 45 % in 2021.
On the products front, Stellantis expanded its hybrid‑vehicle offerings in Europe, launching 30 hybrid models in 2024 with more planned through 2026. The company will use efficient hybrid technology. This can cut CO₂ emissions by about 20% compared to traditional combustion engines.
The company is boosting its circular economy efforts. Its hub in Italy marked a year in 2024. In that time, it remanufactured tens of thousands of engines, gearboxes, and batteries. It also reconditioned thousands of vehicles and processed millions of components. These actions support the company’s larger goals for decarbonization and resource reuse.
Source: Stellantis
These steps support Stellantis’ Dare Forward 2030 plan. The goal is to achieve carbon net zero by 2038. This will address all scopes while keeping residual emissions low.
Global EV Market Trends and Carbon Credit Strategies
Globally, EV adoption is accelerating. Data for 2024–2025 show strong growth, driven by better batteries, improved charging, lower costs, and tighter decarbonization regulations. For many automakers, shifting from internal combustion engines (ICE) to EVs is now mandatory to meet emissions targets.
Carbon Credits Becoming a Core Business Strategy
Carbon credits are now more than environmental tools; they are a growing revenue source for EV makers. Leapmotor in China supplied over 100,000 credits in 2025 at €20–30 per credit, selling to companies like Stellantis.
Tesla earned over $$2.76 billion from ZEV credits in 2024 alone, selling to GM and Ford. In the EU, automakers bank credits for compliance, with EVs generating 10–20 times more credits than ICE vehicles.
Stellantis Korea’s program follows this model: EV sales combined with carbon credit generation. For companies investing early in electrification and low-carbon energy, credits can provide financial returns beyond traditional car sales. The Korea pilot alone could generate ₩50–100B by 2027.
Policies and Incentives Push EV Adoption — But Credits Add a New Layer
Many countries provide subsidies, tax breaks, or rebates for EV buyers. In South Korea, national and local incentives helped boost EV sales. But subsidies are usually one-time benefits.
Stellantis Korea goes further by tying rewards to actual driving. Mileage now generates financial credit, aligning long-term behavior with emissions reduction and making EVs a smarter investment.
Future Outlook: A New Phase for EV Incentives
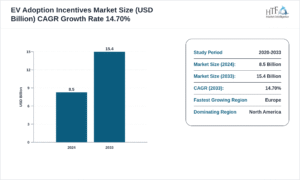
The global EV incentive market — including subsidies, rebates, and credit-based schemes — is forecast to grow at an annual growth of 14.7% from 2024 to 2033. As more carmakers use programs like Stellantis’s, carbon credits might become a key part of EV value. This could support adoption even after subsidies stop.
Source: HTF Market Intelligence
Governments may increasingly integrate carbon credit systems into EV policies, creating formal global markets. Automakers investing early in electrification, carbon accounting, and clean supply chains will gain a competitive edge.
For consumers, EVs could become cleaner and smarter long-term investments, with mileage translating into measurable financial rewards.
Stellantis Korea’s carbon credit initiative is more than marketing; it signals a new phase for EV incentives. By rewarding actual usage, it aligns consumer behavior with emission reductions while adding financial value. If successful, this model could reshape how automakers, buyers, and regulators view EVs, making clean driving both practical and profitable.
TotalEnergies has committed about US$167 million to study offshore carbon capture and storage (CCS) in Brazil. The funding will support mapping and analyzing deep-sea geological formations along the Brazilian coast.
Scientists will look at deep saline reservoirs below the seabed. They seek to find out which ones can safely store carbon dioxide (CO₂) for a long time. If suitable, these reservoirs could host large-scale offshore CO₂ storage projects in the future.
This investment comes as Brazil works on developing regulations for CCS. Scientific studies will help regulators, investors, and companies identify safe storage sites and reduce project risks. TotalEnergies shows trust in Brazil’s ability to be a carbon storage hub. This may draw more investment to the country.
TotalEnergies’ Global CCS Initiatives
TotalEnergies is also active in CCS projects worldwide, using international experience to support its work in Brazil. Key examples include:
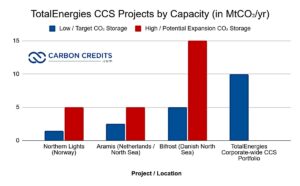
Northern Lights (Norway): Phase 1 operations started summer of 2025 with a capacity of 1.5 million tons of CO₂ per year, aiming to expand to 5 million tons by 2028.
Aramis (Netherlands): Planned to store CO₂ captured from industrial sources under the North Sea, building experience in transport and injection technologies.
North Sea Projects (Europe): TotalEnergies plans to repurpose depleted oil and gas fields for CO₂ storage. This could help hard-to-decarbonize industries reduce emissions.
By 2030, TotalEnergies aims to offer more than 10 million tons of CO₂ storage per year globally. The knowledge from these projects—on capture, transport, injection, monitoring, and safety—can help speed up Brazil’s CCS development.
Why Offshore Storage Makes Sense for Brazil
Brazil has deep offshore basins with geology well-suited for CO₂ injection. These deep saline reservoirs lie beneath thick rock layers that act as natural seals, trapping CO₂ for centuries. Offshore storage offers advantages over building new land-based facilities, including:
Existing oil and gas infrastructure, such as wells and pipelines, can be adapted for CO₂ injection.
Deployment can be quicker and cheaper. New land-based storage sites need a lot of construction.
Offshore storage reduces competition for land and avoids densely populated areas.
For a country with big offshore oil operations, using current offshore geology makes sense both technically and economically. It also provides a pathway to reduce emissions from energy and industrial production.
Moreover, CCS can earn carbon credits by reliably removing or stopping CO₂ emissions from getting into the atmosphere. Each tonne of CO₂ stored in geological formations or offshore reservoirs can be measured and certified.
This allows companies or governments to earn tradable carbon credits. These credits can be sold or used to offset emissions. This creates a financial incentive to boost carbon storage projects. It also helps with wider climate change efforts.
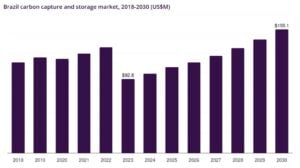
Currently, Brazil’s CCS market is small but growing. In 2024, the market value was estimated at roughly US$99.6 million. By 2030, it could rise to around US$155.1 million, with an average growth rate of 7.5% per year, per market research.
Grand View Research
Brazil could capture and store hundreds of millions of tons of CO₂ each year. This is possible if industries use CCS and create suitable storage sites.
Blending offshore and onshore storage with industrial emissions capture, plus bioenergy with carbon capture, could form a complete CCS industry. This could create billions in yearly economic value. It includes infrastructure development, monitoring services, and new jobs.
CCS Already Operating in Brazil
Brazil is not starting from scratch. Petrobras, the state-owned oil and gas company, operates one of the world’s largest offshore carbon storage programs. From 2008 to 2024, Petrobras injected about 67.9 million tons of CO₂ into deep-sea pre-salt reservoirs. In 2024 alone, the company reinjected 14.2 million tons, setting a new annual record.
Petrobras separates CO₂ from extracted gas using floating production, storage, and offloading vessels in ultra-deepwater. CO₂ is then reinjected into offshore reservoirs. This process boosts oil recovery and cuts emissions from production.
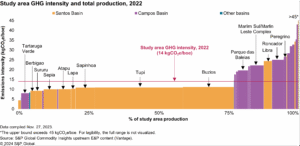
Some pre-salt oil fields now produce oil with lower emissions per barrel than the global offshore average, according to an S&P Global study. This existing track record shows that offshore CCS in Brazil is operational at a large scale.
Industries like cement and steel are looking into CCS technologies. These could cut greenhouse gas emissions by up to 57% in heavy industry.
What TotalEnergies’ Investment Brings
TotalEnergies’ funding plays several key roles:
First is scientific research. Mapping geology and testing reservoirs reduces uncertainty and risks for large-scale CCS projects.
Second is market confidence. Investment by a major energy company signals that Brazil could become a CCS hub, attracting more companies and investors.
Third is industry development. If offshore and onshore CCS grow together, Brazil can create a strong carbon-management industry. This would mix industrial capture, bioenergy, and storage.
Last is climate impact. CCS helps sectors that find it hard to cut emissions, such as heavy industry and fossil fuel extraction, reduce their CO₂ output.
TotalEnergies’ investment can boost Brazil’s climate strategy. It supports scientific research and industrial adoption that could lead to safe, scalable CCS capacity.
Challenges for Scaling CCS in Brazil
Despite its potential, scaling CCS in Brazil faces several hurdles, such as:
Cost: Building offshore infrastructure, drilling injection wells, and installing CO₂-handling systems require large investments.
Regulation: Clear laws and oversight are essential. CCS operations need rules for site approval, environmental safety, monitoring CO₂ over decades, and liability if leaks occur.
Demand: CCS depends on enough CO₂ emitters—such as factories, refineries, and power plants—willing to pay for capture and storage. Without sufficient demand, storage sites and pipelines may remain underused.
Public Trust: Communities need assurance that CO₂ storage is safe over the long term. Transparency, monitoring, and clear liability are critical.
Scope Limits: CCS reduces emissions at the point of capture but does not prevent CO₂ released when fossil fuels are later burned. CCS complements, but does not replace, the need for cleaner energy and reduced fossil-fuel use.
Addressing these challenges will determine whether Brazil can achieve large-scale CCS adoption and unlock its full potential.
What to Watch: Future CCS Growth and Policy Developments
In the next few years, several key changes will shape how carbon capture and storage grow in Brazil. First, TotalEnergies’ geological studies will identify safe offshore locations for burying CO₂. This will help find the best storage sites.
Clear government rules will be important. They will guide how to approve sites, monitor stored CO₂, and certify carbon credits. This will help build trust with investors and protect the environment. More industries, like power plants, oil refineries, cement factories, and bioenergy plants, will begin using CCS. This will increase the demand for new setups.
Brazil will expand its infrastructure to keep up with rising demand. This includes building more pipelines, injection wells, storage centers, and monitoring tools. These steps, backed by companies like Petrobras investing billions, position Brazil as a leader in Latin American CCS.
If these factors align, Brazil could establish a major carbon storage industry. This would reduce national greenhouse gas emissions and create a new economic sector, while using existing expertise from Petrobras and global CCS developments.
Artificial intelligence is transforming the world, and its impact on energy is growing faster than anticipated. Over the past few years, tech companies have invested huge amounts of money into new data centres to train and run advanced AI models. These facilities are now significant energy consumers, and their rapid expansion is prompting governments and utilities to reassess grid planning, supply choices, and long-term energy strategies.
IEA’s 2025 World Energy Outlook has pointed out that AI’s influence on energy is not just about higher demand. AI is also becoming a powerful tool for boosting efficiency, cutting waste, and speeding up clean energy innovation. The next decade will show how well countries balance these two sides of the AI-energy equation.
Let’s dive deeper into this.
AI’s Rising Footprint: Data Centres Double Their Electricity Use by 2030
The world is building data centres at record speed. In 2025 alone, global investment in data centres is expected to hit USD 580 billion—surpassing the USD 540 billion going into oil supply that same year. This simple comparison shows how digital the global economy has become.
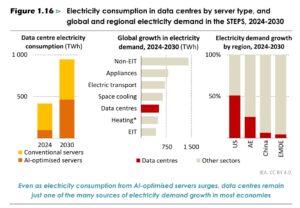
AI-optimised servers use far more power than traditional equipment. According to recent analysis, electricity use from these servers could increase fivefold by 2030, driven by soaring demand for AI applications.
As a result, total data centre electricity consumption is set to double by the end of the decade.
Even with such rapid growth, data centres will still make up less than 10% of global electricity demand growth between 2024 and 2030. Other areas—such as industry, electric vehicles, and cooling—will drive more absolute growth. Still, the speed of data centre expansion creates pressure on regional grids, especially in the United States, where AI and cloud computing are scaling the fastest.
Source: IEA
The Power Side Story: Where Will All This Electricity Come From?
As data centres multiply, the energy system must adapt. Most facilities rely on grid electricity, so their carbon footprint depends on the mix of power available where they operate.
Renewables lead the growth.
Between now and 2035, renewable energy will supply around 45% of the new electricity demand from data centres in many outlook scenarios. Wind and solar continue to dominate additions because they are cheap, scalable, and widely supported by policy.
Natural gas also plays a big role
In regions like the United States and the Middle East, natural gas remains a key backup to meet rising AI-driven loads. Gas-fired generation for data centres could grow by 220–285 TWh by 2035. But a surge in orders for new gas turbines is stretching supply chains, making equipment more expensive and slower to deliver.
Nuclear power is back in the conversation.
Tech companies are showing new interest in nuclear energy to power high-demand AI clusters. Several firms and utilities have announced deals to extend the life of existing reactors. The world also saw the first power-purchase agreement between a data centre and an SMR (small modular reactor)—a sign that nuclear could become a steady baseload option for AI operations.
A Geographic Tilt: The U.S., China, and Europe Dominate AI-Driven Power Demand
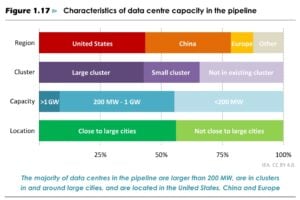
Data centres are not spread evenly across the world. The United States, China, and Europe make up 82% of global capacity, and they will host over 85% of new builds in the coming years.
But their impact on electricity demand differs sharply:
United States: Data centres account for nearly half of the country’s electricity demand growth through 2030. This is the highest share globally.
China and the European Union: Data centres contribute 6–10% of demand growth. Their energy systems are larger and more diverse, so AI plays a smaller role in shaping overall consumption trends.
A closer look at the project pipeline reveals even more pressure points:
More than half of the upcoming data centres sit within or near cities with over 1 million people, where grids are already stressed.
55% of new data centres exceed 200 MW—each one consuming as much energy as 200,000 households once operational.
Nearly two-thirds of new construction is happening in existing high-density clusters, increasing the risk of local grid congestion.
Beyond Demand: AI Could Cut Global Energy Use by Boosting Efficiency
AI’s story in energy is not only about higher consumption. It also offers major efficiency gains across sectors.
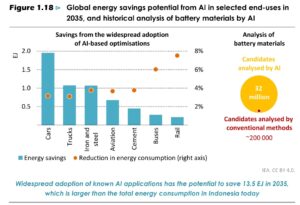
When deployed widely, AI systems can optimise manufacturing, improve logistics, manage transportation flows, detect energy waste, and improve industrial process controls. Analysts suggest that broad adoption of AI-enabled solutions could deliver 3–10% efficiency gains across transport and industry by 2035.
This would translate into 13.5 exajoules of energy savings—slightly more than the entire energy consumption of Indonesia today. Such savings would support national efficiency targets and help reduce emissions at a time when every region is under pressure to accelerate climate action.
However, several challenges stand in the way:
Many industries lack high-quality datasets needed for advanced AI optimisation.
Digital infrastructure is uneven, especially in developing countries.
Concerns around privacy, regulation, and cybersecurity slow deployment.
Some AI-driven improvements may create rebound effects, such as more automated car use, reducing public transport ridership.
Source: IEA
AI is reshaping the energy system by driving rapid growth in electricity demand while also offering powerful tools to improve efficiency and accelerate clean-tech innovation. Data centres are expanding faster than many grids can handle, pushing regions to invest in renewables, natural gas, and nuclear power.
Yet AI’s real value lies in its ability to cut waste and make energy systems smarter—if supported by strong data, robust digital infrastructure, and sound regulation. AI is not a magic solution, but with thoughtful planning and investment, it can become a major force in building a cleaner, more resilient global energy future.
Canada is at a key moment in its fight against climate change. Carbon pricing has been the central tool used to cut emissions, but recent policy changes and differences across provinces have created uncertainty.
This article examines how Canada’s carbon pricing system works now. It covers expert concerns and what the key federal review in 2026 might mean for both industry and the country’s journey toward a lower-carbon future.
How Canada Prices Pollution
Canada uses carbon pricing to encourage companies and people to cut greenhouse gas (GHG) emissions. Under that system, there are two main parts.
For ordinary people and small businesses, there used to be a “fuel charge” or carbon tax on fossil fuels. For large industrial emitters, there is a program called the Output-Based Pricing System (OBPS).
Under the OBPS, factories or facilities that produce a lot of emissions get a limit based on how much they produce. If they emit more than their limit, they must pay; if they emit less, they earn credits that they can sell or use later.
This approach aims to reduce carbon pollution while trying to protect industries that compete globally. The goal is to cancel out the risk that companies might move to other countries with weaker climate rules.
From Gas Pumps to Smokestacks: A Major Policy Shift
In 2025, the federal government made important changes. It removed the “consumer-facing” carbon tax — the fuel charge — effective April 1, 2025. This means people pay no extra carbon tax when buying gasoline or heating fuel.
Source: RBN Energy LLC website
Instead, the focus shifted more clearly onto industrial carbon pricing. The government said it would review the carbon pricing “benchmark” in 2026. This review could change how industrial carbon pricing operates.
A recent analysis by ClearBlue Markets shows that Canada’s carbon pricing for industry is now fragmented. Fragmentation has caused uncertainty. This is a problem for companies that need stable cost signals before they invest in cleaner technology.
The ClearBlue report stated:
“The federal benchmark review will therefore trigger extensive engagement between the federal government and the provinces, aimed at aligning key benchmark elements such as coverage, pricing stringency, and competitiveness protections. Negotiations are likely to be complex and politically charged, particularly with provinces like Alberta and Saskatchewan, which have already taken strong positions. These types of unilateral decisions reflect ongoing tensions and highlight the difficulty of achieving a truly aligned national approach.”
Carbon pricing today: A patchwork across Canada
Because Canada is large and its provinces have different rules, carbon pricing for industry is not the same everywhere. ClearBlue Markets shows that credit prices—what companies pay or earn—vary a lot by province or system.
Here are specific examples:
In Alberta, the Environmental Monitoring, Evaluation and Reporting Agency has seen a big drop in credits under its Technology Innovation and Emissions Reduction Program (TIER). Despite a compliance price of CAD 95 per tonne, market credits trade at around CAD 18 per tonne. This shows a credit surplus and weak demand.
In British Columbia (B.C.), the new B.C. Output-Based Pricing System (B.C. OBPS) began to be applied recently. Credits are trading at about CAD 65 per tonne, a discount compared with the regulatory level of CAD 80.
In Ontario, the Emissions Performance Standards (EPS) system governs industrial emissions. Because the program does not allow offset credits, supply is tighter — units (EPUs) recently traded at around CAD 72 per tonne.
In areas where the federal OBPS still applies, like some territories and small provinces, cheap carbon offset credits from Alberta’s TIER have lowered prices. Now, they can be as low as about CAD 37.50 per tonne.
Data source: ClearBlue Markets
The true cost of carbon emissions differs greatly by industry and province. The federal government aims to raise the carbon price to CAD 170 per tonne by 2030 for direct pricing systems.
The 2026 Showdown: Can Canada Fix Its Carbon Market?
The upcoming review of the federal benchmark is seen as a turning point. It could lead to stronger, more aligned carbon pricing across all provinces. As ClearBlue Markets notes, the review may address issues such as:
Align different provincial systems under a common design. This way, credits and compliance will act more alike.
Improving transparency in reporting credit inventories, trades, and emission reductions.
Possibly introducing a “floor price” — a minimum cost for carbon credits — to avoid extreme price drops like those seen in some programs.
Setting a long-term carbon price path past 2030 helps industries plan investments more clearly. This is especially important for clean technologies.
All of these could make carbon pricing more predictable and effective. If the review doesn’t meet expectations, patchwork and uncertainty may persist. This could weaken the carbon price signal and confuse investment in clean technology.
This patchwork of provincial and federal carbon pricing programs has created a corresponding patchwork of compliance offset markets. The image below shows how these offset markets are distributed across Canada.
Source: ClearBlue Markets
Global Pressure Is Rising: Europe Could Hit Canada with Carbon Tariffs
One major external risk comes from the global trade environment. Starting in 2026, the European Union’s Carbon Border Adjustment Mechanism (CBAM) will impact imports based on their carbon emissions.
For Canadian exporters, this raises a key question:
Will EU authorities accept the compliance credits or offsets generated under Canada’s various carbon pricing systems as evidence of “carbon price paid”?
If not, Canadian exports might face extra tariffs. This could double the carbon cost or hurt competitiveness.
This makes it even more important for Canada to standardize and strengthen its carbon pricing framework before 2026. This is to ensure that its pricing and credits are recognized internationally. Otherwise, Canadian industries like steel, aluminum, and cement might find it hard to compete. This is especially true in markets with strict climate-related import rules.
Strengths and Challenges of Canada’s Carbon Pricing
Carbon pricing works to link environmental costs with economic decision-making. For large emitters, it encourages improved efficiency. Carbon pricing revenue, especially from the OBPS, can fund clean energy projects. It also supports carbon capture and investments in low-carbon infrastructure.
A recent evaluation by the government highlights that industrial carbon pricing helps reduce emissions with minimal impact on households.
But there are major challenges too. The system varies by province, so many industries might have low carbon costs. This means there is little motivation for real change.
A 2022 report from the Office of the Auditor General of Canada (OAG) found that weak rules in provincial large-emitter programs lower the impact of carbon pricing. Also, the unclear use of carbon revenues and the long-term price outlook have made some firms hesitant to invest in cleaner technologies.
The Stakes: Canada’s Climate Credibility and Industrial Future
The 2026 benchmark review could reshape Canada’s carbon pricing for decades. Key signs to watch are:
Whether the government sets a new, clear carbon price path beyond 2030 — possibly up to 2050, that would give firms confidence to invest in long-term clean solutions.
Whether provincial carbon pricing systems become more harmonized. This means similar rules, credit prices, and transparency everywhere.
Introducing a price floor or other methods can help prevent deeply discounted carbon credits. This ensures a strong carbon price signal.
Will Canadian industrial credits and compliance be set up to gain recognition under global systems like CBAM? This could help keep Canadian exports competitive.
Canada’s carbon pricing, especially for industry, is at a crossroads. The removal of the consumer carbon tax in 2025 reflects a shift toward focusing on industrial emissions. Meanwhile, the upcoming 2026 benchmark review offers a chance to make this system stronger, fairer, and more predictable.
However, much depends on political and regulatory will. Without clear pricing, rules, and long-term certainty, the carbon price might be too weak. This puts Canada’s climate goals and global competitiveness at risk. But if the government and provinces act quickly, carbon pricing can help Canada shift to a low-carbon economy while also keeping industries competitive.
To provide the best experiences, we use technologies like cookies to store and/or access device information. Consenting to these technologies will allow us to process data such as browsing behavior or unique IDs on this site. Not consenting or withdrawing consent, may adversely affect certain features and functions.
Functional
Always active
The technical storage or access is strictly necessary for the legitimate purpose of enabling the use of a specific service explicitly requested by the subscriber or user, or for the sole purpose of carrying out the transmission of a communication over an electronic communications network.
Preferences
The technical storage or access is necessary for the legitimate purpose of storing preferences that are not requested by the subscriber or user.
Statistics
The technical storage or access that is used exclusively for statistical purposes.The technical storage or access that is used exclusively for anonymous statistical purposes. Without a subpoena, voluntary compliance on the part of your Internet Service Provider, or additional records from a third party, information stored or retrieved for this purpose alone cannot usually be used to identify you.
Marketing
The technical storage or access is required to create user profiles to send advertising, or to track the user on a website or across several websites for similar marketing purposes.