The Ultimate Guide to Biofuels: A Complete Overview of Sustainable Fuel Alternatives

As global economies accelerate decarbonization, attention is shifting beyond electricity toward harder-to-abate sectors that still rely on liquid fuels. Transport, aviation, and shipping account for a large share of global energy-related COโ‚‚ emissions, with transport alone contributing around one-quarter, according to the International Energy Agency (IEA).

Electrification is changing passenger vehicles, but it’s slow in heavy-duty transport, aviation, and shipping. This is because of energy density needs and infrastructure limits. This gap has brought biofuels back into focus as a key part of the energy transition.

Biofuels are liquid or gaseous fuels made from organic materials such as crops, agricultural waste, used cooking oil, and algae. They can usually fit into current engines with little change. This makes them crucial for areas where full electrification isn’t practical yet.

Today, biofuels supply about 4โ€“5% of global transport fuel demand. However, their role is expected to grow, particularly in aviation and heavy transport, where demand is projected to increase under net-zero pathways outlined by the IEA.

The industry is moving from first-generation crop-based fuels to advanced biofuels made from waste and non-food materials. This shift is driven by sustainability concerns and changing policies like the EU RED III and U.S. RFS.

This guide explores the biofuels landscape, including production methods, fuel types, market trends, policy drivers, and future outlook.

Executive Summary

  1. What Are Biofuels? A Renewable Alternative to Fossil Fuels
  2. Lifecycle Emissions of Biofuels: Why LCA Matters
  3. Why Biofuels Matter in the Energy Transition
  4. Policy as the Main Growth Driver
  5. Corporate Demand and Net-Zero Commitments
  6. How Biofuels Are Produced
  7. Types of Biofuels and Their Industrial Applications
  8. Global Policy and Regulatory Landscape for Biofuels
  9. Carbon Markets and Fuel Standards
  10. Global Biofuel Market Size, Key Players, and Economic Trends
  11. Future Outlook: Where Biofuels Are Headed
  12. Conclusion: The Strategic Role of Biofuels in Net Zero Pathways

1. What Are Biofuels? A Renewable Alternative to Fossil Fuels

Biofuels are fuels made from recently living organic materials, also known as biomass. These include plants, algae, agricultural residues, forestry waste, and used cooking oils.

Unlike fossil fuels, which take millions of years to form, biofuels are part of the modern carbon cycle. The carbon they release during combustion was recently absorbed from the atmosphere as the biomass grew.

This is important for climate impact. In theory, biofuels can reduce greenhouse gas emissions compared to fossil fuels. However, results vary widely depending on feedstocks, production methods, and land-use changes.

Biofuels are generally divided into liquid and gaseous fuels, and further grouped by “generation” based on feedstock type and technology maturity.

Main Types of Biofuels

Ethanol (Alcohol-Based Fuel):

Ethanol is the most widely used biofuel globally and is mainly blended with gasoline. It is produced by fermenting sugars and starches from crops such as corn and sugarcane. It is then distilled and used as a fuel additive.

Key points:

  • Common blends: E10, E85
  • Major producers: the United States and Brazil
  • Largest biofuel by global volume (EIA data)

Ethanol helps reduce emissions, but its climate performance depends on farming practices, fertilizer use, and land conversion.

Biodiesel (FAME):

Biodiesel is made from vegetable oils, animal fats, or recycled cooking oil through a process called transesterification. It is used in diesel engines, either pure (B100) or blended (B20).

Common feedstocks include:

  • Soybean oil (U.S., Brazil)
  • Rapeseed oil (EU)
  • Palm oil (Southeast Asia)

Biodiesel generally reduces particulate emissions and lifecycle carbon intensity compared to diesel. However, some feedstocks, especially palm oil, raise concerns over deforestation and land-use change.

Renewable Diesel (HVO):

Renewable diesel is chemically different from biodiesel. It is produced through hydrotreatment and is almost identical to petroleum diesel.

Key advantages include:

  • Fully compatible with existing engines
  • Higher energy density than biodiesel
  • Better cold-weather performance
  • Lower emissions when made from waste feedstocks

It is increasingly used in California and parts of Europe as a low-carbon diesel substitute.

Sustainable Aviation Fuel (SAF)

SAF is a fast-growing biofuel designed for aircraft and can be blended with jet fuel without engine changes. It can be made from:

  • Used cooking oil
  • Agricultural residues
  • Synthetic pathways (power-to-liquid)

According to the International Civil Aviation Organization (ICAO), SAF could deliver over 60% of the emissions reductions needed for aviation to reach net zero by 2050. However, growth is limited by high costs and limited feedstock supply.
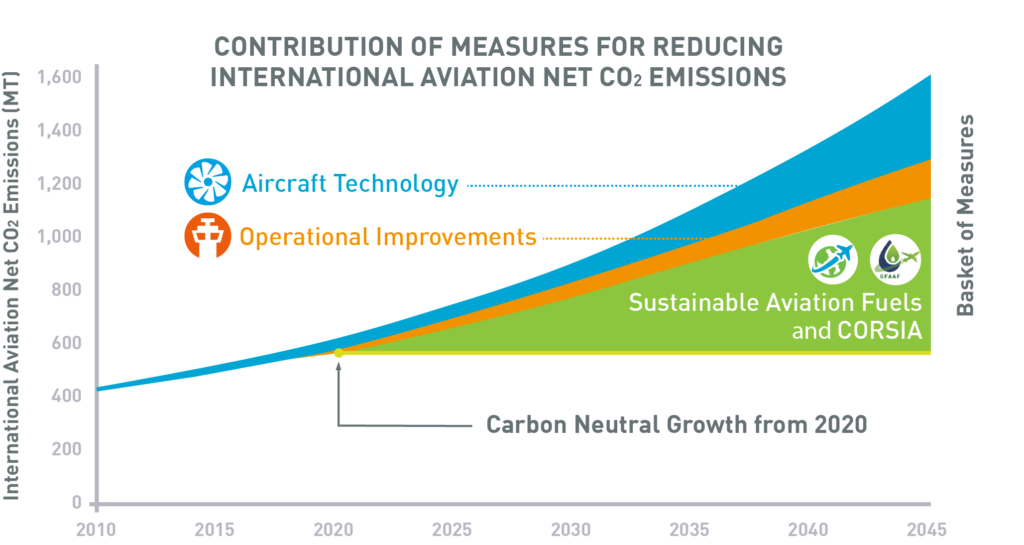
sustainable aviation fuel saf for net zero ICAO
Source: ICAO

Biogas and Biomethane

Biogas is produced from organic waste such as manure, sewage, and food waste through anaerobic digestion. It contains methane and carbon dioxide. When purified, it becomes biomethane, which can be used as:

  • Transport fuel
  • Gas grid injection

It plays two key roles: waste management solution and renewable energy source. It is especially important in agricultural regions with large organic waste streams.

Biofuel “Generations”: First, Second, and Third

Biofuels are also classified into generations based on feedstock sustainability and technological maturity. Here is how these generations differ from one another.

First-Generation Biofuels

  • Derived from food crops (corn, sugarcane, vegetable oils)
  • Most commercially mature
  • Controversial due to the food vs fuel debate

Second-Generation Biofuels

  • Derived from non-food biomass (agricultural residues, wood waste)
  • Lower competition with food systems
  • More complex and expensive to produce

Third-Generation Biofuels

  • Derived from algae
  • Extremely high theoretical yields per land area
  • Still largely in pilot and early commercialization stages

Advanced Biofuels (Cross-Cutting Category)

Includes second- and third-generation fuels plus waste-based pathways such as used cooking oil and municipal solid waste conversion. These are increasingly prioritized in climate policy frameworks due to better lifecycle emissions performance.

Energy Density and Performance vs. Fossil Fuels

One of the key technical constraints of biofuels is energy density, which affects efficiency in transport applications.

  • Gasoline and diesel remain highly energy-dense liquid fuels.
  • Ethanol has a lower energy content per liter than gasoline.
  • Biodiesel and renewable diesel are closer to fossil diesel, but still vary depending on feedstock and processing.

This is why biofuels are often used in blended form, rather than as full replacements in most transport systems.
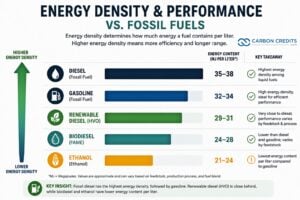
energy density of biofuel vs fossil fuels
Data source: AFDC (Alternative Fuels Data Center)

2. Lifecycle Emissions of Biofuels: Why LCA Matters

When evaluating biofuels, the key question is not ‘Are biofuels zero emissions?’ but ‘What is the full lifecycle carbon intensity of this pathway versus fossil fuel baselines?'”

Unlike fossil fuels, biofuels cannot be evaluated based solely on tailpipe emissions. Their climate impact depends on a full lifecycle assessment (LCA), which includes:

  • Feedstock cultivation,
  • Land-use change,
  • Processing and refining,
  • Transportation, and
  • End-use combustion.

This means that some biofuels can reduce emissions by 50โ€“80% compared to fossil fuels. Meanwhile, others may deliver much smaller benefitsโ€”or even net increasesโ€”if land-use change is significant.

This variability is a key reason why biofuels are important and debated in global climate policies.

Now that we know what biofuels are and how they’re classified, let’s look at their importance in the global energy shift. Why do governments and industries keep investing in them, even with options like electrification and hydrogen?

3. Why Biofuels Matter in the Energy Transition

Despite rapid growth in renewable electricity and electric vehicles, global emissions remain concentrated in sectors that are difficult to electrify. The IEA states that transport makes up around 24% of global energy-related COโ‚‚ emissions. Aviation and shipping are among the fastest-growing emission sources.

The main challenge is not only emissions, but physical constraints. Aircraft, ships, and long-haul trucks require fuels with high energy density, fast refueling, and long operating range. Current battery technology cannot yet meet these needs at scale.

This is why biofuels remain important as a transitional solution in the energy mix.

Where Biofuels Fit in Transport

Biofuels play different roles depending on the transport segment.

Road transport:
This is the most electrified segment, but internal combustion engines still dominate in many regions and in freight. Ethanol and biodiesel are widely used as blending fuels to reduce emissions without changing existing infrastructure.

Aviation:
Aviation is one of the most important growth markets for advanced biofuels. It contributes around 2โ€“3% of global COโ‚‚ emissions, but its overall climate impact is higher due to non-COโ‚‚ effects such as contrails.

Maritime shipping:
Shipping accounts for nearly 3% of global emissions (IMO data). While hydrogen and ammonia are being explored, bio-based marine fuels remain one of the few near-term, scalable options compatible with existing engines.

The Drop-In Advantage

One of the key strengths of biofuels is their compatibility with existing systems. Unlike electrification, which requires new infrastructure, biofuels can often be used with minimal changes.

They work with:

  • existing combustion engines,
  • existing fuel distribution networks, and
  • existing storage systems.

This reduces transition costs, especially in sectors with long asset lifetimes such as aviation and shipping, where equipment can operate for 20โ€“30 years.

Energy Security and Fuel Diversification

Beyond emissions reduction, biofuels are increasingly linked to energy security. Recent energy shocks caused by the US-Israel and Iran war have highlighted the risks of relying heavily on imported fossil fuels.

Biofuels help countries reduce oil import dependence, diversify energy supply, and strengthen local agricultural and waste value chains.

For example, Brazil uses sugarcane ethanol as a major domestic fuel source, reducing gasoline imports. The United States and the European Union also integrate biofuels into national fuel policies to improve energy resilience.

4. Policy as the Main Growth Driver

Biofuels are highly policy-driven compared to many other energy technologies. Demand is largely created through regulation rather than pure market economics. The key frameworks today include:

  • U.S. Renewable Fuel Standard (RFS): mandates blending of ethanol and biodiesel
  • EU Renewable Energy Directive (RED III): sets renewable transport targets and prioritizes advanced biofuels
  • Low Carbon Fuel Standards (LCFS): reward fuels based on lifecycle carbon intensity

These systems create a guaranteed demand floor even when biofuels are not yet cost-competitive with fossil fuels.

5. Corporate Demand and Net-Zero Commitments

Corporate climate strategies are becoming a major driver of biofuel demand, especially in aviation and logistics.

Airlines and shipping companies are signing long-term contracts for sustainable aviation fuel (SAF) and renewable diesel to meet emissions targets. This is important because aviation is difficult to decarbonize, and SAF is currently one of the only scalable compliance options.

As a result, biofuels are now part of both:

  • government climate policy,
  • corporate ESG and net-zero strategies.

Climate Performance: Why Biofuels Remain Debated

Biofuels are not uniform in their climate impact. Lifecycle emissions vary widely depending on feedstock type, production method, land-use change, and transport distance.

According to IEA and OECD findings:

  • Waste-based biofuels can reduce emissions by 50โ€“90%.
  • Some crop-based biofuels deliver much lower reductions when land-use impacts are included.

This is driving a policy shift toward advanced biofuels that avoid food competition and reduce land-use risks.

Why Biofuels Still Matter in a World of EVs

Even with rapid electric vehicle growth and early hydrogen development, biofuels remain important because they fill a specific gap in the energy transition.

  • EVs dominate light-duty transport.
  • Hydrogen is still early-stage and infrastructure-heavy.
  • Biofuels work in existing high-energy systems today.

In other words, biofuels are not competing with electrification. They are filling the last-mile decarbonization gap in liquid fuel-dependent sectors.

With the strategic role of biofuels established, the next step is to understand how they are actually produced.

6. How Biofuels Are Produced

Biofuel production is not a single process. It is a group of industrial methods that convert biological materials into liquid or gaseous fuels. The process depends on the feedstock, technology used, and final fuel type.

According to the IEA, most commercial biofuels today come from a few main pathways: ethanol fermentation, biodiesel production, hydrotreated renewable diesel (HVO), and emerging aviation fuel technologies such as HEFA and alcohol-to-jet.

Together, these make up the majority of the global biofuel supply, which is around 170 billion liters annually.

Feedstocks: The Starting Point

All biofuels begin with biomass feedstocks. These materials strongly influence cost, emissions, and scalability.
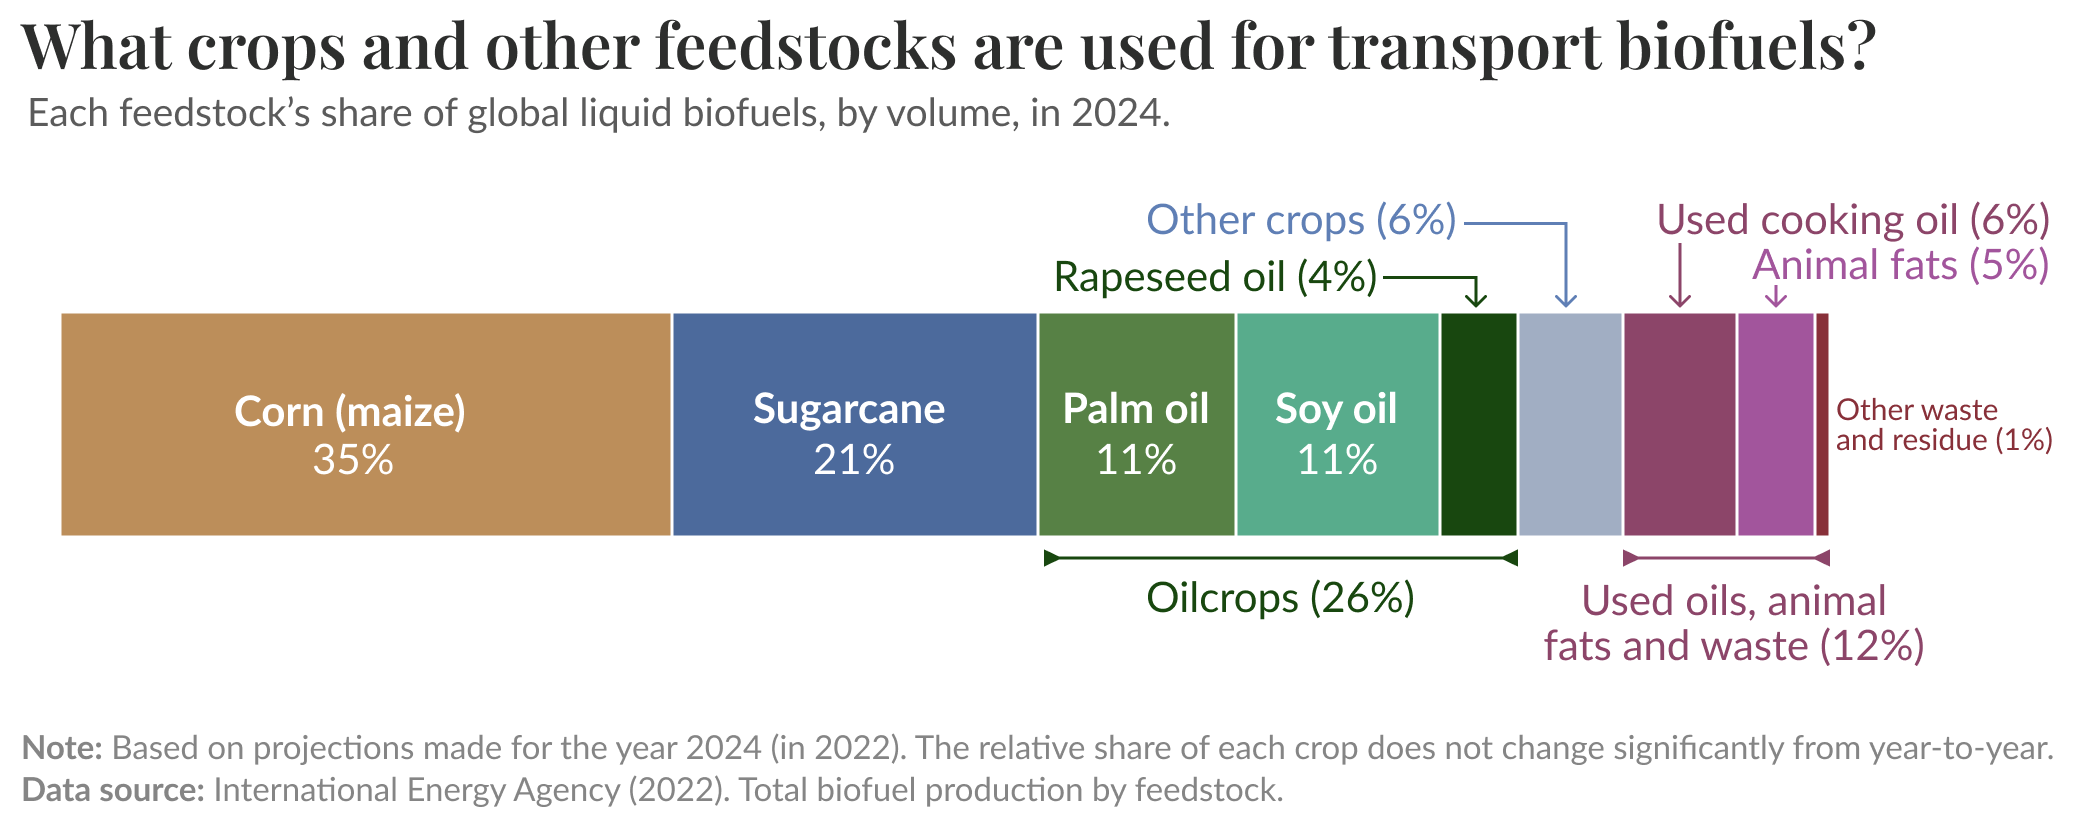
biofuel-production-by-crop
Source: Our World in Data

Conventional feedstocks include corn, sugarcane, soybean oil, rapeseed oil, and palm oil. These dominate current production because they are widely available and supported by existing agricultural systems. However, they can raise concerns about land use, food competition, and indirect emissions.

Advanced feedstocks are increasingly preferred in climate policy. These include used cooking oil, animal fats, agricultural residues, forestry waste, municipal solid waste, and non-food energy crops. These materials generally offer lower lifecycle emissions, but supply is limited.

The IEA notes that waste-based feedstocks currently represent a smaller share of production but must grow significantly to align with net-zero scenarios.

Ethanol: Fermentation-Based Fuel

Ethanol is the most widely produced biofuel and is mainly blended into gasoline.

It is made by fermenting sugars and starches from crops such as corn and sugarcane. The process involves breaking down plant material into sugars, fermenting them into alcohol, and then refining the fuel.

Ethanol accounts for roughly 70% of global biofuel consumption by volume. The United States and Brazil are the main producers.
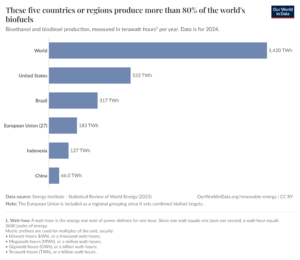
these-five-countries-or-regions-produce-more-than-80-of-the-worlds-biofuels

Its main limitation is its dependence on agricultural inputs. Fertilizer use, land conditions, and crop yields all affect its overall emissions performance.

Biodiesel: Oil-Based Conversion

Biodiesel is produced from vegetable oils, animal fats, and waste oils through a chemical process called transesterification. This process converts oils into fatty acid methyl esters (FAME), which can be used in diesel engines.

It is commonly blended with diesel in mixtures such as B20.

Production costs are highly sensitive to feedstock prices, which can account for 70โ€“90% of total costs according to industry and IEA-related estimates. This makes biodiesel economically volatile.

Sustainability concerns also exist, particularly around palm oil, which has been linked to deforestation in some regions.

Renewable Diesel (HVO)

Renewable diesel is chemically different from biodiesel. It is produced through hydrotreatment, where feedstocks are processed with hydrogen under high temperature and pressure.

The result is a fuel that closely resembles petroleum diesel.

Key advantages include full engine compatibility, higher energy density, and lower emissions when made from waste-based feedstocks. It also performs better in cold conditions.

The U.S. Energy Information Administration (EIA) reports that renewable diesel capacity is growing fast. Meanwhile, biodiesel has stalled in some markets because of competition for feedstock.

Sustainable Aviation Fuel (SAF)

SAF is one of the fastest-growing biofuel segments. It is designed to match jet fuel properties while reducing lifecycle emissions.
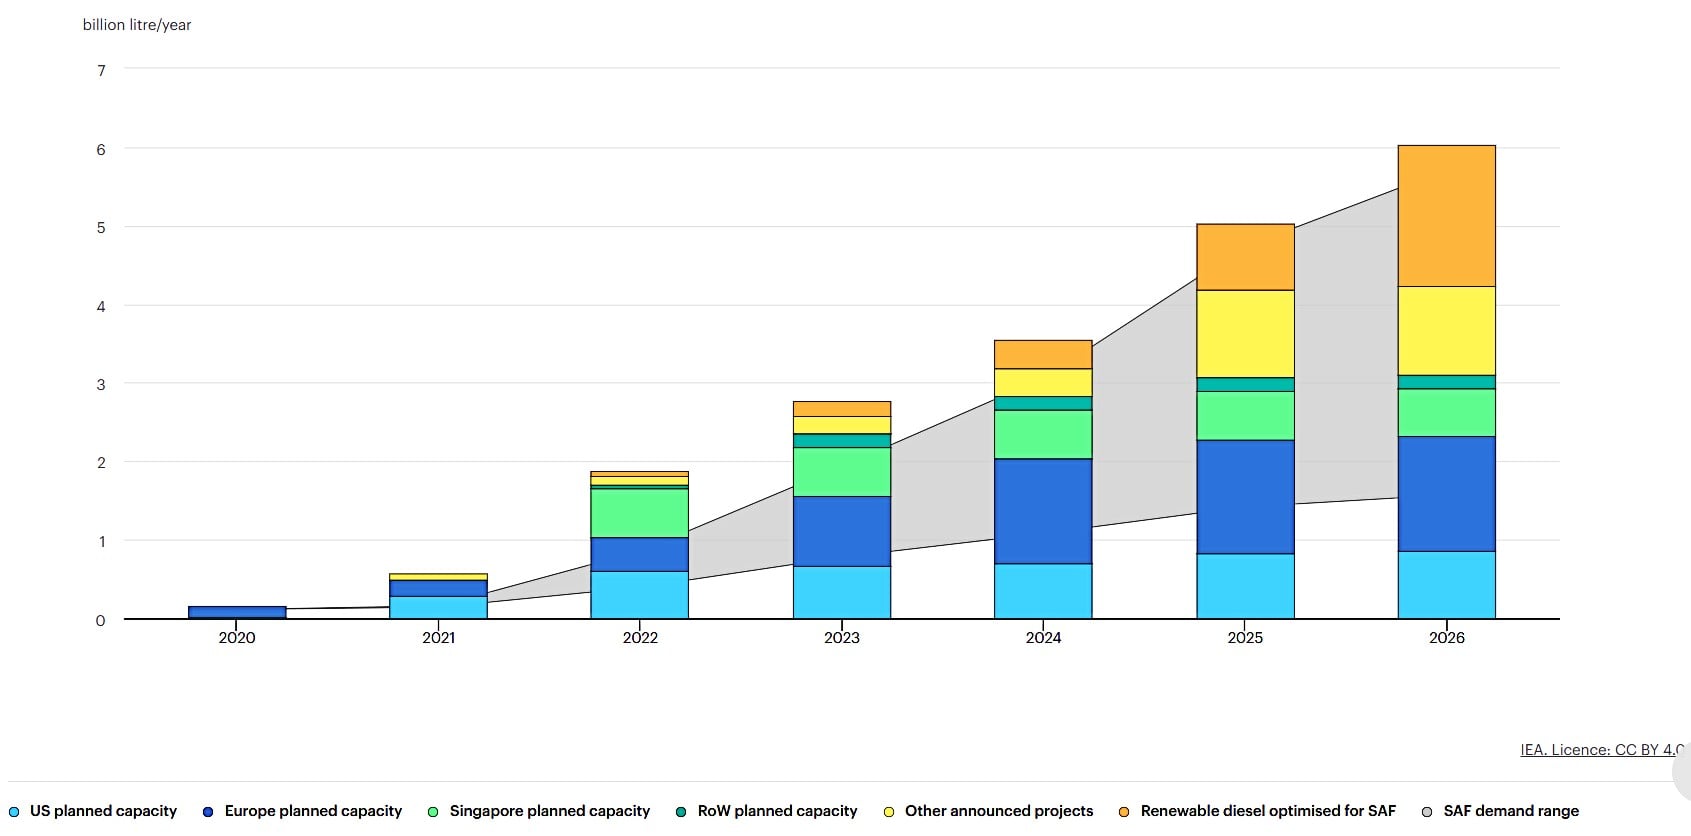
Annual SAF demand range 2026
Source: IEA

It is produced through several pathways, including HEFA, alcohol-to-jet (ATJ), and Fischer-Tropsch synthesis using biomass or waste gases.

SAF can reduce lifecycle emissions by up to 80% compared to conventional jet fuel, depending on feedstock and production method. However, scaling remains difficult due to:

  • limited sustainable feedstocks,
  • high production costs, and
  • early-stage infrastructure.

Advanced Biofuels and New Pathways

Next-generation biofuels aim to expand feedstock flexibility and improve efficiency. These include gasification, pyrolysis, cellulosic ethanol, and alcohol-to-jet technologies.

The IEA estimates that advanced biofuels could represent over 40% of total supply in net-zero scenarios by 2030. However, current production costs are often 2โ€“3 times higher than those of fossil fuels, though they will decline with scale.

Key Production Reality: Cost Structure

Across all biofuel types, one factor dominates: feedstock cost.
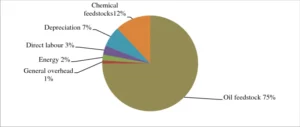
biodiesel cost structure
Source: https://www.researchgate.net/publication/236872406_Alternative_Fuels_Research_Progress

In many cases, 70โ€“95% of the total production cost comes from feedstock procurement. This creates a structural trade-off:

  • Waste-based fuels offer better emissions performance but limited supply, while crop-based fuels are scalable but raise sustainability concerns.

This balance between cost, scale, and sustainability defines the entire biofuels industry.

7. Types of Biofuels and Their Industrial Applications

Biofuels are not a single-market solution. Their role depends on how different fuel types fit into specific sectors with different energy needs, infrastructure, and decarbonization limits.

According to the International Energy Agency, more than 90% of liquid biofuels are currently used in road transport. However, this is slowly changing as aviation and shipping emerge as higher-value demand areas due to limited low-carbon alternatives.

Road Transport: The Largest Market

Road transport is the most mature biofuel market, mainly using ethanol and biodiesel.
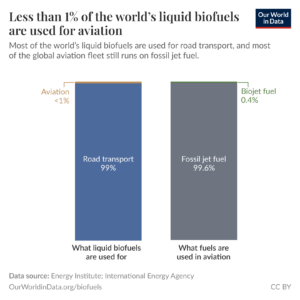
biofuel-use-in-aviation

Ethanol is blended into gasoline to reduce emissions and improve fuel performance. Biodiesel and renewable diesel are blended into diesel to lower particulate emissions and lifecycle carbon intensity.

The United States and Brazil dominate ethanol use, supported by long-term blending mandates and strong agricultural supply chains. Brazil’s system is particularly integrated, where ethanol can represent a significant share of fuel demand depending on sugarcane output.

Europe has historically led biodiesel adoption, but renewable diesel (HVO) is growing faster due to better performance and full compatibility with existing engines.

However, road transport is increasingly electrifying, which is expected to limit long-term biofuel growth in this segment.

Aviation: The Fastest-Growing Demand Segment

Aviation is becoming the most important growth market for advanced biofuels, especially sustainable aviation fuel. Unlike road transport, aviation has no near-term electrification option due to energy density constraints.

Today, SAF production remains small compared to global jet fuel demand but is growing quickly through policy support and airline commitments in Europe, the U.S., and Asia.

SAF supply forecast 2030

However, it remains expensive and limited by feedstock supply, making it a premium decarbonization fuel rather than a mass-market product.

Maritime Shipping: Early but Growing Adoption

Shipping contributes about 3% of global emissions, according to the International Maritime Organization (IMO). While the sector is harder to decarbonize, it is exploring multiple fuel options.

Biofuels such as biodiesel and renewable diesel are being tested as transitional fuels because they can be used in existing engines. However, adoption is uneven due to cost differences and a lack of fuel standardization.

As global emissions regulations tighten, biofuels are expected to play a growing compliance role, even if they are not the long-term solution.

Industrial Heat and Power

Biofuels are also used in industrial heat and power generation, especially in regions with abundant agricultural or forestry waste. Biogas and biomass fuels are used to replace coal and natural gas in thermal processes.

Although this is a smaller market, it is important in local decarbonization strategies. In parts of Europe, biomethane is also injected into natural gas grids, reducing fossil fuel use without changing end-use systems.

Market Shift: From Volume to Value

A key trend in biofuels is a shift from high-volume fuels like ethanol toward high-value fuels like SAF and renewable diesel. This shift is driven by:

  • Road transport electrification reducing long-term demand.
  • A higher willingness to pay in aviation and shipping.
  • Policy focuses on lifecycle emissions rather than volume.

As a result, future growth will rely less on total fuel volume. Instead, it will focus on how we allocate limited sustainable feedstocks for the greatest climate impact.

8. Global Policy and Regulatory Landscape for Biofuels

Biofuels are one of the most policy-driven energy markets. Unlike technologies that scale mainly through cost reductions, biofuels depend heavily on regulation, mandates, and subsidies.

In most regions, demand is not driven purely by market pricing but by government requirements and carbon accounting systems. This makes policy the central force shaping biofuel growth, with very different approaches across regions.

United States: Renewable Fuel Standard (RFS)

The United States has one of the biggest biofuel markets because of the Renewable Fuel Standard (RFS). The RFS requires fuel suppliers to mix renewable fuels into the national fuel supply.

Under this system, companies must meet annual Renewable Volume Obligations (RVOs), creating guaranteed demand for ethanol, biodiesel, and advanced biofuels. This has supported both domestic production and agricultural feedstock markets.

According to the U.S. Energy Information Administration, ethanol dominates U.S. biofuel consumption by volume. However, renewable diesel and biodiesel are growing faster, supported by stricter low-carbon fuel policies at the state level, especially in California.
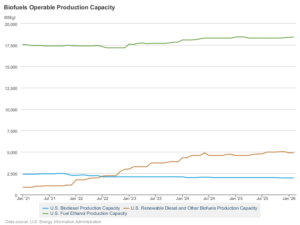
US biofuel production by type
Source: EIA

This shows a split system. Federal rules set the basic demand while state policies boost growth for higher-value, low-carbon fuels.

Brazil: Integrated Ethanol System

Brazil has one of the most developed biofuel systems globally, built around sugarcane ethanol and flexible-fuel vehicle (FFV) technology.

Since 2003, FFVs have become dominant in the country, representing roughly 98% of new car sales and about 90% of the light-duty fleet. These vehicles can run on gasoline, pure ethanol, or any blend of the two, allowing ethanol to directly compete with gasoline at the pump, depending on fuel prices and supply conditions.

Brazil also maintains one of the world’s highest gasoline ethanol blending mandates at roughly 27%, reinforcing ethanol’s central role in the national transport fuel system.

Key strengths of this system include:

  • high sugarcane productivity per hectare,
  • strong lifecycle emissions performance, and
  • long-term policy stability.

Brazil’s model is widely viewed as one of the most effective large-scale ethanol systems, although its expansion is still tied to land availability and agricultural output.

European Union: Strict Sustainability Rules

The European Union has one of the most advanced regulatory systems for biofuels under the Renewable Energy Directive (RED III). Its policy is shifting away from crop-based fuels toward advanced and waste-based biofuels due to concerns over land use and indirect emissions.

Key features of RED III include:

  • binding renewable energy targets for transport,
  • limits on high-risk feedstocks linked to deforestation, and
  • strict lifecycle emissions accounting.

The EU is also moving from volume-based mandates to carbon-intensity regulation, where fuels are assessed based on total lifecycle emissions rather than renewable content alone.

Asia-Pacific: Energy Security Driven Policies

In Asia, biofuel policy is largely driven by energy security and import reduction goals.

China has introduced ethanol blending pilots in selected regions, mainly to reduce oil imports and manage crop surpluses, though rollout remains gradual.

India has taken a more aggressive approach, setting national ethanol blending targets to reduce crude oil dependence and support rural incomes.

Southeast Asia, particularly Indonesia and Malaysia, focuses heavily on biodiesel blending due to strong palm oil production. However, these programs face international pressure over deforestation concerns, leading to stronger sustainability certification systems.

9. Carbon Markets and Fuel Standards

Beyond mandates, carbon pricing systems are becoming increasingly important for biofuels.

The most influential example is California’s Low Carbon Fuel Standard (LCFS), which assigns carbon intensity scores to fuels. Low-emission fuels generate tradable carbon credits, improving project economics. This links biofuels directly to carbon markets, rewarding emissions reductions rather than fuel volume.

Similar systems are expanding in Canada and Europe, signaling a shift toward performance-based fuel regulation focused on lifecycle carbon intensity.

Across all regions, biofuel policy is shifting from volume-based blending mandates to carbon-based performance systems. Instead of simply requiring renewable fuel use, newer frameworks focus on:

  • lifecycle emissions,
  • feedstock sustainability, and
  • carbon intensity reduction.

This is reshaping the industry toward:

  • waste-based feedstocks,
  • advanced conversion technologies, and
  • high-value fuels like SAF and renewable diesel.

In effect, success in biofuels is no longer measured by production volume alone, but by verified emissions reductions per unit of fuel.

10. Global Biofuel Market Size, Key Players, and Economic Trends

The global biofuels market has grown from a niche renewable segment into a large industrial system embedded in transport fuel supply chains. Global biofuel demand is now about 170 billion liters each year. This growth is mainly from ethanol and biodiesel used in road transport, according to the IEA.

Likewise, global biofuel production increased 7x in the last two decades, as shown below.
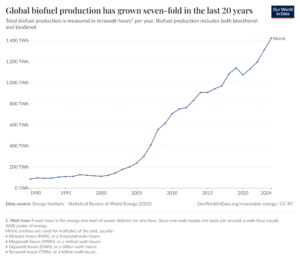
global-biofuel-production-has-grown-seven-fold-in-the-last-20-years

The market is valued at over $150 billion. Estimates vary based on policy support, feedstock supply, and how quickly advanced fuels are adopted. Growth is now focused more on higher-value segments. This includes renewable diesel and sustainable aviation fuel (SAF), instead of traditional blending fuels.

Despite this scale, the industry is large, but it stays regional and fragmented. It relies heavily on local feedstocks and policies.

Key Industry Players: A Hybrid Value Chain

The biofuels industry sits at the intersection of agriculture, energy, and chemicals, meaning its players span multiple sectors.

Agribusiness and Feedstock Leaders

Agribusiness companies play a central upstream role, supplying feedstocks such as corn, sugarcane, and vegetable oils. Globally, corn ethanol and sugarcane ethanol still dominate the liquid biofuel supply. Ethanol alone accounts for the majority of biofuel production by volume.

Key players in this segment include:

  • Archer Daniels Midland Company โ€” one of the world’s largest corn processors and a major ethanol producer in North America.
  • Cargill โ€” a global agribusiness leader supplying oilseeds and biofuel feedstocks.
  • POET LLC โ€” one of the largest bioethanol producers in the United States.
  • Raรญzen โ€” a major producer of sugarcane ethanol and one of the largest bioenergy firms globally.

In Brazil, integrated sugarcane systems led by companies like Raรญzen are central to ethanol supply, supported by long-established agricultural infrastructure.

Energy Majors and Refining Conversions

Energy majors are increasingly active in renewable diesel and sustainable aviation fuel (SAF). These firms are repurposing existing refinery infrastructure into hydroprocessing units rather than building entirely new refining systems, a key advantage in scaling drop-in fuels.

Major participants include:

  • Neste โ€” the world’s largest producer of renewable diesel and SAF.
  • Chevron โ€” expanding renewable diesel production in North America.
  • Valero Energy Corporation โ€” a major producer of renewable diesel through its joint ventures.
  • TotalEnergies โ€” investing heavily in SAF and renewable fuels across Europe.
  • BP โ€” developing biofuels alongside broader low-carbon energy transition strategies.

These companies are leveraging refinery conversion strategies, particularly in the United States and Europe, where existing infrastructure can be adapted for renewable feedstocks such as used cooking oil and animal fats.

Advanced Biofuel and Clean-Tech Producers

Specialized biofuel producers and clean-tech firms are expanding in advanced segments such as SAF and waste-based fuels. These companies focus on technologies like hydroprocessed esters and fatty acids (HEFA), gasification-to-liquids, and alcohol-to-jet conversion.

Notable players include:

  • LanzaJet โ€” focused on alcohol-to-jet SAF technology.
  • Gevo โ€” developing low-carbon fuels and SAF from renewable feedstocks.
  • Aemetis โ€” producing renewable fuels and developing SAF projects.
  • World Energy โ€” one of the earliest commercial SAF producers in the United States.

These firms are critical in pushing innovation beyond first-generation biofuels, particularly into aviation and waste-based pathways where scalability remains constrained but strategic importance is high.

Structural Outcome: A Multi-Layer Value Chain

This creates a hybrid industrial structure where agriculture, refining, and technology firms operate across different stages of the same value chain.

Unlike conventional fossil fuel markets, value creation is distributed across:

  • upstream agribusiness feedstock supply,
  • midstream refining and conversion infrastructure, and
  • downstream fuel distribution and policy-driven markets.

The result is a fragmented but increasingly interconnected ecosystem, where partnerships between agribusiness firms, energy majors, and clean-tech developers are becoming essential for scaling next-generation biofuels.

Cost Structure and Economic Drivers

A defining feature of biofuels is their cost structure. Unlike fossil fuels, where production is relatively standardized, biofuel economics are highly sensitive to feedstock pricing and logistics.

Across most commercial pathways, feedstocks represent the largest share of total production cost, commonly estimated at ~50% to 90% of total cost in biodiesel and renewable diesel systems, depending on input type and market conditions.

This creates strong exposure to agricultural commodity cycles. Rising prices for vegetable oils or crops like corn can quickly compress margins, while periods of oversupply improve competitiveness.

Waste-based feedstocks such as used cooking oil and animal fats improve lifecycle emissions performance and policy eligibility, but they are structurally constrained in supply, limiting scalability.

Advanced fuels like SAF remain significantly more expensive than conventional jet fuel. Industry estimates typically place SAF at 2ร— to 5ร— the cost of fossil jet fuel, depending on feedstock type and production pathway.
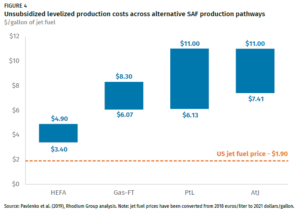
SAF production cost vs jet fossil fuel
Source: Rhodium Group

The IATA estimates that SAF could contribute a large share of aviation decarbonizationโ€”up to ~65% of required emissions reductions for net-zero aviation pathways, but only if costs fall and supply scales significantly.

As a result, the industry depends heavily on policy support, including:

  • blending mandates,
  • tax credits and production incentives, and
  • carbon pricing systems.

Investment Trends and Capital Flows

Investment in biofuels is increasingly focused on renewable diesel and sustainable aviation fuel (SAF). These fuels benefit from stronger policy support and higher value markets than ethanol and biodiesel. According to the IEA, global biofuel demand could grow by about 20% between 2023 and 2028, with most growth coming from advanced fuels.

Renewable diesel has grown quickly in North America and Europe. Much of this growth comes from refinery conversions, which are cheaper than building new plants.

In the United States, renewable diesel capacity has reached over 6 billion gallons per year (about 23โ€“25 billion litres) in the mid-2020s. Growth is supported by policies like the Renewable Fuel Standard and California’s Low Carbon Fuel Standard.

SAF is still very small today. The International Air Transport Association estimates it made up less than 0.2% of global jet fuel use in 2023. But it is becoming the main long-term focus for investment.

SAF market 2034

There are now more than 100 SAF projects announced around the world. Many airlines and energy firms are signing long-term supply contracts. These contracts often run for 10 to 20 years. This helps reduce investment risk.

Policy support is also growing. The EU ReFuelEU Aviation rule requires SAF blending to start at 2% in 2025, rising to 70% by 2050. In the United States, the Inflation Reduction Act provides SAF tax credits of up to $1.75 per gallon, depending on carbon intensity.

These policies are helping shift investment toward low-carbon fuels instead of traditional biofuels. Overall, capital flows are shifting away from commodity ethanol/biodiesel expansion toward specialized, high-margin, policy-backed fuels.
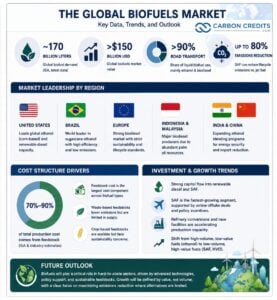
global biofuels market at a glance

11. Future Outlook: Where Biofuels Are Headed

The future of biofuels is defined less by whether demand will grow and more by where that demand will concentrate. In most net-zero pathways modeled by the International Energy Agency, biofuels remain a critical but targeted solution, not a universal substitute for fossil fuels.

Across these scenarios, global biofuel demand rises meaningfully toward mid-century, but growth is uneven across sectors.

Road transport currently accounts for the majority of consumption but is expected to grow more slowly over time due to accelerating electrification, particularly in passenger vehicles. In contrast, aviation and maritime shipping become the dominant long-term growth drivers because they are significantly harder to electrify.

Demand Growth Will Be Uneven Across Sectors

While total biofuel production is projected to expand under net-zero scenarios, demand is increasingly concentrated in specific sectors.

  • Road transport: mature market with slowing growth
  • Aviation: fastest-growing demand segment
  • Shipping: emerging structural demand driver

The IEA highlights that sustainable biofuel supply must scale significantly by 2030 to remain aligned with net-zero pathways, particularly for sectors where electrification is limited.

Sustainable Aviation Fuel: The Core Growth Engine

Among all biofuel segments, SAF is expected to dominate long-term growth.

Aviation contributes roughly 2โ€“3% of global COโ‚‚ emissions, but its decarbonization is disproportionately difficult due to energy density requirements. This makes SAF one of the few viable near-term solutions. However, current SAF production remains extremely limitedโ€”still well below 1% of global jet fuel supply.

Key constraints include:

  • limited sustainable feedstock availability,
  • production costs that remain 2โ€“5ร— higher than conventional jet fuel, and
  • early-stage global refining capacity.

As a result, SAF expansion depends heavily on:

  • policy mandates (blending requirements),
  • subsidies and tax incentives, and
  • long-term airline offtake agreements.

Feedstock Constraints Will Define Scaling Limits

A structural constraint across the entire biofuels industry is feedstock availability. Unlike wind or solar energy, biofuels are fundamentally limited by biomass supply chains.

Sustainable feedstocksโ€”such as used cooking oil, agricultural residues, and forestry byproductsโ€”are widely considered the lowest-carbon inputs due to lifecycle emissions advantages. However, their availability is inherently finite.

This creates a long-term structural tension between scaling production to meet decarbonization targets and maintaining strict sustainability and land-use standards.

As demand increases, competition for these feedstocks is expected to intensify, potentially increasing prices and forcing focus toward:

  • aviation (highest-value use case)
  • shipping and heavy industry
  • compliance-driven blending markets

Technology Shift Toward Advanced Biofuels

The technological direction of the industry is clearly moving toward advanced biofuel pathways.

First-generation fuels such as corn ethanol and conventional biodiesel are expected to grow more slowly over time due to sustainability concerns, land constraints, and competition with food systems.

In contrast, advanced fuels could expand their share of supply. Key technologies include:

  • hydrotreated renewable diesel,
  • alcohol-to-jet (ATJ) conversion,
  • biomass gasification and Fischer-Tropsch synthesis, and
  • cellulosic ethanol from non-food feedstocks.

These pathways improve lifecycle emissions performance and expand feedstock flexibility, but they are also more capital-intensive and complex. As a result, their growth depends heavily on sustained policy support and infrastructure investment.

Policy Will Remain the Key Scaling Driver

Across all scenarios, one conclusion is consistent: biofuels remain policy-dependent.

Unlike fossil fuels, they do not scale purely through market pricing. Instead, growth is driven by a mix of:

  • blending mandates,
  • carbon intensity regulations,
  • tax credits and subsidies,
  • carbon credit systems, and
  • corporate procurement agreements.

A clear shift is also underway from volume-based mandates to carbon-performance frameworks, where fuels are evaluated based on lifecycle emissions rather than renewable content alone.

This transition strongly favors advanced and waste-based fuels while placing increasing pressure on higher-emission first-generation pathways.

12. Conclusion: The Strategic Role of Biofuels in Net Zero Pathways

Biofuels play a targeted but important role in the global energy transition. They are not a full replacement for fossil fuels, but a sector-specific solution for hard-to-electrify areas such as aviation, shipping, and heavy-duty transport.

Their main advantage is compatibility with existing fuel infrastructure, allowing emissions reductions without major system replacement. However, growth is limited by feedstock availability, land-use pressures, and variable lifecycle emissions.

Future expansion is shifting from crop-based fuels toward advanced and waste-based options like sustainable aviation fuel and renewable diesel. Policy is also evolving from volume mandates to carbon-intensity standards. Overall, biofuels will remain a bridging technology within a broader low-carbon energy system.

BHP Delivers Record Iron Ore Output While Boosting Copper for the Clean Energy Transition

BHP finished fiscal year 2026 with strong results. It reported record iron ore production and nearly 2 million tonnes of copper. This success came despite inflation, higher fuel costs, and supply chain issues. These results enhance BHP’s position as a top supplier of metals for steelmaking, electrification, and clean energy.

The company also advanced major growth projects in Chile, Argentina, Australia, Canada, and the United States. They aim to expand their copper business and add new commodities like potash to their portfolio.

Record Iron Ore Production Boosts Performance

The latest report states that BHP produced a record 265 million tonnes of iron ore in FY2026. This was a 1% increase from the previous year. Its Western Australia Iron Ore (WAIO) operations hit their highest production levels. Strong mining performance, better rail operations, and record shipments supported this achievement.

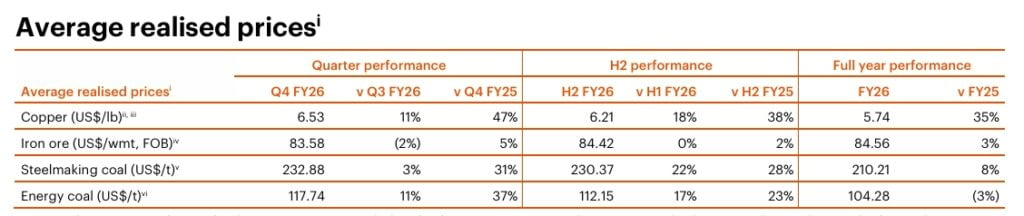
Average iron ore prices also rose to US$84.56 per wet metric tonne, helping to offset higher operating costs.

  • The company expects strong iron ore production in FY2027, forecasting output between 260 million and 272 million tonnes.

BHP is investing in future production by approving the US$900 million Ministers North project in Western Australia. This project is expected to add around 20 million tonnes per year once fully operational, with first ore expected in FY2029.

Iron ore remains BHP’s biggest earnings contributor. Although demand from China’s property sector has slowed, infrastructure investment and steel production continue to support long-term consumption.

Copper Production Stays Near Historic High

Copper has also been a bright spot for BHP.

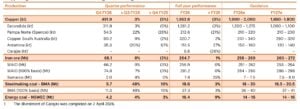
The miner produced 1.953 million tonnes of copper in FY2026, marking its second straight year near 2 million tonnes. Production fell a bit from FY2025 because of lower ore grades at Escondida. However, operational improvements kept output strong.

  • Escondida, the world’s largest copper mine, delivered 1.261 million tonnes despite processing lower-grade ore. Record material mined, higher concentrator throughput, and better recovery rates offset the decline.

  • Copper South Australia also performed well, with production up 2% to 321,000 tonnes. Olympic Dam achieved its highest copper production in 20 years, while Carrapateena and Prominent Hill showed strong mining performance.

However, not all operations performed equally.

Production at Spence fell due to more complex ore and lower feed grades. BHP has approved two new projects to improve recoveries and handle more challenging ore, both expected to start production in 2028.

  • For FY2027, the company expects copper production to range between 1.65 million and 1.80 million tonnes. This is mainly because Escondida will continue mining lower-grade ore.

bhp copper
Source: BHP

Why Copper Matters More Than Ever

Copper demand is expected to rise steadily over the coming decades.

The metal is essential for electric vehicles, renewable energy projects, power grids, batteries, and rapidly expanding AI data centers. Electric vehicles require significantly more copper than conventional cars, while wind farms, solar installations, and electricity networks also consume large volumes of the metal.

The International Energy Agency (IEA) estimates that achieving global clean energy goals will require substantial growth in copper supply over the next two decades.

At the same time, developing new copper mines has become increasingly difficult because of permitting delays, declining ore grades, and higher construction costs. That supply challenge is supporting higher long-term copper prices.

  • During FY2026, BHP benefited from this trend, with its average realized copper price increasing about 35% year over year to US$5.74 per pound.
COPPER PRICES
Source: BHP

Expanding Copper Projects Around the World

Beyond current production, BHP continued investing heavily in future growth.

In Chile, the company submitted an Environmental Impact Assessment to restart the Cerro Colorado mine and potentially extend its operating life by another 20 years.

In Argentina, the Vicuรฑa project received approval under the country’s Large Investment Incentive Regime (RIGI). The approval provides the project with long-term fiscal stability for 4 decades and keeps it on track for a final investment decision in 2026.

BHP is also expanding its footprint in the United States.

The company increased its investment in Faraday to help develop a new copper hub in Arizona, combining existing infrastructure with the Copper Creek project. It also continues advancing the Resolution and Globe-Miami projects, strengthening its long-term position in North American copper production.

These projects could become increasingly important as governments seek secure domestic supplies of critical minerals.

Potash Adds Another Growth Engine

While copper and iron ore remain the company’s biggest businesses, BHP is preparing to enter another important commodity market.

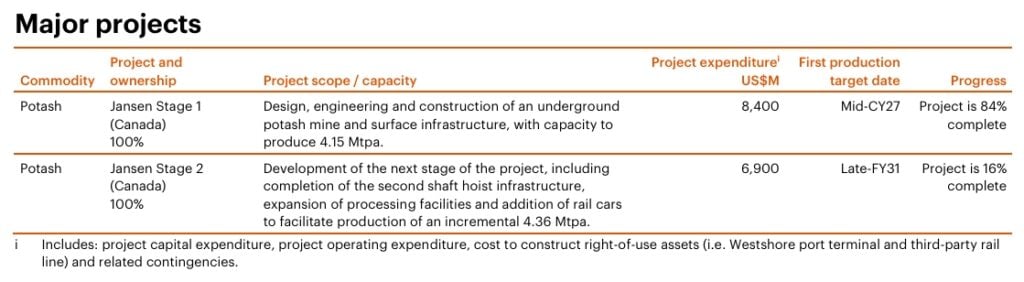
Its Jansen project in Canada remains on schedule to begin potash production next year. Potash is a key fertilizer ingredient used to improve crop yields and support global food production.

Adding potash further diversifies BHP’s revenue sources while reducing dependence on iron ore and copper. The investment also aligns with long-term trends including population growth, rising food demand, and global food security.

BHP POTASH
Source: BHP

Cost Control Remains a Key Strength

Mining companies worldwide continue facing rising labor costs, inflation, expensive diesel fuel, and equipment shortages. Despite these pressures, BHP said nearly all of its operations are expected to finish within their cost guidance ranges.

The company credited disciplined operational management, productivity improvements, and higher by-product credits for keeping costs under control.

Maintaining low production costs is particularly important during periods of commodity price volatility, helping protect profits even if metal prices weaken.

BHP’s Climate Goals Stay on Track

BHP also reported progress toward its climate commitments.

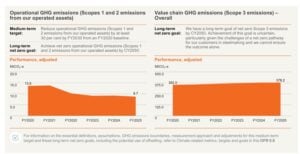
The company says it remains on track to reduce operational greenhouse gas emissions by at least 30% by FY2030 compared with its FY2020 baseline. Importantly, it said these reductions are being achieved without relying on carbon credits or offsets.

  • According to the report, operational emissions fell to 8.7 million tonnes of COโ‚‚ equivalent in FY2025, about 5% lower than the previous year. The reduction was mainly driven by renewable power agreements and the temporary suspension of Western Australia Nickel operations.
  • But Scope 3 emissions inventory increased by 0.1 %
bhp emissions
Source: BHP

Looking ahead, the miner plans to further reduce emissions by electrifying mining equipment, increasing renewable electricity use, and deploying technologies to cut methane emissions from its operations.

For instance: it advanced trials of two Catยฎ 793 XE battery-electric haul trucks at its Western Australia Iron Ore (WAIO) operations. The project, conducted with Rio Tinto and Caterpillar, marks an industry-first collaboration to help reduce greenhouse gas emissions from large-scale mining.

Outlook

BHP enters FY2027 with strong momentum. Record iron ore production, resilient copper output, disciplined cost management, and a growing pipeline of major projects position the miner to benefit from long-term demand for critical minerals.

While lower ore grades will likely reduce copper production next year, the company’s expanding portfolio across copper, iron ore, and potash provides multiple avenues for future growth.

As countries invest in clean energy, electrification, artificial intelligence infrastructure, and food security, demand for the commodities BHP produces is expected to remain strong. By continuing to expand production while keeping costs under control and advancing lower-emission operations, the company is positioning itself to play a central role in supplying the materials needed for the global economy’s next phase of growth.

EU Unveils Biggest Carbon Market Overhaul Yet to Keep Industry Competitive and Net Zero on Track

The European Union has proposed its biggest carbon market overhaul in years. The European Commission wants to keep the EU Emissions Trading System (EU ETS) at the center of Europe’s climate strategy while giving heavy industry more time and support to cut emissions.

The proposal is part of the EU’s plan to reduce net greenhouse gas emissions by 90% by 2040 and reach climate neutrality by 2050. If approved, the reforms would reshape how Europe prices carbon, funds industrial decarbonization, and supports new technologies such as permanent carbon removals.

Ursula von der Leyen, President of the EC remarket:

“The best way to reduce Europe’s fossil energy dependency is to power our economy with electricity from clean, homegrown sources. Today, we are proposing to make Europe the world’s first electro-powered continent. From lowering electricity prices to adapting our carbon market to the changing global realities, this is also an investment and independence plan. To keep the clean transition on track, bring relief to our industry, and support decarbonisation. Let’s switch it on.”

Europe Slows Carbon Cuts to Protect Industry

The biggest change is a slower reduction in the number of carbon allowances after 2030. The Commission proposes a new Linear Reduction Factor (LRF) of:

  • 3.7% per year from 2031 to 2035
  • 1.7% per year from 2036 to 2040

This is a more gradual path than the current trajectory. Brussels says the change will reduce pressure on industry while still keeping the EU on track for its 2040 climate goal.

The proposal recognizes that cutting emissions becomes harder as the easiest reductions are already made.

Heavy Industry Gets More Time to Decarbonize

The review also extends support for energy-intensive industries. Free carbon allowances for sectors such as steel, cement, and chemicals would continue beyond 2030, with the phase-out slowed until 2038 for sectors covered by the Carbon Border Adjustment Mechanism (CBAM).

However, companies will not receive these permits automatically. Most free allowances will be linked to real decarbonization investments in Europe.

The Commission says the principle is simple: money paid by industry into the ETS should help industry invest in cleaner production.

  • A separate proposal would increase free allocation worth about โ‚ฌ6 billion between 2026 and 2030.

EU ETS review July 2026

A New โ‚ฌ100 Billion Investment Engine

The review puts much more emphasis on investment. The Commission plans to create a โ‚ฌ100 billion Industrial Decarbonisation Bank to help fund clean industrial projects across Europe.

Before 2030, the first phase of this bank will be the ETS Investment Booster.

The EU ETS Innovation Fund will continue supporting first commercial deployments of technologies such as hydrogen, carbon capture, batteries, and other clean industrial solutions.

The Modernisation Fund will keep helping lower-income EU countries upgrade energy systems and industry.

Member states would also be required to spend at least 50% of their ETS revenues on investments that reduce emissions in ETS-covered sectors.

Together, the Commission says these measures could mobilize more than โ‚ฌ100 billion in decarbonization investment before 2030.

Europe’s Carbon Market Reaches More Sectors

The proposal also broadens the scope of the carbon market. The ETS would be strengthened for aviation and maritime transport and extended to municipal waste incineration.

The Commission says this will reduce loopholes, create a more level playing field, and align the EU system with international climate rules.

  • The EU ETS already covers about 40% of the bloc’s greenhouse gas emissions.

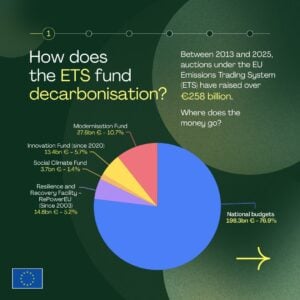
According to the Commission, emissions from ETS-covered sectors have fallen by around 50% since 2005, while the system has generated more than โ‚ฌ260 billion in auction revenue since 2013.

EU ETS revenue 2025
Source: EC

That track record is one reason Brussels still sees carbon pricing as a core climate tool.

Carbon Removals Make a Historic Entry

One of the most important changes is the planned integration of permanent carbon removals into the EU ETS. The proposal would allow these removals to provide additional flexibility for sectors that are hardest to decarbonize.

The Commission says this will also help scale up carbon removal technologies across Europe. Potential beneficiaries could include:

  • Direct Air Capture (DAC),
  • Biochar,
  • Bioenergy with carbon capture and storage (BECCS), and
  • Mineralization projects.

This is significant because the EU ETS has historically focused on emissions reductions, not carbon removals. The change could create a new long-term demand source for high-quality removal credits.

Ben Rubin, Co-Founder and Executive Director of The Carbon Business Council, remarked on this:

โ€œToday’s decision recognises something that science has long made clear: deep emissions reductions and carbon removal solutions are both needed to reach net zero. Residual emissions from hard-to-abate industries such as steel, cement, and chemicals require a durable, high-integrity solution, and the ETS now provides the start of a credible pathway to deliver one… A level playing field across carbon removal pathways will spur innovation, accelerate deployment, and ensure the ETS builds on the method-neutral foundations established through the CRCF framework.”

International Carbon Credits Return Under Strict Limits

The proposal also reopens the door to international carbon credits. From 2036 to 2040, companies could use up to 2% high-quality international credits.

The Commission says these credits would help finance decarbonization projects abroad while providing flexibility during a period when emissions reductions in Europe become more difficult.

The credits would be tightly limited and subject to quality rules. Even so, the move is important because the EU largely phased out international offsets from its carbon market years ago.

For global carbon markets, it signals that carefully controlled international credits may again play a role in European climate policy.

Brussels Wants More Stable Carbon Prices

The review also targets carbon price volatility. The Commission proposes reforms to the Market Stability Reserve (MSR) to improve liquidity, strengthen predictability for investors, and reduce excessive price swings.

This comes after recent debates about how carbon prices affect industrial competitiveness and energy costs.

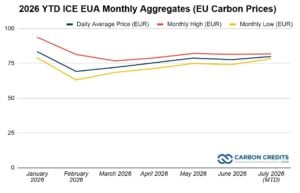
EU carbon prices remain among the highest in the world. According to ICE data, benchmark EU Allowance (EUA) futures traded around โ‚ฌ80โ€“82 per tonne in July.

EU carbon prices futures from ICE

Analysts expect future prices to remain sensitive to policy changes, economic growth, and the balance between permit supply and demand.

Electrification Takes Center Stage in Europe’s Climate Plan

Alongside the ETS review, the Commission released a new Electrification Action Plan. The plan argues that many low-carbon technologies already save consumers money:

  • Driving a battery-electric vehicle can cost up to 78% less than driving a comparable fossil-fuel vehicle.
  • Replacing a gas boiler with a heat pump can cut heating bills by up to 60% on average across the EU.

The Commission says adoption remains too slow because electricity is often taxed more heavily than gas, grid connections can take years, and upfront costs are high.

The plan would allow countries to reduce certain electricity taxes and network charges, expand smart meter deployment, support heat pumps and electric vehicles, and accelerate grid upgrades.

The goal is to make electricity cheaper relative to fossil fuels.

A New Phase for the World’s Largest Carbon Market

With all these new proposals in place, the EU ETS is no longer just a pollution-pricing system. The latest review turns it into a broader investment and industrial policy tool. It combines:

  • a slower emissions cap decline,
  • continued free allocation,
  • carbon removal integration,
  • limited international credits,
  • a stronger Market Stability Reserve,
  • and more than โ‚ฌ100 billion of planned decarbonization investment.

The proposals still need approval from the European Parliament and EU member states, so details could change. Even so, the review marks a major shift.

Europe is trying to prove that it can keep one of the world’s most ambitious climate targets while protecting industry, supporting new clean technologies, and maintaining a stable carbon market.

The outcome will influence not only Europe but also the future direction of carbon pricing and carbon removal markets worldwide.

Constellation Backs Texas-based Blue Energy to Speed Up SMR Deployment in the U.S.

The push for new nuclear power plants in the U.S. is accelerating. Electricity demand is rising due to artificial intelligence (AI), data centers, and industrial electrification. Recently, Blue Energy received a strategic investment from Constellation Technology Ventures, the venture capital branch of Constellation Energy (NASDAQ: CEG).

This investment highlights increased support for small modular reactors (SMRs) as the U.S. seeks reliable, carbon-free electricity that can be deployed faster than traditional nuclear plants.

Blue Energy’s Nuclear Model Focuses on Speed, Scale, and Lower Risk

Blue Energy, a startup focused on prefabricated nuclear power plants, announced that Constellation Technology Ventures has invested to enhance its innovative nuclear deployment model.

While financial terms remain undisclosed, this marks Constellation Technology Ventures’ first investment in a U.S.-based SMR developer.

Blue Energy plans to deploy the GE Vernova Hitachi BWRX-300, one of the most advanced SMR designs. Instead of building plants mostly on-site, often leading to delays, the company will manufacture large sections in shipyards using robotic fabrication before transporting them for final assembly.

The BWRX-300 can generate about 300 MW of carbon-free electricityโ€”enough for hundreds of thousands of homes. This design builds on decades of experience with boiling water reactors, adding passive safety systems and simpler construction.

This approach aims to reduce construction risks, shorten project timelines, and attract traditional infrastructure investors.

BWRX-300
Source: gevernova.com

Jake Jurewicz, Blue Energy’s CEO, noted that rising electricity demand requires a new nuclear development approach. He believes partnering with Constellation combines proven reactor technology with an experienced operator and introduces financing models that make nuclear projects more predictable and scalable.

David Dardis, Constellation’s Senior Executive Vice President, stated that the investment shows their commitment to innovating ways to speed up advanced nuclear deployment while managing project risks.

Constellation Sees Opportunity

Constellation is the largest producer of carbon-free energy in the U.S. It operates the biggest fleet of nuclear power plants in the country.

The company owns 21 nuclear reactors across 12 stations, providing about 22 gigawatts (GW) of capacity. These reactors power millions of homes and help avoid tens of millions of metric tons of carbon emissions each year.

Nuclear plants run almost continuously, offering reliable baseload electricity that complements intermittent sources like wind and solar.

Constellation believes expanding nuclear generation is crucial as electricity demand grows. The company reports that demand is rising at its fastest rate in decades, driven mainly by AI data centers and electrification in various industries.

The investment in Blue Energy supports technologies that could bring new nuclear capacity online much faster than traditional projects.

Why Small Modular Reactors Matter

SMRs are a key focus of U.S. energy policy. They offer many benefits of conventional nuclear power while lowering financial and construction risks.

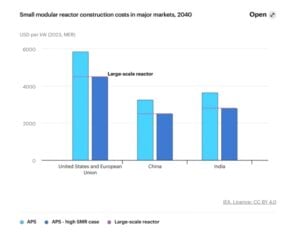
Unlike traditional reactors that generate over 1,000 megawatts (MW), SMRs typically produce up to 300 MW each. Multiple modules can combine to meet larger power needs. Furthermore, experts believe factory-built components could significantly cut project costs and timelines compared to traditional nuclear plants.

SMRs
Source: IEA

Thus, SMRs are increasingly seen as a solution to meet energy needs.

Financing Nuclear Like Infrastructure

One of Blue Energy’s key goals is to tackle a long-standing issue in the nuclear sector: financing. Traditional nuclear projects often need billions upfront and take over a decade to finish. This makes investors wary due to delays and cost overruns.

Blue Energy aims to change this by merging standardized reactor technology with modular manufacturing and financing structures common in offshore energy and infrastructure projects.

Large sections of each plant will be made in controlled shipyards using robotic manufacturing before being sent to project sites for assembly. The company argues that standardization can improve cost certainty, reduce risks, and help lenders finance projects like conventional infrastructure assets.

If successful, this approach could speed up deployment and lower financing costs for future nuclear projects.

Building on Earlier Momentum

The Constellation investment follows several key milestones for Blue Energy in 2026.

Earlier this year, the company raised $380 million and teamed up with GE Vernova to develop multi-gigawatt gas-to-nuclear projects. This hybrid strategy lets developers generate electricity with natural gas while preparing sites for nuclear generation, meeting immediate power needs without waiting for full reactor construction.

Blue Energy also reached an important U.S. Nuclear Regulatory Commission licensing milestone, supporting its goal of delivering nuclear power in 48 months or less under its phased deployment model.

  • The company plans to start early site work for its first Texas project in 2026, aiming for a final investment decision in 2027.

Rising Demand Creates New Opportunities

Interest in SMRs is growing as the U.S. faces its strongest electricity demand in years.

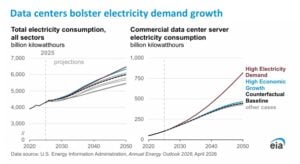
The U.S. Department of Energy says data centers might use 12% of total U.S. electricity by 2028. To be more precise, the EIA projects that data center server electricity consumption alone could reach 818 billion kilowatt-hours by 2050 under its High Electricity Demand case.

data center electricity demand
Source: EIA

And this rise is mainly due to AI infrastructure. Utilities and tech firms are looking for steady, carbon-free power sources to meet this demand.

  • The White House aims to expand U.S. nuclear capacity to 400 GW by 2050, while supporting 5 GW of new nuclear generation and reactor uprates by 2030.
  • Additionally, it offers tax incentives, loan programs, and licensing reforms. These efforts aim to cut development timelines.

These initiatives, along with private investment from major energy firms like Constellation, show that advanced nuclear is entering a new phase of commercialization.

Blue Energy’s partnership with the country’s largest nuclear operator brings validation and expertise. This helps them commercialize a model that makes nuclear power faster to build, easier to finance, and better for meeting America’s rising electricity demands.

Philippines Launches World’s Largest Solar-Plus-Battery Project in Historic Clean Energy Leap

The Philippines has reached a major clean energy milestone. President Ferdinand Marcos Jr. recently inaugurated the first phase of the MTerra Solar Project, which is set to become the world’s largest integrated solar and battery energy storage facility on a single site once fully completed.

The project comes as countries race to expand renewable energy, strengthen energy security, and cut greenhouse gas emissions. For the Philippines, it also marks one of the country’s biggest investments in clean electricity.

A Record-Breaking Renewable Energy Project

The first phase of MTerra Solar is in Nueva Ecija and Bulacan and has generated 1,373 megawatts (MW) of solar power. Additionally, it features 825 MW of battery energy storage, which holds 3,300 megawatt-hours (MWh) of capacity. It has fully energized 741 battery units. This makes it one of the largest solar and battery projects in the world.

When fully completed, the project will deliver 3,500 MWp of solar capacity backed by 4,500 MWh of battery storage. It could provide electricity to over 2.4 million Filipino homes.

  • This will help avoid about 4.3 million metric tons of carbon dioxide emissions each year, as stated by the Philippine government.

Meralco PowerGen (MGEN) and global investor Actis developed the project, which has recorded over 30 million work hours with no lost-time injuries. Following final grid tests, Phase 1 will begin supplying 600 MW of clean electricity under a long-term power agreement with Meralco.

Philippine largest solar and battery storage project launch

Why Batteries Are the Missing Piece of Clean Energy

Solar panels only generate electricity during the day. Battery storage solves that challenge by storing excess solar power for use after sunset or during periods of high electricity demand. This helps stabilize the grid and reduces the need for fossil fuel power plants.

The International Energy Agency (IEA) says battery storage is becoming one of the fastest-growing energy technologies in the world. As more countries add solar and wind power, large battery systems are becoming essential for delivering reliable electricity around the clock.

For the Philippines, this is especially important. The country has long depended on imported coal and natural gas for power generation. Large battery systems can help integrate more renewable energy while improving grid reliability and reducing fuel imports.

Supporting the Philippines’ Clean Energy Goals

The project also supports the country’s long-term climate plans.

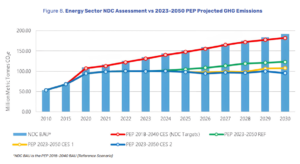
The Philippine Energy Plan targets raising renewable energy’s share in electricity generation to 35% by 2030 and 50% by 2040. Expanding large-scale solar and battery storage is expected to play a major role in reaching those targets.

PEP emissions 2050
Source: Philippine Department of Energy

At the same time, electricity demand continues to grow because of population growth, industrial expansion, and digital infrastructure. The Department of Energy (DOE) says the country will need a lot of new power sources in the next twenty years to meet growing demand.

Projects like MTerra Solar help meet that need while reducing emissions. They also improve energy security by producing more electricity from domestic renewable resources instead of imported fossil fuels.

President Marcos said at the inauguration that this project aims to produce clean electricity. It will also help create a stronger, more reliable, and resilient energy system for the Philippines. He further noted that the current energy mixโ€“

“… leaves us more vulnerable to fluctuations in global fuel prices and developments in the international market, as we have experienced in the last few months. It underscores the importance of diversifying our energy sources, and how we must be committed to moving that mix in the direction to favor renewables.”

Reducing Emissions While Strengthening Energy Security

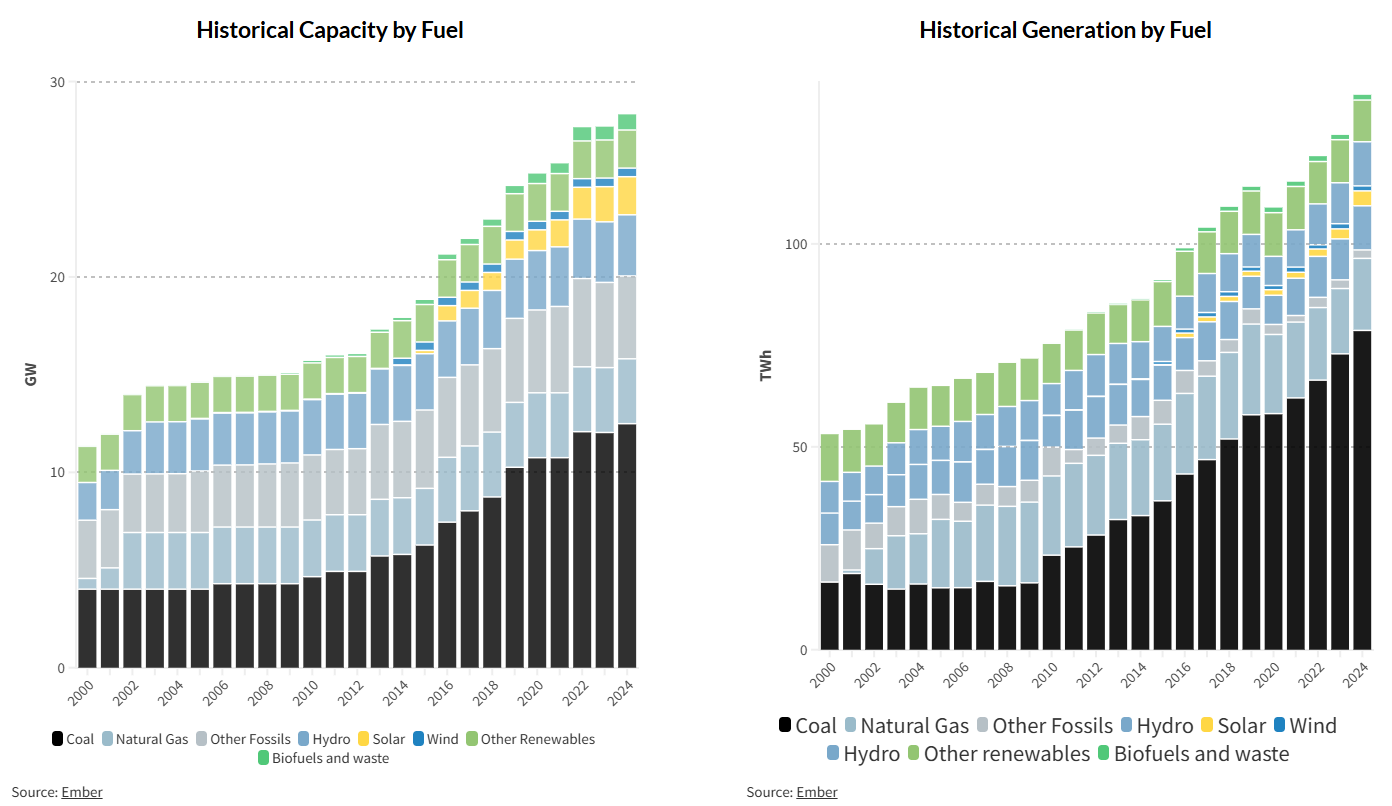
The Philippines still depends heavily on fossil fuels to keep the lights on. According to the DOE, coal supplied about 60-62% of the country’s electricity generation in 2024, making it by far the largest source of power.

historical capacity and generation by fuel philippines
Source: SIPET

Renewable energy sources like geothermal, hydropower, solar, wind, and biomass made up about 25%. Natural gas supplied most of the rest of the electricity.

This reliance on imported coal and fuel exposes the country to global price swings and supply risks. The IEA notes that many countries now prioritize cutting down on imported fossil fuels. This shift is essential as energy demand keeps increasing.

Large solar and battery projects can help change that. Solar power produces electricity without burning fuel, while battery systems store excess electricity during the day and supply it when the sun is not shining. This reduces the need for coal and natural gas during peak demand and helps stabilize the power grid.

The shift is already underway. Solar generation in the Philippines grew over 30% in 2024. This makes it one of the fastest-growing electricity sources in the country, according to Ember’s Global Electricity Review. As more projects like MTerra come online, they will help lower emissions, improve energy security, and reduce exposure to volatile fossil fuel prices.

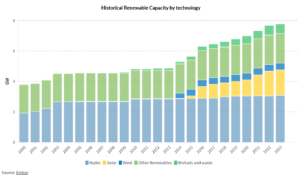
Philippine renewable energy generation
Source: SIPET

MGEN Expands Its Renewable Energy Portfolio

The MTerra Solar project is also an important step in Meralco PowerGen’s (MGEN) clean energy strategy.

The company is expanding its renewable energy portfolio while supporting the country’s transition to a lower-carbon power system. MGEN invests in solar, battery storage, and clean energy tech. This way, they can meet growing electricity demand without depending solely on fossil fuels.

The partnership with global investor Actis also shows growing international confidence in the Philippine renewable energy market. Large infrastructure investments like MTerra can attract more private capital and speed up the country’s clean energy transition.

Solar and Battery Storage Are Growing Worldwide

The Philippines is part of a much bigger global trend.

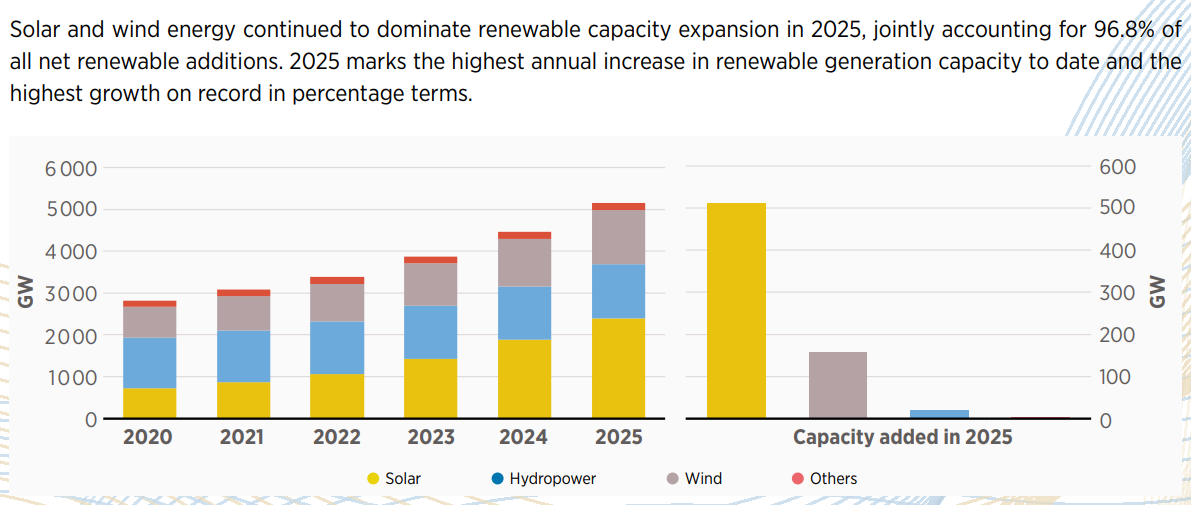
According to the International Energy Agency, renewable energy is expected to supply almost half of the world’s electricity by 2030, led by rapid growth in solar power. Solar is forecast to become the world’s largest source of installed electricity capacity before the end of this decade.

Battery storage is expanding just as quickly. The IEA reports that global battery use hit a new high in 2024. It will likely keep increasing as countries expand their solar and wind projects. Batteries help store excess renewable electricity and release it when demand is high, making clean energy more reliable.

solar and wind generation 2025 IRENA
Source: IRENA

The International Renewable Energy Agency (IRENA) also reported a record rise in global renewable energy capacity in 2025. Solar energy made up the largest part of this growth.

A Milestone for the Philippines’ Energy Future

The launch of MTerra Solar is more than breaking a world record. It shows that the Philippines can deliver utility-scale clean energy projects that match the size of the world’s biggest renewable developments.

As electricity demand grows, projects that mix solar power with battery storage will likely set the new standard for reliable, low-carbon energy.

The record-breaking project supports the country’s broader climate goals under the Paris Agreement while helping to build a more resilient power system. It alsoย offers a clear example of how renewable energy can strengthen both climate action and long-term energy security.

Elon Musk’s Quiet Energy Bet: Is APR Energy Tesla’s Biggest Advantage in the AI Race?

As reported by JaxDailyRecord, Elon Musk has bought APR Energy, based in Jacksonville. This deal could boost Tesla’s presence in the growing data center energy market.

Though Musk and Tesla haven’t confirmed this, filings indicate the deal might exceed $1 billion. If accurate, this acquisition would merge APR Energy’s fast gas-powered generation with Tesla’s expanding battery storage. Together, they could provide strong solutions for (artificial intelligence) AI-driven data centers needing reliable power.

The acquisition comes as demand for electricity from AI and cloud computing surges. Companies are looking for alternatives to traditional utility connections.

FTC Filing Points to Elon Musk as Buyer

The first reports of the acquisition appeared in a Federal Trade Commission (FTC) filing. It identified Elon Musk as the buyer of New APR Energy LLC. In May, the FTC allowed the deal to proceed without further antitrust review.

Duos Technologies Group, which held a 5% stake in APR Energy, reported receiving about $50.4 million from the sale. This suggests the total transaction value exceeds $1 billion.

Neither APR Energy nor Musk has commented on the purchase.

APR Energy has changed hands several times in the last decade. It went private in 2016, was acquired by Atlas Corp. in 2020 for $750 million, and was later sold to Fortress Investment Group in late 2024. The company was then renamed New APR Energy, but it continues to operate under the APR Energy brand.

Inside APR Energy’s Rapid-Deployment Power Business

APR Energy specializes in quickly deploying temporary and permanent power plants worldwide.

Its modular systems can provide electricity in weeks, making them appealing to utilities, governments, industries, and AI data centers. Unlike traditional power plants, which often take years to build, APR claims some of its plants can be operational in just 30 days.

Its portfolio includes:

  • Mobile gas turbines
  • Modular natural gas power plants
  • Flexible generation systems
  • Temporary and bridge power solutions
  • Integrated engineering, construction, operation, and maintenance services

The company offers multiple fuel options, including natural gas, LNG, LPG, and hydrogen blends. Its systems work well with battery energy storage systems (BESS), enhancing grid stability and reducing emissions while ensuring reliable electricity.

This flexibility is increasingly important as AI infrastructure grows across North America.

AI Is Driving Massive Power Demand

Artificial intelligence is reshaping electricity demand. Modern AI training clusters require vast amounts of continuous power, often exceeding local utilities’ capacity.

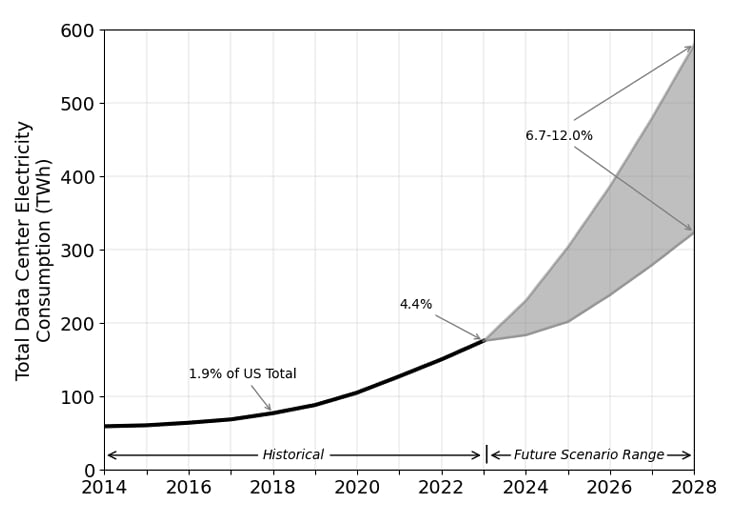
  • Recent U.S. energy estimates show that data centers used about 176 terawatt-hours (TWh) of electricity in 2023, making up roughly 4.4% of total U.S. electricity use.
  • This demand could rise to between 325 TWh and 580 TWh by 2028, depending on AI growth.

Total data center electricity use from 2014 through 2028

AI data center energy consumption
Source: 2024 United States Data Center Energy Usage Report, Lawrence Berkeley National Laboratory

Utility interconnection queues are a major hurdle for hyperscale data centers, with new facilities sometimes waiting years for enough grid capacity.

APR Energy aims to solve this issue.

Its behind-the-meter power solutions let data centers start operating while awaiting permanent utility connections. The company claims to have delivered 250 MW of behind-the-meter generation for a major AI facility in under 30 days, allowing operations to begin before grid upgrades were complete.

  • It currently supplies APR currently supplies 375 megawatts of power to one of the worldโ€™s largest AI data centers. This capability will be increasingly valuable as AI companies race to expand computing capacity.

Tesla Energy Is Growing Rapidly

Musk’s Tesla is known for electric vehicles, but its energy division is one of its fastest-growing sectors. Tesla Energy creates utility-scale battery storage systems, residential batteries, and solar products.

Its flagship Megapack is now a leading grid-scale battery system. Designed for utilities and large customers, each Megapack stores significant amounts of electricity and helps stabilize power grids by balancing supply and demand.
The company reveals that Megapack systems now operate in over 65 countries, supporting multi-gigawatt-hour energy storage projects worldwide.

Demand is rising as governments and utilities invest in renewable energy and seek reliable backup power.

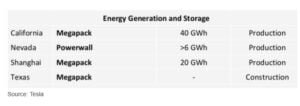
Tesla has increased its manufacturing capacity to meet this need. Its dedicated Megapack factory in Lathrop, California, has ramped up production, while a second facility in Shanghai boosts global supply.

This growth has resulted in impressive financial performance. Tesla’s Energy Generation and Storage segment has become one of its fastest-growing areas, generating billions in annual revenue as Megapack deployments accelerate.

TESLA energy storage
Source: Tesla

How APR Could Complement Tesla

If the acquisition is confirmed, APR Energy would add capabilities that Tesla does not fully provide. Tesla, as we know, also specializes in battery storage, while APR focuses on rapid power generation with mobile gas turbines and modular plants.

Together, they could offer a more complete energy solution.

For instance, an AI data center could use APR’s modular gas generation for immediate electricity while integrating Tesla Megapack batteries to balance power output, improve reliability, reduce fuel use, and support grid services. This was again analyzed by the Jacksonville Daily Record.

Once utility infrastructure becomes available, battery storage could operate alongside renewable energy, while temporary generation is scaled back or moved.

This hybrid approach is gaining interest as developers seek reliable power without delaying costly AI projects.

Assessing the Potential Impact of the Reported Acquisition

The global data center industry is entering a rapid expansion phase. AI, cloud computing, and digital services are driving record investments in new facilities, but electricity access is a major growth constraint.

Many utilities struggle to build transmission infrastructure quickly enough to meet demand. Consequently, companies are increasingly investing in behind-the-meter generation, battery storage, and microgrids for reliable power.

This trend opens opportunities for providers that can deploy energy infrastructure swiftly.

APR’s expertise in fast-track generation, combined with Tesla’s battery storage, could position them to serve one of the fastest-growing segments of the global energy market.

The acquisition isnโ€™t confirmed yet, but the reported deal highlights how AI is reshaping the energy sector. Tech companies are looking for integrated, flexible energy solutions that can be deployed in months, not years.

For Tesla, enhancing its energy business with rapid-deployment power generation could strengthen its role as a provider of electricity infrastructure for the AI era.

Gevo Expands Carbon Credit Business as Low-Carbon Fuel Growth Boosts 2026 Outlook

Gevo Inc. (NASDAQ: GEVO) reports strong results from its low-carbon fuels and carbon removal initiatives. The renewable fuels company is advancing in carbon markets, biofuels, renewable natural gas (RNG), and sustainable aviation fuel (SAF). As a result, management expects significantly higher earnings for 2026 than previously predicted.

The company believes its non-GAAP adjusted EBITDA for 2026 could more than double prior estimates. This positive outlook stems from carbon credit opportunities, increased production, improved operations, and new tax credit revenue.

Gevo’s Chief Executive Officer Paul Bloom said:

โ€œWe continue to deliver solid progress on recognizing greater value from our commodities, carbon business and incentives. Our actions taken in the second quarter demonstrated that our carbon strategy is working to deliver increased value for our shareholders from our operating assets, while also advancing our growth objectives.โ€

Carbon Business Drives Growth

A major milestone for Gevo this year is its entry into compliance and voluntary carbon markets.

The company has completed a new carbon intensity pathway under Canada’s Clean Fuel Regulations (CFR) for its low-carbon ethanol made with carbon capture and sequestration (CCS). This allows Gevo to generate and sell compliance carbon credits in Canada, with sales beginning this year and revenue expected in the third quarter of 2026.

Gevo is also expanding in the voluntary carbon market via its bioenergy with carbon capture and storage (BECCS) project in North Dakota.

  • According to carbon market platform CDR.fyi, Gevo ranks among the world’s top five suppliers of delivered carbon removal credits. Unlike many firms still in development, Gevo consistently delivers verified credits to clients.

Chief Carbon Officer Alex Clayton sees significant growth potential in this area. He stated that Gevo is creating new opportunities while helping to set standards for quality carbon removal. Clayton believes the company could generate over $30 million in carbon-related revenue as demand rises. He also noted the long-term goal is to build a trusted carbon credit market for global trading.

Carbon Credit Sales Surge

Demand for Gevo’s carbon removal credits has soared in 2026.

The company reports that sales in the first half of the year have already surpassed total sales for all of 2025. Notable organizations have retired carbon dioxide removal certificates (CORCs) from Gevo’s North Dakota BECCS project via the Puro.earth registry.

Clients include Nasdaq, Delta Air Lines, Bank of Montreal, Monzo Bank, and Amgen, all seeking reliable carbon removals. Recently, Nasdaq retired credits for about 8,500 tonnes of carbon dioxide equivalent and highlighted this partnership in its latest sustainability report.

gevo carbon credits sales
Source: CDR.Fyi

Launching a Carbon Marketplace

To meet rising demand, Gevo has launched an online platform for its carbon removal business.

This new site allows buyers to access Gevo’s carbon credits directly and explains how its BECCS technology works. The platform aims to simplify the purchasing process and educate companies on meeting climate targets through verified removals.

Gevo states that all its carbon credits are certified under the Puro Standard via Puro.earth. Cula Technologies provides monitoring to ensure transparency in project performance and verification. The company is also in discussions to improve standards in the voluntary carbon market.

Expanding Carbon Arbitrage Strategy

Gevo describes its business model as a “carbon arbitrage” strategy.

Instead of relying solely on fuel sales, the company gains value from multiple sources linked to the same production process. Low-carbon ethanol production generates fuel revenue, carbon credits, tax incentives, and carbon removal credits through CCS. These diverse revenue streams improve project economics and lessen reliance on fuel prices.

Management notes that growth in compliance and voluntary carbon markets is boosting returns from this integrated model.

Section 45Z Tax Credits Expected

A key factor in Gevo’s improved outlook is the U.S. Section 45Z Clean Fuel Production Tax Credit.

The company anticipates monetizing over $70 million in Section 45Z tax credits during 2026. These credits relate to ongoing production of low-carbon ethanol and renewable natural gas, rewarding further reductions in carbon intensity. Gevo expects to see cash proceeds from these tax credits in the second half of this year.

Financing Push Supports Gevo’s 2028 Capacity Expansion

The company is also planning to double the facility’s capacity to about 150 million gallons annually. Engineering work, permitting, and initial equipment purchases have already started. This larger expansion aims for completion in 2028 after securing financing.

It expects to finalize financing arrangements, including a partnership with Ara Energy, in the second half of 2026. If successful, this expansion would roughly double ethanol production, carbon capture capacity, and revenue from the North Dakota site.

gevo alcohol to jet

SAF Facility, Project Northstar Gets a Boost

Gevo is advancing Project Northstar, its main sustainable aviation fuel facility planned for North Dakota.

The company has completed Front-End Loading Phase 3 (FEL-3) engineering for the project. Construction costs are now estimated at $600 million, with typical engineering uncertainty around 10%.

Most of the alcohol-to-jet technology modules have performed close to earlier estimates, within 2% of previous projections. However, total project costs have risen due to site-specific challenges.

Gevo noted that weaker soil conditions at the North Dakota site require more civil engineering work. Shipping and logistics costs for key equipment have also increased. These site-specific costs added about $100 million to the overall project estimate.

Management mentioned that future facilities in different locations could have lower or higher costs depending on local conditions. The company is now working to secure additional long-term SAF purchase agreements before making a final investment decision later this year.

Operational Improvements Boost Production

  • The press release highlighted that a debottlenecking project is underway to increase low-carbon ethanol production capacity to around 75 million gallons by the end of 2026.

Additionally, the project is on track and within budget. Once complete, management predicts that production of ethanol, coproducts, captured carbon dioxide, and related incentives will rise by about 10% to 15% starting in 2027.

The company states that this expansion should not require significant unplanned production shutdowns.

gevo north dakota

Growing Support for SAF

Gevo revealed that market conditions for SAF are improving across North America.

According to Fortune Business Insights, the global sustainable aviation fuel (SAF) market was valued at US$2.72 billion in 2025.

The market is expected to grow to US$4.02 billion in 2026 and reach US$40.09 billion by 2034, reflecting a 33.3% compound annual growth rate (CAGR) during the forecast period. North America led the global SAF market in 2025, capturing 46.43% of total market revenue.

SAF market north america

Several U.S. states, like Colorado, Hawaii, Kentucky, Massachusetts, Minnesota, and New Mexico, have started or grown SAF tax credits and low-carbon fuel programs.

These efforts aim to prompt airlines to use cleaner aviation fuels. Together, these states use nearly 3 billion gallons of jet fuel each year, showing a big potential market for sustainable options. Gevo thinks these policies could boost long-term demand and improve funding for future SAF projects.

Renewable Natural Gas Performance

Gevo’s renewable natural gas business has also shown strong results in the second quarter.

The company reported RNG production above budget, averaging around 106% of planned output for the year. Meanwhile, its specialty fuels business in Silsbee, Texas, has transitioned from a cost center in 2025 to a profitable venture expected in 2026. Additional cost-cutting measures are projected to reduce annual corporate expenses by over $5 million.

  • As Gevo prioritizes Project Northstar, it is considering winding down development of its SAF project in Lake Preston, South Dakota.

Management noted that ending work at Lake Preston might lead to big non-cash write-downs. However, they expect no extra cash spending on it. Instead, resources will shift to North Dakota, where Gevo sees better long-term opportunities for both sustainable aviation fuel and carbon removal.

Gevo is focusing on carbon management and renewable fuels for long-term growth. With rising carbon credit sales and more access to compliance markets, the company is well-positioned. They are also boosting biofuel production and benefiting from valuable tax incentives. Progress on their flagship SAF project further supports this strategy.

France Unveils โ‚ฌ63B Offshore Wind Mega-Plan Approved by EC to Power Europe’s Net-Zero Race

France is making one of its biggest clean energy investments yet. The European Commission has approved a โ‚ฌ63 billion (US$72 billion) support program to help France build and operate 11 offshore wind farms over the next 25 years. The plan aims to speed up renewable energy development, reduce greenhouse gas emissions, and strengthen Europe’s energy security as electricity demand continues to rise.

The approval comes at a time when Europe is working to replace fossil fuels with cleaner electricity while meeting its climate goals. At the same time, power demand is growing because of electric vehicles, heat pumps, and AI data centers.

For France, offshore wind is becoming a key part of this transition. Teresa Ribera, Executive Vice-President for Clean, Just and Competitive Transition,

“Todayโ€™s decision clears the way for Franceโ€™s offshore wind support scheme. France will continue working towards a fully decarbonised energy system, and the Commission will continue supporting Member States in achieving our common climate objectives.”

France Unleashes a Historic Offshore Wind Buildout

The projects will be located in the North Sea, the Atlantic Ocean, and the Mediterranean Sea. Together, they will provide up to 11.1 gigawatts (GW) of new offshore wind capacity and generate about 47.8 terawatt-hours (TWh) of clean electricity each year. That is enough to supply more than 10% of France’s annual electricity demand.

France offshore wind program 63B euros

The program was approved under the European Union’s Clean Industrial Deal State Aid Framework (CISAF). It was introduced in May 2025 to speed up renewable energy projects and strengthen Europe’s clean technology industry.

France will award the projects through competitive auctions. Winning developers will receive long-term two-way Contracts for Difference (CfDs). These contracts provide stable revenues by linking payments to electricity market prices. They help lower investment risks while protecting consumers from excessive power prices.

The new program also moves France closer to its goal of installing 18 GW of offshore wind by 2035 and 45 GW by 2050, making offshore wind a key part of the country’s clean energy transition.

Offshore Wind Supports France’s Climate Goals

Offshore wind is a key part of France’s clean energy strategy. The country aims to reach carbon neutrality by 2050. To get there, it plans to expand renewable energy while keeping its low-carbon nuclear power system.
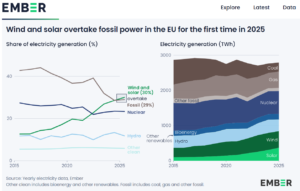
power generation in France 2025

The government wants offshore wind capacity to grow to 18 GW by 2035 and 45 GW by 2050. With more than 5,500 kilometers of coastline, France has some of Europe’s best offshore wind resources.

More offshore wind will help cut fossil fuel use, improve energy security, and meet rising electricity demand from electric vehicles, industry, and AI data centers. The new โ‚ฌ63 billion program could speed up that transition and support France’s long-term climate goals.

Expanding offshore wind will make the country’s power mix even cleaner. It will also reduce the need for fossil fuel generation during periods of high demand.

Why Offshore Wind Is Booming Worldwide

France’s investment reflects a much bigger global trend.

According to the Global Wind Energy Council (GWEC), global offshore wind capacity has now grown to over 83 GW. The industry is expected to add over 410 GW of new offshore wind capacity between now and 2035 as countries invest in cleaner electricity and stronger energy security.

offshore wind installations outlook GWEC

Europe continues to lead the market. WindEurope says the region installed 16.4 GW of new wind power capacity in 2025. Wind now supplies about 20% of Europe’s electricity, making it one of the continent’s largest sources of clean power.

France has some of Europe’s best offshore wind resources because of its long Atlantic and Mediterranean coastlines. However, it has expanded more slowly than countries such as the United Kingdom, Germany, and the Netherlands. The new support program will help close that gap over the coming years.

It will also support the European Union’s target of cutting net greenhouse gas emissions by at least 55% by 2030 compared with 1990 levels.

The power sector remains one of the world’s biggest sources of emissions. According to the International Energy Agency (IEA), electricity and heat generation account for about one-third of global energy-related COโ‚‚ emissions. Replacing coal and natural gas with renewable electricity is one of the fastest ways to reduce those emissions.

Wind Energy Is Reshaping Europe’s Power Mix

Ember reports that wind and solar produced almost 30% of the EU’s electricity in 2025. At the same time, fossil fuel generation kept falling with renewables overtaking it for the first time. The shift reflects years of investment in renewable energy and stronger climate policies across the region.

Europe wind and solar 2025 Ember

The next challenge is expanding the electricity grid.

The IEA says countries must build and upgrade millions of kilometers of transmission and distribution lines by 2040 to keep pace with rising electricity demand. Without stronger grids, many renewable energy projects could face delays because they cannot connect to the network.

Battery storage will also play a larger role. Batteries store extra electricity when wind output is high and release it when demand increases. Together, stronger grids and more storage will help make renewable electricity more reliable.

Billions Flow Into the Offshore Wind Revolution

The offshore wind industry is attracting record levels of investment.

IRENA estimates that in 2025, renewable power added a record amount of new capacity worldwide. Solar and wind led most of these new installations. Governments and investors continue to favor these technologies because costs have fallen sharply over the past decade. Moreover, energy security has become a higher priority.

solar and wind generation 2025 IRENA
Source: IRENA

Europe remains one of the world’s largest offshore wind markets. The region has built a strong supply chain that supports thousands of jobs in manufacturing, engineering, construction, and port operations.

France’s โ‚ฌ63 billion program aims to boost the industry. It offers developers the long-term certainty they need to invest in new projects.

France Is Investing in Europe’s Clean Energy Future

The European Commission’s approval marks one of the largest offshore wind support programs ever introduced in Europe.

For France, the investment could reduce emissions, improve energy security, and strengthen domestic clean energy industries. For Europe, it reinforces offshore wind’s growing role in building a low-carbon economy.

The program also sends a broader message to global markets. Governments are no longer investing in renewable energy only to meet climate targets. They are also doing it to improve energy independence, support economic growth, and prepare electricity systems for a future powered by AI, electric transport, and clean industries.

As offshore wind capacity expands across Europe, projects like France’s โ‚ฌ63 billion program will play an increasingly important role in reducing emissions while supplying the reliable electricity needed for the next phase of the global energy transition.

Europe’s New Carbon Price Faces Backlash as 10 Nations Seek Fuel Cost Changes

The European Union’s biggest climate policy is facing fresh political pressure. Ten EU countries, led by Italy and Poland, have asked the European Commission (EC) to rethink its new carbon market for road transport and building fuels, known as ETS2. They argue that higher fuel costs could put more pressure on households and businesses already dealing with economic uncertainty.

The request comes as Brussels prepares a wider review of the EU Emissions Trading System (EU ETS). The countries want stronger safeguards against sharp price hikes before the new market starts in 2028. This comes after the EU decided to delay the launch by a year due to worries about energy costs.

The statement of the opposition reads:

“European citizens should not be facing new climate taxes in the current economic โ€‹and geopolitical circumstances. ETS2 should therefore be addressed directly in the revision and carefully reconsidered.”

Countries that signed the statement and requested revisions to existing ETS include Italy, Poland, Bulgaria, Cyprus, the Czech Republic, Estonia, Greece, Hungary, Romania, and Slovakia.

What Is ETS2?

The EU Emissions Trading System 2 (ETS2) is a new carbon market created under the EU’s 2023 ETS reforms. It expands carbon pricing to buildings, road transport, and small industries that the existing EU ETS does not cover.

Road transport makes up about 25% of the EU’s greenhouse gas emissions. Buildings use around 40% of the bloc’s energy and contribute 36% of its energy-related emissions, says the European Commission.

Like the current system, ETS2 follows a cap-and-trade model, but it applies upstream. That means fuel suppliers, not households or drivers, must buy carbon allowances (carbon credits) through government auctions to cover the emissions from the fuels they sell. Some of these costs could be passed on to consumers through higher fuel prices.
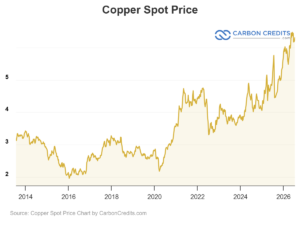
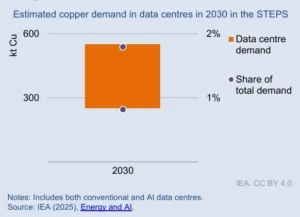
The system will become fully operational in 2028 and aims to cut emissions from the covered sectors by 42% by 2030, compared with 2005 levels. All revenue from allowance auctions will be for climate action and social support.

EU carbon prices have been moving higher in recent months. ICE data shows that the benchmark EU Allowance (EUA) December 2026 contract rose to about โ‚ฌ82 per tonne in July. It had traded around โ‚ฌ80 per tonne in June.

Hopes for reforms in the EU ETS support the market. There may also be closer ties between the EU and UK carbon markets, while the supply of permits is expected to tighten over time. Analysts say carbon prices will remain sensitive to policy decisions as Brussels reviews the future of the ETS.

EU carbon prices futures from ICE
Source: ICE

Why Europe is Expanding Carbon Pricing

The EU believes carbon pricing remains one of its most effective climate tools.

The existing EU ETS, launched in 2005, already covers power generation, heavy industry, and aviation. Together, these sectors account for about 40% of the EU’s greenhouse gas emissions.

The results have been significant.

According to the European Commission, emissions from sectors covered by the EU ETS have fallen by about 50% since 2005. The carbon market has also raised more than โ‚ฌ260 billion since 2013, with much of the revenue invested in renewable energy, clean technology, and climate projects.

EU ETS revenue 2025
Source: EC

By extending carbon pricing to transport and buildings, policymakers hope to cut emissions in sectors that have made slower progress. The move is central to the EU’s goal of reducing net greenhouse gas emissions by at least 55% by 2030 and reaching climate neutrality by 2050.

Balancing Climate Action and Energy Costs

The debate highlights one of Europe’s biggest climate challenges: how to reduce emissions without making everyday energy more expensive. The main challenge is finding the right balance.

Supporters say ETS2 will encourage cleaner vehicles, better home insulation, and low-carbon heating systems. Critics worry that higher fuel bills could place too much pressure on households, especially in lower-income regions.

To address those concerns, the EU created the Social Climate Fund, worth up to โ‚ฌ86.7 billion. The fund will help member states support vulnerable households, small businesses, and transport users through investments in clean heating, energy efficiency, and low-emission mobility.

The current debate is therefore not about whether Europe should reduce emissions. It is about how quickly the transition should happen and how its costs should be shared across society.

Carbon Pricing Is Growing Worldwide

Europe is not the only region putting a price on carbon.

According to the World Bank’s State and Trends of Carbon Pricing 2025 report, there are now 80 carbon pricing instruments operating or scheduled worldwide. These include carbon taxes and emissions trading systems across national, regional, and local governments.

carbon pricing 2025 world bank
Source: World Bank

Together, they cover about 28% of global greenhouse gas emissions and generated more than US$100 billion in revenue in recent years. Much of that money has been used to support clean energy, climate projects, and programs that help households and businesses manage the transition.

Europe remains the global leader. The EU ETS is the world’s largest carbon market and has become a model for many countries developing their own emissions trading systems.

Cutting Emissions From the Hardest Sectors

The EU has already made strong progress in cleaning up electricity generation. According to Ember, wind and solar produced nearly 30% of the European Union’s electricity in 2025, while coal generation continued to fall.

As the power sector becomes cleaner, transport and buildings now account for a larger share of the region’s remaining emissions.

That is why ETS2 focuses on these sectors. Reducing emissions from these sectors will be essential if Europe wants to meet its 2030 and 2050 climate targets.

The Debate Is About Timing, Not the Goal

Most governments agree that emissions must continue to fall. The disagreement is over how quickly carbon pricing should expand and how to protect consumers from higher energy costs.

Some countries want stronger safeguards before ETS2 begins. Their proposals include releasing more allowances into the market if prices rise too quickly and improving mechanisms that prevent excessive price swings.

Supporters argue these changes would make the system more stable without weakening Europe’s climate goals. Others warn that delaying or softening the market too much could reduce investment in cleaner technologies and slow emissions reductions.

The European Commission is expected to review the proposals as part of its broader assessment of the EU carbon market.

A Critical Test for Europe’s Net-Zero Strategy

The outcome of the ETS2 will shape the next phase of Europe’s climate policy.

Carbon pricing remains one of the EU’s most important tools for reducing emissions because it rewards cleaner technologies while encouraging investment in energy efficiency and low-carbon fuels.

At the same time, public support will be just as important as strong policy. Governments must show that climate action can reduce emissions without placing an unfair burden on families and small businesses.

Finding that balance will determine the success of ETS2.ย As more countries move toward net-zero emissions, that balance may become one of the biggest challenges facing climate policy over the next decade.

Copper Prices Enter a New Bull Market: Chile Raises Price Forecast as AI and Clean Energy Fuel Demand

The central bank of Chile, the world’s largest copper producer, recently lowered its 2026 economic growth forecast, but it raised its average copper price forecast to US$5.90 per pound. The change reflects strong global demand and limited mine supply. It also shows that copper remains one of the world’s strongest commodity markets, even as economic growth slows.ย 

As the biggest producer, Chile has a major influence on global copper supply. Copper is essential for power grids, electric vehicles (EVs), renewable energy, battery storage, and AI data centers. Higher prices could benefit mining companies while supporting the industries driving the global energy transition.

Chile Sees Strong Copper Prices Ahead

Chile’s latest forecast shows confidence in the copper market. The central bank expects copper to average US$5.90 per pound in 2026, before easing to US$5.20 in 2027 and US$5.00 in 2028.

Copper Spot Price - CarbonCredits

Even with slower economic growth, officials believe demand will stay strong because the world still needs more copper for clean energy and new technology.ย 

Chile’s Copper Commission (Cochilco)ย shares that view. Earlier this year, it also raised its copper price outlook. The agency said prices are being supported by tight global supply and growing demand from renewable energy, electric transport, and digital infrastructure.

Copper prices have seen some ups and downs over the past year. However, they remain well above their historical average. Analysts say the market is now being driven more by long-term demand than by short-term economic swings.

Copper Spot Price - CarbonCredits (1)

AI and Clean Energy Are Reshaping Copper Demand

Copper has become one of the world’s most important metals.

According to the International Energy Agency (IEA), power grids will create the largest increase in copper demand over the coming decades. Countries need thousands of kilometers of new transmission lines to connect renewable energy projects and meet rising electricity demand.

Electric vehicles also use much more copper than traditional cars. The IEA estimates that a battery-powered EV needs about 2.5x more copper than a gasoline-powered vehicle. Wind turbines, solar farms, and battery storage systems also require large amounts of the metal.

Artificial intelligence is adding even more demand. AI data centers need transformers, substations, cooling systems, backup power, and large networks of electrical cables. All of these use copper.

copper demand in data centers 2030 IEA

The IEA expects electricity use by data centers around the world to more than double by 2030, reaching about 945 terawatt-hours (TWh) each year. That is roughly equal to Japan’s total annual electricity use today. Most of the increase will come from AI.

As companies like Google, Microsoft, Amazon, and Meta build more AI data centers, demand for copper will keep growing.

Chile Remains the World’s Copper Powerhouse

Chile remains the world’s biggest copper producer.

According to the U.S. Geological Survey (USGS), Chile produced about 5.3 million metric tonnes of copper in 2025. That was about one-quarter of global mine production.

top copper producers 2025 usgs data

The country’s biggest mines include Escondida, Collahuasi, and Codelco. Together, they supply copper to manufacturers around the world.

Cochilco expects Chile’s annual copper production to reach about 5.54 million metric tonnes by 2034. However, growth is likely to be slow. Many older mines now produce lower-grade ore. New mining projects are also becoming more expensive and take longer to develop.

Chile’s state-owned miner Codelco recently said its production is expected to stay close to current levels over the next few yearsย instead of reaching its long-term target of 1.7 million metric tonnes a year by 2030.

Bernardo Fontaine, Codelco Chairman, remarked:

“It is very โ possible โ that it sits at โ a โ€‹production rate quite similar to the one it has today.”

The company is still recovering after output fell to its lowest level in more than 20 years during 2022 and 2023. Production from its own mines reached 1.33 million metric tonnes last year.

Fontaine further said several major expansion projects have faced unexpected delays and higher costs as it works to offset declining ore grades. The company also sees the El Abra mine, where it owns a 49% stake alongside Freeport-McMoRan, as a promising project for future investment. Freeport plans to invest US$7.5 billion to expand the mine.

With demand rising and supply growing slowly, many analysts believe copper prices could remain strong for years to come.

Why Global Copper Supply Is Falling Behind

While demand keeps growing, copper supply is not rising as fast.

Many of the world’s largest copper mines are getting older. As ore grades fall, companies must process more rock to produce the same amount of copper. That increases both costs and energy use.

New mines also take a long time to build. According to the IEA, developing a new copper mine can take 15 to 20 years from discovery to production. Permitting, financing, and environmental reviews all add time to the process.

copper supply forecast IEA

The International Copper Study Group (ICSG) expects global mine production to increase over the next few years. However, many analysts believe that growth will still fall short of future demand because of project delays, lower ore grades, and rising costs.

Copper Is Becoming a Critical Net-Zero Metal

Copper is now at the center of the clean energy transition.

The IEA estimates that clean energy technologies could account for almost half of global copper demand by 2040 under a pathway that reaches net-zero emissions by 2050. That includes electric vehicles, renewable power, battery storage, electricity networks, and hydrogen projects.

Power grids will need the biggest investment. The World Bank estimates that global electricity networks must expand rapidly to support cleaner energy and growing electricity demand. Every new transmission line, transformer, and substation requires large amounts of copper.

The rapid growth of AI is adding another layer of demand. New data centers require huge amounts of electrical equipment before they can even begin operating. As more countries build AI infrastructure, copper demand is expected to remain strong.

High Prices Are Sparking New Mining Investment

Strong copper prices may also encourage companies to invest in new projects. The challenge is timing.

Even if companies approve new projects today, many will not begin producing copper until the next decade. That means supply could remain tight while demand continues to grow.

According to S&P Global, global copper demand could nearly double,ย from 28 million metric tons a year in 2025 to 42 million metric tons by 2040. This is driven mainly by electrification, clean energy, AI, and digital technologies. Meeting that demand will require major investment across the mining sector.

copper demand by sector 2040 S&P Global

Copper’s Bull Run Faces New Tests

Copper’s long-term outlook remains positive, but risks still exist. A weaker global economy could reduce industrial demand in the short term. Trade tensions and changing government policies may also create periods of price volatility.

However, most market analysts expect the long-term trend to remain strong because the world cannot expand clean energy without more copper.

Chile’s latest forecast reflects that reality. Even as economic growth slows, the country expects copper prices to stay well above historical levels because demand continues to outpace supply.

As countries build more renewable power, modernize electricity grids, expand AI infrastructure, and produce more electric vehicles, demand for copper is likely to remain strong for many years. That is why many analysts believe today’s high prices may be part of a much longer market cycle rather than a short-term rally.