


The U.S. solar industry is entering a new phase. Solar installations continue to expand, but the market is also undergoing a major shift in where panels and components are manufactured.
After years of relying heavily on overseas supply chains, the U.S. has attracted billions of dollars into domestic solar factories. New manufacturing capacity is emerging across the country, while developers continue to build large amounts of solar power despite changing tax incentives, trade rules, and permitting challenges.
New research shows just how large that manufacturing push has become.
Cumulative U.S. solar photovoltaic manufacturing capital expenditure is expected to reach $12.2 billion by the end of 2026 since the Inflation Reduction Act (IRA) was introduced in 2022, according to analysis from Terawatt PV Research reported by pv magazine. That figure represents more than half of all U.S. solar manufacturing investment since 2001.
At the same time, the latest US Solar Market Insight Q3 2026 report from Wood Mackenzie and the Solar Energy Industries Association (SEIA) shows that the domestic solar market continues to operate at a substantial scale, with a large pipeline supporting demand for locally manufactured equipment.
U.S. Solar Manufacturing Investment Surges
The scale of recent investment stands out against the industry’s earlier history.
According to Terawatt PV Research, U.S. solar manufacturing capex exceeded $2.5 billion annually from 2023 onward. Spending reached a record $4.14 billion in 2024, with more than 60% coming from First Solar and Qcells.
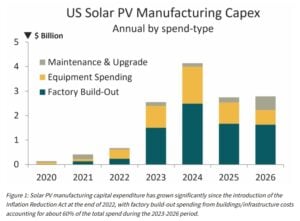
First Solar’s spending included new manufacturing facilities in Alabama and Louisiana, while Qcells expanded its vertically integrated manufacturing operations in Georgia.
From Factory Investment to Actual Solar Production
The investment is also changing the structure of the domestic supply chain. The research firm tracks spending across buildings and infrastructure, new production equipment, and maintenance or upgrades.
- Buildings and infrastructure accounted for roughly 60% of U.S. solar manufacturing capex between 2023 and 2026
- It highlights how much capital has gone into establishing physical production facilities rather than simply upgrading existing lines.
This distinction is important because manufacturing announcements do not automatically translate into production.
A factory can have several gigawatts of announced capacity while still operating well below that level during its initial ramp-up. Terawatt’s analysis therefore looks at effective capacity, actual production, and capacity-conversion rates alongside capital spending.
The research found that conversion rates can range from just 15%-20% during early ramp-up to 70%-80% at some established manufacturing facilities.
U.S. Solar Manufacturing Buildout Tops 75 GW as Cell Capacity Surges
According to recent SEIA and Wood Mackenzie data, U.S. operational module manufacturing capacity reached 75.3 GW, with another 14.4 GW under construction. Domestic solar cell manufacturing is also expanding, with 10.6 GW of operational capacity and 19.1 GW under construction.
That upstream growth could gradually reduce one of the biggest weaknesses in the domestic solar supply chain: the gap between module assembly and production of cells and other components.
Texas Emerges as a Solar Manufacturing Hub
The new manufacturing investment is also creating regional clusters.
Texas has emerged as the leading U.S. state for solar module production in 2026, according to Terawatt PV Research. Companies including Canadian Solar, Sirius/Elin, Imperial Star, SEG Solar, T1 Energy, TOYO/Abalance, and Waaree Energies are contributing to the state’s growing manufacturing base.
The Southeast has become another important manufacturing region, particularly across Louisiana, Florida, the Carolinas, Georgia, and Alabama.
This geographic shift could become increasingly important for developers and suppliers as the U.S. solar industry places greater emphasis on domestic sourcing and supply-chain security.
The expansion also extends beyond modules.
Solar Demand Keeps the Factories Busy
Manufacturing investment would have less value without strong domestic demand.
- The Wood Mackenzie and SEIA Q3 2026 outlook shows that the U.S. installed 11.4 GWdc of solar capacity in Q2 2026, a 45% increase from the same quarter in 2025 and a 43% increase from Q1.
- Utility-scale projects accounted for nearly 10 GWdc, up 61% year over year.
Developers accelerated construction partly because of deadlines associated with federal clean-energy tax credits.
Wood Mackenzie estimates that more than 200 GWdc of utility-scale solar projects sit within the safe-harbored pipeline, providing significant near-term demand visibility.
The residential market presents a different picture. Wood Mackenzie expects U.S. residential solar installations to decline 23% in 2026 following the expiration of the federal residential 25D tax credit.
Utility-scale solar therefore remains an important source of demand as the industry moves through the policy transition.
EIA Data: U.S. Solar Capacity in 2026
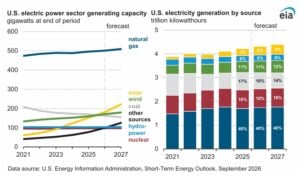
EIA’s latest short term energy outlook revealed U.S. solar capacity to reach 181 GW and provide 8% of U.S. electricity generation in 2026
Its latest capacity data also shows how quickly new solar projects are being added. Developers plan to bring 43.4 GW of new utility-scale solar capacity online in 2026, a 60% increase from the 27.2 GW added in 2025, if all planned projects are completed.
- Texas accounts for about 40% of the planned 2026 utility-scale solar additions.
The growth comes as U.S. electricity demand also rises. EIA expects electricity sales to reach 4,135 billion kWh in 2026, nearly 2% above 2025, with data centers and manufacturing contributing to higher commercial and industrial demand.
Can the Market Nearly Double by 2031?
Despite the policy and trade changes, Wood Mackenzie expects the broader U.S. solar market to maintain a substantial buildout.
- The research firm forecasts annual U.S. solar installations to average around 44 GWdc through 2031, with cumulative solar capacity exceeding 545 GWdc by 2031.
- The longer-term trajectory is even higher, projecting cumulative U.S. solar deployment to reach 769 GW by 2036.
However, the path will not be straightforward.
Permitting delays, interconnection constraints, changing trade policies, and the transition away from existing federal tax incentives could affect the pace of future installations. Wood Mackenzie estimates that permitting delays currently affect about 30% of the early-stage utility-scale pipeline.
Trade policy is also reshaping the economics of domestic manufacturing. New tariffs and minimum import prices are increasing pressure on the supply chain while potentially improving the economics of fully integrated U.S. production.
A New Phase for U.S. Solar Manufacturing
The $12.2 billion investment shows that U.S. solar manufacturing has moved beyond factory announcements. Capital is now going into buildings, equipment, and production capacity.
The next test is how quickly these factories can ramp up and compete as costs, technology, and trade rules change.
For investors, manufacturers, and developers, the focus is shifting from announced capacity to operating factories, actual output, and cost competitiveness. The U.S. solar manufacturing story is increasingly about production and capital already moving through the supply chain.