ExxonMobil (XOM) Earnings Dip in 2025, Yet Cash Flow, Dividends, and Low Carbon Strategy Remain Robust

ExxonMobil closed 2025 with strong profits, robust cash generation, and massive shareholder payouts. However, weaker crude prices and soft chemical margins weighed on earnings. The company still reinforced its narrative of being a leaner, more technology-driven oil major with growing exposure to lower-carbon opportunities.

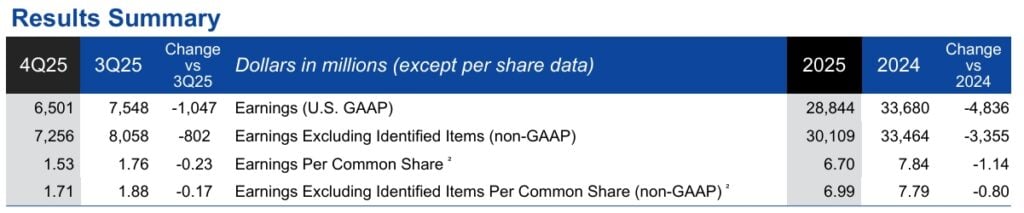
For the full year, ExxonMobil reported $28.8 billion in earnings, down from $33.7 billion in 2024. Despite the decline, the company distributed $37.2 billion to shareholders, highlighting its commitment to capital returns. The results underline Exxon’s strategy: maximize cash from advantaged assets while gradually scaling low-carbon investments.

CEO Darren Woods said the company is structurally stronger than a few years ago, with disciplined capital allocation and resilient earnings power. He also emphasized a long runway of profitable growth through 2030 and beyond.

Exxon’s Financial Performance: Lower Earnings, Strong Cash Flow

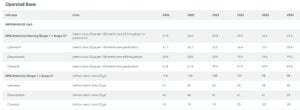
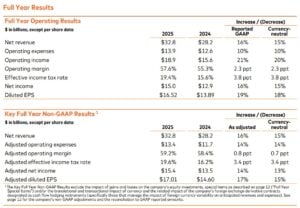
ExxonMobil delivered fourth-quarter 2025 earnings of $6.5 billion, or $1.53 per share. Excluding special items, earnings rose to $7.3 billion, or $1.71 per share. The company generated $12.7 billion in operating cash flow and $5.6 billion in free cash flow during the quarter.

For the full year, cash flow from operations reached $52.0 billion, while free cash flow totaled $26.1 billion. ExxonMobil said its operating cash flow has grown at roughly 10% annually since 2019, outperforming many peers.

However, earnings declined due to weaker oil prices, softer chemical margins, higher depreciation, and rising growth-related expenses. Lower interest income also affected results. These headwinds were partly offset by higher production, structural cost savings, and strong refining margins.

exxon xom
Source: Exxon

Capital Efficiency Drive Competitive Edge

Cash capital expenditures reached $29.0 billion in 2025, including acquisitions. Exxon expects to spend $27–$29 billion in 2026, signaling continued investment in upstream growth and energy infrastructure.

As per analysts, Exxon Mobil (XOM) is a strong dividend stock with steady cash flow and high oil production. The company returned billions to shareholders through dividends and buybacks, making it attractive to income investors.

However, XOM stock depends heavily on oil prices and faces long-term risks from climate policies and weaker chemical margins. Overall, Exxon is a stable value stock, but not a high-growth play.

Upstream: Record Production and Advantaged Assets

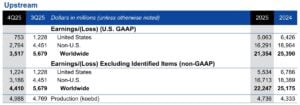
ExxonMobil’s upstream segment generated $21.4 billion in earnings in 2025, down from $25.4 billion in 2024. Lower oil prices and reduced volumes from divestments weighed on performance. Higher depreciation also impacted earnings.

However, the company achieved its highest production in more than 40 years, reaching 4.7 million oil-equivalent barrels per day. Production surged to 5.0 million oil-equivalent barrels per day, with the Permian reaching 1.8 million and Guyana nearing 875,000 barrels per day.

Additionally, it also advanced several major projects.

  • The Yellowtail project in Guyana started early and under budget.
  • The Bacalhau offshore Brazil project launched in the fourth quarter.
  • Golden Pass LNG completed mechanical work, with first cargoes expected in early 2026.
exxon upstream
Source: Exxon

Energy Products: Refining Margins Boost Profits

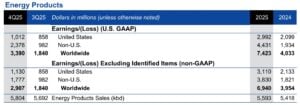
The Energy Products segment earned $7.4 billion in 2025, up $3.4 billion from 2024. Higher refining margins, cost savings, and asset sales drove the growth. However, the refining business remained resilient.

exxon xom
Source: Exxon

Chemicals: Weak Margins and Impairments

The Chemical Products segment struggled, with earnings falling to $800 million, down $1.8 billion from 2024. Weak margins, impairment charges, and higher spending weighed on results.

The China Chemical Complex ramp-up added costs, though high-value product sales hit records. Q4 saw a $281 million loss. Despite challenges, Exxon expanded chemical capacity and launched two advanced recycling facilities, processing over 250 million pounds of plastic waste annually.

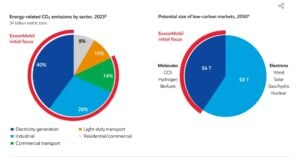
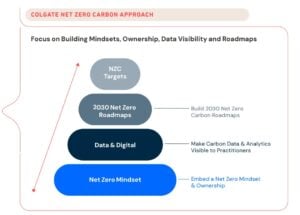
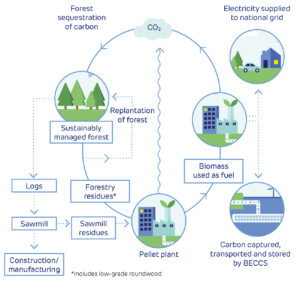
$30 Billion Low-Carbon Strategy: CCS, Hydrogen, and New Materials

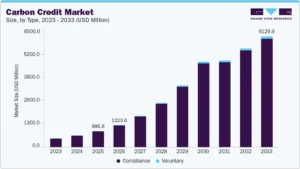
ExxonMobil continues to position itself as a major player in carbon capture, hydrogen, and lower-emission fuels. The company plans to invest up to $30 billion in lower-emission technologies between 2025 and 2030.

exxon
Source: Exxon

Management said rising carbon prices would make these investments more attractive and could significantly boost cash flow in the Low Carbon Solutions business. Exxon aims to scale projects in hydrogen, CO₂ storage, and industrial clusters to become a partner of choice for large emitters.

The company also emphasized its core strengths in subsurface engineering, large-scale project execution, and existing infrastructure as competitive advantages in the energy transition.

exxon xom emissions
Source: Exxon

Methane and Air Emissions: Progress with Economic Logic

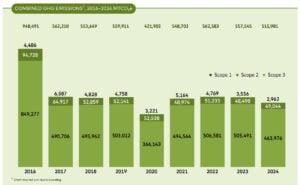
ExxonMobil reported significant progress on methane and air emissions. The company has reduced methane intensity by more than 60% since 2016 and targets 70–80% reductions by 2030.

Management framed methane reduction as both an environmental and economic opportunity. Keeping methane in the system increases gas sales and reduces losses. Exxon also noted methane’s high warming potential compared to CO₂, reinforcing the need for tighter controls.

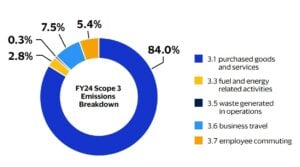
Total reportable air emissions (VOCs, SOx, NOx) dropped about 25% from 2016 to 2024, even as throughput increased to record levels.

exxon emissions
Source: Exxon

Long-Term Outlook: Oil Cash Funds the Transition

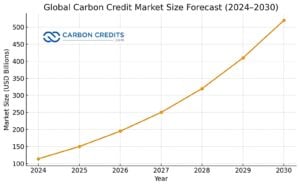
ExxonMobil believes demand for decarbonization solutions will rise significantly through 2050. The company expects carbon pricing and net-zero policies to drive capital toward carbon capture and hydrogen over time.

However, Exxon’s strategy remains pragmatic. The company will continue to maximize returns from oil, gas, and refining while gradually scaling low-carbon businesses. Management argues that each update to global net-zero scenarios increases the importance of lower-carbon solutions but does not change its core assessment of energy demand.

All in all, ExxonMobil’s 2025 results show a company balancing two worlds. On one hand, it remains a cash-generating oil and gas powerhouse with record production and industry-leading shareholder returns. On the other hand, it is cautiously expanding into low-carbon technologies without sacrificing profitability.

Colgate-Palmolive’s 2025 Earnings: Solid Profits and Clear Path to Net Zero by 2040

Colgate-Palmolive’s latest earnings show that it is delivering steady financial performance while adapting to a changing global economy. Beyond the numbers, the results also point to how the company is preparing for a lower-carbon future. This opens the door for a closer look at its net-zero goals, emissions cuts, and long-term climate strategy.

Earnings Snapshot: What the Numbers Say

Colgate‑Palmolive reported its fourth quarter and full-year 2025 results on January 30, 2026. Q4 adjusted earnings were $0.95 per share, above the $0.91 expected. Net sales reached $5.23 billion, up 5.8% from last year. Organic sales rose 2.2%, showing steady growth in oral care and pet nutrition.

For the full year, net sales were about $20.38 billion, up 1.4% from 2024. GAAP diluted EPS was $2.63, while base business EPS grew 3% to $3.69. Gross profit margins stayed above 60%. Operating cash flow hit $4.2 billion, and free cash flow before dividends was about $3.6 billion. The company returned roughly $2.9 billion to shareholders through dividends and share buybacks.

Colgate-Palmolive-Q4-FY25-earnings

Management expects 2–6% net sales growth in 2026, despite consumer spending pressures. These results show Colgate’s core businesses remain strong while supporting its long-term climate strategy. Following the results, Colgate’s stock price rose sharply, reflecting positive investor reaction.

Colgate-Palmolive stock price

These financial results are a great way to see how Colgate balances its business performance with its long-term climate strategy.

The Road to Net Zero: Colgate’s Climate Blueprint

Colgate-Palmolive has a detailed climate strategy that guides how it plans to reduce emissions and reach net zero. The company’s climate plan follows the Science Based Targets initiative (SBTi) Net Zero Carbon Standard. This ensures that its emissions targets align with limiting global warming to 1.5 °C above pre-industrial levels.

Colgate’s long-term goal is to achieve net-zero carbon emissions across its full value chain by 2040. This means the company aims to reduce emissions as much as possible and balance any remaining emissions with removals by that year.

colgate net zero approach
Source: Colgate-Palmolive

The company’s climate commitment covers a broad range of emission sources, including:

  • Scope 1: Direct emissions from fuels and combustion sources under the company’s control.
  • Scope 2: Indirect emissions from purchased electricity for operations.
  • Scope 3: Upstream emissions such as purchased goods and services, capital goods, logistics, business travel, employee commuting, and leased assets. The strategy excludes only certain optional Scope 3 categories per the SBTi Net Zero Standard.

Targets That Matter: From 2025 to 2040

Colgate aims to reduce emissions with targets for both the near term (2025 and 2030) and a long-term net-zero plan.

  • By 2025:

    • Reduce Scope 1 and 2 GHG emissions in operations by 20% versus a 2020 baseline.
    • Reduce Scope 3 emissions from purchased goods and services by 20% versus a 2020 baseline.
    • Reduce GHG emissions from consumer use of products by 20% versus a 2016 baseline.
    • Reduce manufacturing energy intensity by 25% versus a 2010 baseline.
  • By 2030:

    • Reach 100% renewable electricity across global operations.
    • Reduce Scope 1 and 2 emissions by 42% versus 2020 levels.
    • Reduce Scope 3 emissions from purchased goods and services by 42% versus 2020 levels.
  • By 2040:

    • Achieve Net Zero carbon emissions across Scope 1, Scope 2, and most Scope 3 categories.
    • Reduce Scope 1, Scope 2, and Scope 3 emissions* by 90% from a 2020 baseline (*excludes certain Scope 3 categories per SBTi Net Zero Standard).

Colgate’s climate plan breaks down the net-zero effort into key areas: product design, manufacturing, logistics, and business operations. This way, responsibility is shared among teams.

colgate-palmolive emission reductions targets
Source: Colgate-Palmolive

In addition to targets, the plan highlights the distribution of Colgate’s carbon footprint based on its 2024 Scope 1, Scope 2, and Scope 3 data. Most of the footprint comes from using and disposing of products, followed by supplier sourcing. This shows how important it is to involve suppliers and customers in cutting emissions.

These numbers and goals show that Colgate has set measurable, science-based climate targets and continues to develop strategies to reach them. The consumer giant aligns its climate strategy with well-known frameworks like the Task Force on Climate-related Financial Disclosures (TCFD). This adds transparency to how it evaluates climate risks and opportunities.

Where Emissions Come From, and Why It Matters

Colgate has taken steps toward achieving its emissions goals. The company is focusing on all areas, operations, factories, warehouses, and offices, to cut energy use and lower supply chain emissions.

Renewable Electricity and Energy Projects

Colgate plans to reach 100% renewable electricity by 2030. It has started investing in renewable energy projects, including virtual power purchase agreements for wind energy in Europe. These agreements are expected to meet a large part of the region’s electricity needs. This change helps lower emissions from power used at factory sites and main offices.

Supply Chain Engagement

Colgate recognizes that most of its emissions come from its supply chain and purchased goods. The company engages with suppliers to reduce emissions, improve energy efficiency, and support the use of low-carbon materials and processes. This includes encouraging suppliers to set their own science-based climate targets.

Operational Reductions

The consumer product firm aims to reduce energy use and emissions by 2025 and 2030. It seeks to cut energy intensity at factories and lower emissions from purchased goods. The company also reports progress against these goals in annual sustainability reports.

So far, the consumer giant has achieved the following milestones in tackling its climate footprint:

colgate-palmolive climate action 2024 net zero
Source: Colgate-Palmolive

Beyond Carbon: Packaging, Plastics, and Water

Colgate also addresses environmental impacts beyond carbon emissions. The company has clear goals for packaging and resource use:

  • Transition all plastic packaging to recyclable, reusable, or compostable materials by 2025.
  • Improve water stewardship and reduce waste in operations.
  • Achieve zero-waste operations at all manufacturing sites.
  • Target net zero water impact at water-stressed sites by 2025 and across all sites by 2030.

By the end of 2024, about 93% of Colgate’s packaging was recyclable, reusable, or compostable. The company now uses recyclable toothpaste tubes in over 70 countries. It has also boosted the share of sustainable tubes in key markets.

For instance, Colgate’s recyclable toothpaste tubes help reduce carbon emissions by lowering the need for new raw materials and cutting manufacturing energy use. The company estimates that each tube’s carbon footprint is reduced by up to 26% compared with traditional multi-layer tubes. colgate low carbon product design

Source: Colgate-Palmolive

This change decreases emissions from production and also supports Colgate’s broader goal of reducing Scope 3 emissions from product use and end-of-life disposal. These steps aim to reduce environmental impact not just from carbon, but from waste and resource use throughout the product life cycle.

Colgate’s Climate Actions Going Forward

Colgate’s climate goals are part of a broader strategy that links environmental sustainability with business performance. The company’s net-zero by 2040 goal shows a long-term focus on reducing emissions across its entire value chain.

Progress follows science-based benchmarks. The company updates its targets to align with changing climate science standards. Colgate faces challenges with indirect emissions from suppliers and products. Still, its targets and actions show a clear path for future reductions.

The sustainability strategy also helps with other goals. These include waste reduction, water conservation, and better packaging. In these areas, measurable progress boosts Colgate’s environmental profile. For example, high recyclable packaging rates play a key role.

Investors, customers, and community partners are increasingly watching how companies like Colgate balance growth with climate action. Colgate’s earnings and environmental efforts show how it stays competitive and supports its long-term climate goals.

From Ambition to Execution: How Europe’s Decarbonisation Agenda Performs on the Project Level

0

Europe positions itself as the global driver of the decarbonization agenda. Ambitious targets, regulatory reform and large-scale public funding define the direction. Yet behind the strategy, project pipelines narrow, execution slows down and many initiatives struggle to progress beyond early development. The gap between ambition and delivery continues to widen, making execution-level insight increasingly relevant.

At DECARBON 2026, this perspective takes center stage through insights shared by Marek Drywa, Senior Director Business Development at Worley. His presentation, “Decarbonisation agenda in Europe: market and project observations from the engineering contractor’s perspective,” examines how Europe’s decarbonization efforts perform when viewed from inside active projects.

Drawing on recent European project experience, Worley observes a slowdown since spring 2024 in both the volume and progression of decarbonization projects entering execution. While regulatory frameworks and public funding remain in place, fewer initiatives advance beyond planning into sustained implementation.

At the execution stage, delivery is increasingly shaped by technical complexity, operational constraints and coordination across stakeholders. Engineering timelines, asset readiness and integration challenges now play a more decisive role than strategic intent in determining project outcomes.

Practical perspectives from DECARBON 2026 build on hands-on experience across hydrogen, CCUS, energy storage, pipeline safety and low-carbon fuels. Speakers from LiveEO, SLB, Gasunie and ORLEN reflect on concrete challenges encountered across different segments of the value chain.

Taken together, these contributions highlight recurring structural constraints as well as effective approaches already being applied in practice. The discussion offers a realistic view of what currently supports progress in European decarbonization projects and where delivery continues to stall.

Join the discussion to gain practical insight into Europe’s decarbonization agenda and the realities of turning commitments into executed projects: https://sh.bgs.group/3py

Can Apple Balance Explosive Q1 2026 Growth with Its Net-Zero Promise?

Apple started fiscal 2026 with a powerful performance. The company reported record revenue, strong earnings growth, and accelerating demand across major regions. At the same time, Apple doubled down on its climate roadmap, highlighting renewable energy use, carbon credits, and ambitious emissions reduction targets. Together, these results show how Apple is balancing profit growth with sustainability leadership.

This analysis breaks down Apple’s Q1 2026 financial performance, regional growth drivers, market reaction, and its climate strategy in simple, easy-to-read language.

In Tim Cook’s words.

“iPhone had its best-ever quarter driven by unprecedented demand, with all-time records across every geographic segment, and Services also achieved an all-time revenue record, up 14 percent from a year ago. We are also excited to announce that our installed base now has more than 2.5 billion active devices, which is a testament to incredible customer satisfaction for the very best products and services in the world.”

Apple’s Q1 2026 Financial Results Show Strong Momentum

Apple reported $143.8 billion in revenue for its fiscal first quarter ended December 27, 2025. That was up 16% year over year, showing strong demand for its products and services.

The company also reported earnings per share (EPS) of $2.84, up 19% from last year. Net income reached $42.1 billion, up from $36.33 billion a year earlier. The board also approved a $0.26 per share dividend, reinforcing its commitment to returning cash to shareholders.

Overall, it beat market expectations on both revenue and profits, signaling strong execution across hardware and services.

Apple
Source: Apple

Greater China and India Drive Regional Growth

Apple saw broad growth across regions, but Greater China stood out as the top performer. Revenue from the region surged 38% year over year to $25.5 billion. Record iPhone sales and strong store traffic drove the jump.

Other regions also posted solid gains:

  • Americas: Revenue grew 11%
  • Europe: Up 13%
  • Rest of Asia Pacific: Up 18%
  • Japan: Up 5%

India was another highlight. Apple achieved quarterly records for iPhone, Mac, iPad, and Services in India. The installed base also grew at a double-digit pace, showing rising brand loyalty and expanding market penetration.

Tim Cook said iPhone demand was strong across all geographies, helping ease earlier concerns about slowing sales in China.

Apple Appl
Source: Apple

AAPL Stock Positive but Measured

Apple’s stock (AAPL) reacted positively after the earnings release on January 29. Shares rose about 1–2% in after-hours trading, reflecting investor confidence in Apple’s performance.

At the time of reporting, Apple stock traded around $259.48, up slightly during the day. Investors seemed encouraged by strong execution but remained cautious about rising AI-related spending and broader tech market uncertainties.

AAPL Apple Stock
Source: Yahoo Finance

Apple’s Climate Strategy: A Core Part of Its Business Model

Apple continues to position sustainability as a strategic priority. The company said it supports climate policies and works with policymakers and businesses to align with the Paris Agreement goal of net zero emissions by 2050.

Apple’s long-term goal is to become carbon neutral across its entire global footprint by 2030. The plan focuses on renewable energy, recycled materials, and low-carbon transportation.

It aims to:

  • Reduce emissions by 75% compared with its 2015 baseline
  • Address the remaining 25% through high-quality carbon removal projects
  • Use 100% renewable energy across its supply chain
  • Increase recycled materials in products, including 99% recycled rare earth elements in magnets

Significantly, Apple already achieved carbon neutrality for corporate operations in 2020, making it one of the first major tech firms to reach that milestone.

The company also promotes science-based targets, transparent emissions reporting, and high-quality carbon removal standards. Apple supports strict ESG criteria for carbon credits to ensure real environmental and community benefits.

Renewable Energy and Supplier Decarbonization

Apple reported that renewable energy procured by suppliers avoided about 21.8 million metric tons of greenhouse gas emissions in 2024.

Many semiconductor and display suppliers pledged to cut fluorinated greenhouse gas emissions by at least 90% by 2030. These gases are extremely potent, so reducing them can significantly lower the tech sector’s climate impact.

Apple also supports policies to expand renewable electricity globally, improve grid infrastructure, and invest in energy storage and transmission. The company encourages life cycle emissions assessments and high-integrity mitigation standards.

Use of Carbon Credits and Nature-Based Projects

Apple has used carbon credits to maintain carbon neutrality for its corporate emissions. The company retired credits from multiple certified projects, including: Chyulu Hills project (Kenya), Guinan afforestation project (China), Alto Mayo project (Peru), Cispatá Mangrove project (Colombia), and REDD+ forest conservation project (Guatemala)

These projects follow VCS and CCB standards, which aim to ensure environmental integrity and social benefits. Apple said it regularly updates its life cycle assessment models to improve transparency and accuracy.

apple emissions carbon credits
Source: Apple

Why Apple’s Financial and Climate Performance Matters

Apple’s strong Q1 2026 results highlight how sustainability and profitability can move together. The company’s revenue growth in China and India shows expanding global demand, while its climate strategy positions it as a leader in corporate decarbonization.

However, Apple’s reliance on carbon credits may attract scrutiny as regulators and investors push for deeper emissions cuts rather than offsets. The tech giant will need to show real reductions across manufacturing, logistics, and product life cycles to maintain credibility.

In conclusion, Apple’s fiscal Q1 2026 marked a powerful start to the year. Revenue and profits surged, driven by strong global demand and regional growth in China and India. Investors responded positively, though cautiously.

At the same time, Apple reinforced its climate ambitions with renewable energy investments, supplier decarbonization efforts, and carbon credit programs. With Apple 2030 approaching, the company faces a critical test: can it continue delivering record financial growth while cutting emissions at scale?

If Apple succeeds, it could set a blueprint for how Big Tech aligns growth with climate leadership in the coming decade.

Visa vs Mastercard: Strong Earnings Meet Rising Climate Pressure

Visa and Mastercard are two of the largest payment companies in the world. They process trillions of dollars in transactions each year. Their networks connect banks, merchants, and consumers across more than 200 countries.

Full year 2025 earnings show that both companies continue to grow, even as economic conditions remain uncertain. At the same time, investors and regulators are paying closer attention to sustainability and climate commitments. This article compares Visa and Mastercard with their latest earnings data, growth trends, and environmental strategies.

Earnings Show Strong Financial Performance

  • Earnings Check: Visa’s Momentum Continues

Visa reported strong financial results for its full fiscal year 2025. Net revenue reached $40.0 billion, an 11% increase from 2024. This growth was driven by higher payment volumes, stronger cross-border activity, and more transactions processed on its network.

Visa’s GAAP net income was about $20.06 billion, up from $19.74 billion in the prior year. Diluted earnings per share (EPS) grew to $10.20, compared with $9.73 a year earlier.

visa 2025 financial results
Source: Visa

On a non-GAAP basis, net income was roughly $22.54 billion, and non-GAAP diluted EPS reached $11.47, both showing double-digit growth year over year. Total payments volume processed on Visa’s network was 257.5 billion transactions, up 10% from the prior year. Visa’s payment credentials also grew, reaching 4.9 billion by year-end.

  • Mastercard Delivers: Solid Results and Strategic Shifts

Mastercard also reported strong results for the full year 2025. GAAP net revenue increased to $32.8 billion, up 16% from 2024. On a currency-neutral basis, revenue also grew close to 15%.

The company’s GAAP net income was about $15.0 billion, a 16% increase from the previous year. Mastercard’s diluted EPS rose to $16.52, up from $13.89 in 2024.

mastercard full year 2025 financial results
Source: Mastercard

On a non-GAAP basis, adjusted net income was $15.4 billion, and adjusted diluted EPS reached $17.01, reflecting 14–17% growth. Transaction activity stayed strong. Gross dollar volume rose by about 9%. Cross-border volume increased by 15%, and switched transactions were up by 10%.

Comparing Growth Drivers and Market Position

Visa and Mastercard share many growth drivers. Both benefit from rising digital payments, increased travel, and global e-commerce expansion. Cross-border transactions are especially important for revenue growth, as they generate higher fees.

Visa reported cross-border growth of about 13%, while Mastercard posted 15% growth in the same area. These figures show that international spending remains a key strength for both companies.

VISA vs MASTERCARD financials 2025

Visa’s larger network gives it higher total revenue. Mastercard, however, often reports higher EPS due to differences in cost structure and share count. Both companies continue to invest in technology, security, and new payment services.

Analysts expect Visa to maintain double-digit revenue growth, while Mastercard is expected to grow at high single-digit to low double-digit rates. These forecasts reflect confidence in long-term payment trends.

Why Emissions Matter for Payment Giants

Financial strength is only one part of the comparison. Sustainability has become a growing focus for payment companies, especially as investors demand clearer climate action.

Breaking Down the Carbon Numbers: 2024 Emissions

Both Visa and Mastercard publish actual greenhouse gas (GHG) emission numbers each year. These figures help show how much carbon each company produces from operations and its value chains.

  • Visa’s 2024 Emissions

In 2024, Visa shared detailed GHG emissions data. They used the GHG Protocol, which divides emissions into direct and indirect categories. Visa’s sustainability report shows its total operational emissions.

Scope 1 emissions were about 13,510 metric tonnes of CO₂e. For Scope 2, location-based emissions reached 73,448 metric tonnes of CO₂e.

Visa also reported 613,162 metric tonnes of Scope 3 emissions. These are indirect emissions from its value chain. They come from things like purchased goods, services, business travel, and employee commuting. This brings Visa’s total GHG emissions across Scope 1, 2, and 3 to roughly 700,120 metric tonnes of CO₂e in 2024. Scope 3 made up the largest share of these emissions, around 87.6% of the total footprint.

visa scope 3 emissions
Source: Visa

Visa continues to work toward decoupling its business growth from emissions, even as its operations expand. It measures its footprint each year and includes renewable energy and carbon offsets as part of its strategy to manage impact.

  • Mastercard’s 2024 Emissions

Mastercard also publishes verified GHG data. In 2024, the company’s total Scope 1, 2, and 3 emissions were 515,981 metric tonnes of CO₂e. This represents a 7% drop from 2023 and a 46% cut from the 2016 baseline.

Mastercard 2024 GHG emissions
Source: Mastercard

Mastercard’s Scope 1 and Scope 2 emissions made up about 10% of the total. The other 90% came from Scope 3 indirect emissions throughout its value chain. The company has cut emissions in several categories. It is also on track to meet interim targets approved by the Science-Based Targets initiative.

Mastercard’s environmental strategy focuses on cutting operational emissions. It also aims for 100% renewable energy in its offices and data centers. The company also uses tools and programs to help partners and consumers understand and reduce their own emissions.

These emissions figures help illustrate each company’s current footprint and progress. They provide concrete benchmarks as Visa and Mastercard work toward their long-term climate goals.

visa vs mastercard 2024 GHG emissions
Data from companies’ 2024 sustainability reports

Visa’s Path to Net Zero

Visa has committed to reaching net-zero emissions by 2040. This target aligns with the Science-Based Targets initiative (SBTi) and a 1.5°C climate pathway.

Visa achieved operational carbon neutrality in 2020. It maintains this status by using 100% renewable electricity across its global offices and data centers. This covers Scope 1 and Scope 2 emissions, as well as parts of Scope 3, such as business travel and employee commuting.

Visa also works to include sustainability in its products. It offers tools that help partners track the carbon footprint of transactions. The company supports initiatives related to greener transport and digital efficiency.

Visa’s approach focuses on reducing its own operational impact while enabling partners and customers to make more informed choices.

Mastercard’s Climate Playbook

Mastercard has also committed to net-zero emissions by 2040. Its target covers the entire value chain, including Scope 1, Scope 2, and Scope 3 emissions.

As of 2024, Mastercard reported a 46% reduction in greenhouse gas emissions from its 2016 baseline. Like Visa, Mastercard uses 100% renewable electricity for its operations.

One of Mastercard’s most visible initiatives is the Priceless Planet Coalition. The program aims to restore 100 million trees by 2025. As of 2024, the coalition had supported the planting of about 26 million trees.

Mastercard also provides tools that help consumers understand the carbon impact of their purchases. The company integrates sustainability standards into its supplier and partner programs.

Side-by-Side: How Their Climate Strategies Compare

Both companies share several similarities in their climate strategies. Each uses renewable electricity and has committed to long-term net-zero targets. Both also work with partners to extend sustainability beyond their own operations.

There are also differences in focus. Visa emphasizes operational neutrality and payment-based tools that support sustainable choices. Mastercard places more emphasis on measurable emissions reductions and large-scale environmental programs, such as reforestation.

Mastercard’s 46% emissions reduction since 2016 provides a clear progress metric. Visa’s early move to carbon neutrality in 2020 shows leadership in operational emissions.

Neither company directly controls most consumer emissions linked to card use. However, both aim to influence behavior through data, tools, and partnerships.

Looking Ahead: Profits, Payments, and Climate Pressure

Visa and Mastercard remain financially strong. Rising digital payments, global travel, and cross-border commerce continue to support earnings growth. Recent results show that both companies are well-positioned for the years ahead.

At the same time, sustainability expectations continue to rise. Regulators, investors, and consumers want clearer climate action from large financial companies. Both Visa and Mastercard have responded with net-zero commitments and measurable steps.

Challenges remain. Most emissions linked to payments sit outside direct operations. Reducing value-chain emissions will require broader collaboration with banks, merchants, and consumers.

Still, both companies have made climate strategy a core part of their long-term plans. Their progress shows how financial performance and sustainability goals are increasingly linked in the global payments industry.

Volkswagen Overtakes Tesla in Europe’s EV Market: A Turning Point for Clean Mobility

According to market researcher Dataforce (via Automotive News), Volkswagen reclaimed the top spot in Europe’s electric vehicle (EV) market in 2025, overtaking Tesla after a sharp rebound in battery-electric vehicle sales. The shift marks a major turning point in the region’s EV race and reflects bigger changes in competition, policy, and the role of carbon credits in the auto industry.

Europe remains one of the world’s most aggressive regions for electrification. Stricter emissions rules, rising fuel costs, and government incentives continue to push buyers toward electric cars. But the latest sales data shows that leadership in the EV market is no longer guaranteed for early pioneers.

Volkswagen’s EV Comeback Was Built on Scale and Choice

Volkswagen sold around 274,000 battery-electric vehicles in Europe in 2025, up 56% from the previous year. Tesla, by contrast, delivered roughly 239,000 units, a 27% decline year over year.

The reversal is striking. In 2024, Tesla outsold Volkswagen by nearly two-to-one. One year later, Volkswagen regained the crown by expanding its lineup and appealing to a wider group of buyers.

Several models drove the surge:

  • The ID.4 electric SUV sold more than 80,000 units, rising nearly 24%.
  • The ID.3 hatchback climbed over 44% to almost 79,000 units.
  • The ID.7 sedan and wagon saw explosive growth of more than 137%, with over 76,000 units sold.

These results show the power of a broad portfolio. Volkswagen offered vehicles across different price points and body styles, from compact hatchbacks to family SUVs and premium sedans. That breadth helped it capture buyers who might not have considered Tesla’s narrower lineup.

Globally, Volkswagen Group said its battery-electric deliveries rose 32% to nearly 983,000 vehicles, even as total vehicle sales dipped slightly. Europe remained its core EV market and a key driver of its decarbonization strategy.

Volkswagen tesla

Tesla’s European Slowdown Signals a Competitive Shift

Tesla still led in individual models. The Model Y remained Europe’s best-selling single EV, with more than 151,000 registrations in 2025, although sales dropped sharply from the prior year. The Model 3 ranked among the top sellers but lost ground to new competitors like Skoda’s Elroq.

The company struggled across most major European markets. Germany, once Tesla’s strongest growth engine in Europe, saw registrations fall nearly 48% to around 19,000 units. Other large markets also reported declines, reflecting intense competition and shifting consumer preferences.

Norway was a rare bright spot. Tesla sales rose there as buyers rushed to secure incentives before policy changes expected in 2026.

The broader trend suggests that Tesla’s first-mover advantage is fading in Europe. Legacy automakers are catching up with competitive models, local manufacturing, and strong dealer networks.

tesla ev sales
Source: Electrek

Europe’s EV Boom Continues Despite Market Shakeups

Jato Dynamics data shows that Europe’s battery-electric vehicle market grew by about 30% in 2025, reaching roughly 2.6 million units sold. That growth came despite economic uncertainty, high interest rates, and uneven government subsidies.

Several factors drove adoption:

  • Stricter EU emissions rules and fleet-average CO₂ targets
  • Expanding charging infrastructure across major cities and highways
  • Lower battery costs and improving vehicle range
  • A wave of new models across mainstream and premium brands

Analysts say consumers now have more choice than ever. That diversity is accelerating the transition away from internal combustion engines.

EV sales Source: Jato

The Global Competition Is Intensifying

Europe is only one battleground. Globally, competition is heating up even faster.

China’s BYD delivered more than 2.2 million battery-electric vehicles in 2025, surpassing Tesla’s roughly 1.6 million units. The Chinese automaker has rapidly expanded its lineup and global footprint, positioning itself as a serious rival in both emerging and developed markets.

In Europe, BYD still trails established brands like Volkswagen, BMW, Hyundai, and Kia. But its rapid growth signals that the global EV market is becoming more fragmented and competitive.

This competition could benefit consumers by lowering prices and accelerating innovation. It could also put pressure on margins across the industry, making carbon credit revenue and government incentives even more important to profitability.

Volkswagen-Tesla Shift Highlights Scale vs. Innovation

For investors, the Volkswagen-Tesla shift highlights two competing EV strategies.

Tesla (TSLA stock) represents innovation-driven growth. It leads in software, autonomous driving, and charging infrastructure. Its carbon credit revenue and energy business provide additional income streams.

Volkswagen represents a scale-driven transition. It has massive manufacturing capacity, strong brand recognition, and deep relationships with European consumers and regulators. Its ability to rapidly expand EV production shows how legacy automakers can pivot when policy and market conditions align.

The broader trend suggests that the EV market will not be winner-takes-all. Instead, it will be shaped by multiple players with different strengths, from Chinese manufacturers to European incumbents and U.S. tech-driven automakers.

Sustainability Strategies Are Becoming a Core Battleground

Volkswagen’s comeback is not just about sales numbers. It reflects a broader sustainability strategy. The company has committed to net-zero emissions across its operations and supply chain, with heavy investments in renewable energy, battery recycling, and low-carbon manufacturing.

The company is expanding battery production in Europe, using renewable electricity at several facilities. It is also working to reduce lifecycle emissions, including raw material sourcing and end-of-life recycling.

Tesla remains a leader in vertical integration, software, and battery efficiency. Its vehicles often have lower lifetime emissions compared to internal combustion cars, especially in regions with clean electricity grids. Tesla also invests in energy storage, solar, and charging infrastructure, reinforcing its clean energy ecosystem.

However, Europe’s focus is shifting toward lifecycle emissions, not just tailpipe emissions. That includes mining, manufacturing, logistics, and recycling. Automakers that can decarbonize their entire value chain may gain a competitive advantage in future regulations and carbon markets.

What This Means for Europe’s Climate Goals

Europe aims to cut transport emissions sharply by 2030 and reach net zero by 2050. Road transport remains one of the largest sources of emissions, making EV adoption critical.

Volkswagen’s surge in EV sales supports these goals by displacing internal combustion vehicles at scale. Tesla’s presence continues to push technology and infrastructure forward. Competition among brands accelerates innovation and lowers costs, thereby increasing adoption.

Carbon markets add another layer of accountability. Automakers that fail to reduce emissions face financial penalties or must buy credits, creating a strong incentive to electrify fleets.

ICCT findings reveal the critical impact of policies adopted in the past 3 years. Road transport emissions in the European Union were projected to peak at nearly 800 million tonnes of CO2 in 2025 and decline thereafter by around one-quarter by 2035. This accelerated decline reflects the impact of the transition from conventional cars to zero-emission vehicles.

Europe Road Emissions 

Europe EV
Source: ICCT

Tesla still leads in technology and brand recognition. But Volkswagen’s scale, product range, and regulatory alignment are proving powerful in Europe’s policy-driven environment.

As global competition intensifies and carbon markets evolve, the EV industry will increasingly be shaped by sustainability strategies, regulatory compliance, and lifecycle emissions performance.

Volkswagen’s rise past Tesla in Europe is more than a sales milestone. It is a sign that the clean mobility transition is entering a diverse and competitive phase. Automakers that combine scale, innovation, and carbon strategy will shape the future of transportation—and the future of carbon markets.

Clean Energy Investment Hits Record $2.3T in 2025 Says BloombergNEF: What Leads the Surge?

Global investment in clean energy reached a new high of $2.3 trillion in 2025, according to a major industry report. This total was 8% higher than in 2024, showing that investment in low-carbon technologies continued to grow despite economic uncertainty. Researchers say this shows the global interest in cutting greenhouse gas emissions and creating cleaner energy systems.

The figures come from the BloombergNEF Energy Transition Investment Trends 2026 report. BloombergNEF is a leading research provider that tracks investments in clean energy technologies and infrastructure.

The clean energy transition includes technologies such as renewable power, electric vehicles (EVs), grid improvements, energy storage, and climate-related tech companies. Together, these areas attracted record funding.

Breakdown of the $2.3 Trillion Investment

The global total of $2.3 trillion in 2025 covered several key clean energy sectors:

  • Electric transport: The largest category, with $893 billion invested. This includes electric vehicles and charging infrastructure, which are expanding rapidly around the world.
  • Renewable energy: About $690 billion went into renewable power such as wind, solar, and other clean sources. This was slightly lower than the previous year due to changing regulations in China’s power markets.
  • Power grids: Investment in grid systems reached $483 billion in 2025. This spending supports the transmission and distribution of clean energy.
  • Emerging sectors: Hydrogen received $7.3 billion, and nuclear energy received $36 billion.

Bloomberg Energy Transition Investment Trends 2025

Although total investment grew, renewable energy funding itself was down nearly 9.5% compared with 2024. This decline was mainly due to new regulatory rules in China, the world’s largest clean energy market.

Overall, clean energy spending has outpaced fossil fuel investment for a second year in a row. Fossil fuel supply investment fell by $9 billion in 2025, mainly due to reduced spending on oil and gas production and fossil power plants.

Global-energy-transition-investment-by-sector-BNEF

Regional Power Plays: Who’s Investing Where

Investment levels differ greatly by region. This shows the impact of policy, industry structure, and economic growth.

In the Asia Pacific, investment accounted for nearly 47% of the global total in 2025. China stayed the top market, investing around $800 billion in clean tech. This was despite some drops in its renewable sector.

India saw investment grow by 15%, reaching around $68 billion in 2025. The increase was driven by renewables, grid upgrades, and electrification projects.

The European Union grew its investment by 18% to about $455 billion, making it a major contributor to the global increase.

In the United States, investment increased by 3.5% to about $378 billion. This rise happened even though some federal policies slowed support for certain clean energy programs.

Global energy transition investment, by economy or region
Source: BloombergNEF

These patterns show that all regions invest in clean energy. However, the pace and focus vary based on local strategies and market conditions.

Trends Driving Clean Energy Investment

  • Electrified Transport Leads

Investment in electric transport, like EVs and charging stations, is now a key player in clean energy spending. In 2025, this area alone attracted $893 billion, making it the top category of global investment.

Electric vehicles are growing fast as battery costs fall and more models become available. Many countries and companies have set targets to phase out fossil fuel vehicles, which boosts demand for EV infrastructure.

EV sales share by region 2030 IEA

  • Renewable Power and Grids

Even though renewable investment dipped slightly, it still remained a large portion of the total. The $690 billion invested in renewables in 2025 supports new solar, wind, and other clean power plants.

Investment in power grids also grew, reaching $483 billion. Upgrading grids is essential to connect more clean energy to the places that need it. These upgrades include transmission lines, smart grid technologies, and energy storage systems.

  • Clean Tech Supply Chains and Finance

Investment in factories and supply chains for clean tech also expanded. In 2025, spending on clean energy supply chains reached $127 billion, a 6% increase from 2024. These funds went to battery factories, solar equipment production, and mining for battery metals.

Equity funding in climate-tech companies also rebounded strongly, rising to $77.3 billion — a 53% increase from the previous year. This was the first year of growth in equity funding after several years of decline.

In addition, energy transition debt issuance, loans, and bonds to finance clean energy projects reached $1.2 trillion, up 17% from 2024. This reflects strong interest from both public and private financiers.

Historical Context and Recent Growth

Clean energy investment has been growing steadily over the past decade.

In 2024, global energy transition investment reached about $2.1 trillion, surpassing the $2 trillion mark for the first time. This total was driven by electrified transport, renewable power, and grid investment.

In 2023, investment in clean energy surged to around $1.77 trillion, reflecting rising spending despite geopolitical challenges and market pressures. Electrified transport and renewables both hit new highs that year.

The jump to $2.3 trillion in 2025 continues this long-term growth trend, even though the rate of growth has slowed compared with earlier years. The annual increase dropped from more than 20% several years ago to 8% in 2025 as markets matured and conditions shifted.

Looking Ahead: The Road to $2.9 Trillion

Analysts expect clean energy investment to keep rising in the near term, though uncertainties remain.

BloombergNEF’s base-case scenario shows that global energy transition investment might hit about $2.9 trillion annually over the next five years. This will be above 2025 levels. It shows ongoing interest from both governments and companies.

The International Energy Agency (IEA) offers a broader forecast for total energy investment in 2025. Overall energy investment could reach around $3.3 trillion. This includes spending on both clean and fossil fuels. Clean technologies are expected to get over $2.2 trillion of that total. This would mean clean energy investment continues to outpace fossil fuel spending.

global clean energy investment 2025 by IEA
Source: IEA

Experts see these future figures as good signs. However, they say annual investment must grow a lot to reach long-term climate goals, like those in the Paris Agreement. To meet net-zero by 2050, analysts say the world may need to invest over $5 trillion each year by the end of this decade.

What The Record Spend Means for the Energy Transition

The $2.3 trillion clean energy investment in 2025 shows that countries, companies, and investors around the world continue to fund the energy transition. These funds support low-carbon technologies that reduce emissions and improve energy security.

Investment in electric transport helps shift away from fossil fuel vehicles. Renewable energy funding builds new wind and solar capacity. Grid and storage investment enables that power to reach homes, businesses, and industries.

Regional investment patterns show strong gains in the Asia Pacific, Europe, India, and the United States. However, China saw a slight drop in renewable energy funding.

The clean energy transition remains robust, though overall growth rates have slowed compared with earlier years. The trend also shows that climate goals are now a key part of economic and infrastructure strategies. Forecasts indicate a continued expansion of clean energy investment soon. However, meeting long‑term climate targets will need even greater flows of capital across all regions.

Top Carbon Credit Companies to Watch in 2026

Carbon credits are becoming a major part of how the world fights climate change. A carbon credit represents the removal or reduction of one ton of carbon dioxide or equivalent greenhouse gas. Companies use these credits to meet emissions targets or to help reach climate goals.

By 2026, analysts predict that carbon markets will be growing quickly. More firms are integrating carbon credit strategies into their business models. Some generate credits directly. Others build markets or invest in credits. This article highlights the top public companies that stand out in the carbon credit space.

Carbon Credit Market: Key Facts and Stats

The global carbon credit market is already large, and it is expected to grow quickly in the coming years. In 2025, the total carbon credit market was estimated at around $887 billion.

By 2026, it is projected to reach about $1.22 trillion, driven by stricter rules and corporate demand for offsets. This growth reflects rising demand from companies and governments that want to meet climate targets and comply with emissions rules.

The market includes credits created for reducing emissions and credits created for removing carbon from the atmosphere. Markets fall into two main types: compliance markets and voluntary markets.

  • In compliance markets, companies buy credits to meet legal limits.
  • In voluntary markets, firms purchase credits to enhance their sustainability and climate goals, but are not required to do so.

Compliance markets currently account for most of the market’s size. Voluntary markets are much smaller, amounting to about ~$2 billion only. 

carbon credit market projection

Many countries have set up carbon pricing systems or cap‑and‑trade programs to limit greenhouse gases. Over 70 countries now use some form of carbon pricing or carbon trading, which helps drive demand and creates a large pool of buyers and sellers.

These statistics show that carbon credits are no longer a niche environmental tool. They have become a major global market linked to climate policy and corporate emission reduction strategies.

Here are the top carbon credit innovators to put on your radar this 2026 and even beyond.

Tesla: Leading Carbon Credit Revenue

Tesla is known for electric vehicles, but it is also a major player in carbon credit markets. The company earns money by selling regulatory carbon credits to other automakers. These credits help other companies comply with emissions rules in the U.S., Europe, and China.

In 2024, Tesla earned about $2.76 billion from carbon credit sales, up from $1.79 billion in 2023. This marked a 54 % increase in one year and showed strong demand for emissions credits from legacy automakers.

Since 2017, Tesla has earned more than $10.4 billion from selling carbon credits. That revenue stream is crucial for the company’s finances. It matters more as competition in the EV market grows and profit margins shrink.

Tesla annual carbon credit revenue in 2024

Tesla’s credits come from producing zero‑emission vehicles that exceed regulatory targets. Companies that cannot meet those targets buy the credits. This dynamic makes Tesla both a leader in EVs and an innovator in carbon compliance markets.

Carbon Streaming Corporation: A New Model for Credits

Carbon Streaming Corporation is a different kind of public company focused on future carbon credits. Rather than building carbon projects itself, it finances project developers around the world and receives rights to future carbon credits in return.

This model works like a royalty or streaming deal. Carbon Streaming pays upfront to help projects get built. In exchange, it receives credits over time. This gives investors exposure to carbon credits without the complexities of running a project.

Carbon Streaming is listed on Canadian and U.S. markets under tickers such as NETZ and OFSTF. As carbon markets grow, the model could expand. More credits might come from forest protection, clean energy, or carbon capture programs. These would then boost its balance sheet.

carbon streaming corporation portfolio projects
Source: Carbon Streaming Corporation

This approach means Carbon Streaming can benefit from rising carbon prices and volumes in compliance and voluntary markets. Investors looking for direct exposure to carbon credit supply may find its growth model interesting.

Intercontinental Exchange: Exchange Infrastructure for Carbon Markets

Intercontinental Exchange (ICE) is a financial markets company known for running major exchanges. ICE supports carbon markets by providing the infrastructure for trading carbon allowances and credits. This includes platforms for compliance markets like the European Union Emissions Trading System (EU ETS) and other regional cap‑and‑trade programs.

Carbon credits and emissions allowances traded on ICE help companies meet regulated limits. By offering transparent pricing and reliable settlement, ICE reduces barriers for institutional participation. As carbon pricing systems expand globally, the need for strong trading infrastructure grows, too.

ICE is not a carbon credit producer. Instead, it is a market facilitator. Its platforms help buyers and sellers discover prices and exchange credits efficiently. This makes carbon markets more liquid and accessible for corporations and financial investors.

ICE carbon futures index
ICE Carbon Futures Index Family

For investors, ICE provides exposure to the growth of carbon markets without tying performance to any single project or credit type.

Xpansiv: Leading Carbon and Environmental Commodities Exchange

Xpansiv is a technology company that operates one of the world’s largest carbon credit exchanges for voluntary environmental commodities. Its platform, the Carbon Business Line (CBL), is used by companies trading voluntary carbon credits and other climate‑linked assets.

Xpansiv’s system has handled more than 250 million metric tons of carbon dioxide equivalent (CO₂e) transactions since 2020. In 2025, weekly trading volumes often exceeded 300,000 tons, with most credits coming from nature‑based projects like forestry and land restoration.

Xpansiv has also expanded its listings to include removal‑only credits and CORSIA‑compliant aviation credits. Its new partnership with the Korea Exchange (KRX) seeks to create a carbon credit trading market in Asia. This will connect KRX to Xpansiv’s global platform. This could increase liquidity and price discovery in new regions.

xpansiv benefits
Source: Xpansiv

Xpansiv offers investors a key role in carbon credits. It provides market infrastructure, which is important as trading volume and price visibility increase with rising demand.

Drax Group: From Power Generation to Carbon Removals

Drax Group plc is a British power generation company listed on the London Stock Exchange. In recent years, Drax has expanded into carbon removal projects, including bioenergy with carbon capture and storage (BECCS).

Drax has a carbon removals deal. They will provide 25,000 metric tons of CO2 removals using BECCS credits. The price starts at $350 per ton. These credits represent permanent carbon storage rather than simple emissions reductions.

Drax’s core power business has used biomass fuel. Now, it is shifting focus to carbon removals. This change places Drax in markets where high-quality credits are in demand. As markets shift toward removal‑based credits, companies with validated removal projects may gain a strategic edge.

drax power beccs process
Source: Drax

Drax gives investors a chance to tap into energy generation and new carbon removal credits. This area could grow as climate goals become more ambitious.

Why These Carbon Credit Innovators Matter

These companies represent different parts of the carbon credit ecosystem:

  • Carbon revenue streams: Tesla shows how compliance markets can create meaningful income from emissions‑reducing products.
  • Credit financing models: Carbon Streaming provides a way to invest in future carbon credits via streaming agreements.
  • Market infrastructure: ICE and Xpansiv build the platforms that make carbon trading efficient and transparent.
  • Carbon removal exposure: Drax participates in projects that generate high‑quality removal credits, helping meet tougher climate targets.

Key Carbon Market Trends to Track in 2026 and Beyond

Carbon markets will likely keep growing. This is due to stricter regulations and tougher corporate climate goals

global carbon credit market size 2030

The chart above shows a steady and accelerating rise in the global carbon credit market from 2024 to 2030. Market size grows from just over $110 billion in 2024 to more than $520 billion by 2030, which signals strong and sustained demand.

The upward curve becomes steeper after 2026, suggesting faster growth as climate rules tighten and more countries expand carbon pricing systems. It also reflects rising corporate demand as companies use credits to meet emissions targets.

Overall, the chart supports the view that carbon credits are shifting from a supporting role to a core market tied closely to regulation, compliance, and long-term climate strategy.

Here are key trends that could shape carbon credit investing:

  • Expansion of compliance markets: More regions are adopting emissions trading systems and carbon pricing.
  • Quality of credits: High‑integrity removal credits are gaining attention from corporations and regulators.
  • Voluntary market growth: Companies with net‑zero pledges will continue purchasing credits, especially removal‑based ones.
  • Market access: Easier trading through exchanges and platforms will help investors participate.

Carbon credit markets are becoming part of corporate strategy and financial planning. The five companies reflect both business models and market mechanisms that matter for sustainability‑focused investors in 2026 and beyond.

Microsoft Q2 FY26 Earnings: $81B Revenue, AI Momentum, and a 150% Jump in Water Use by 2030

Microsoft’s Q2 FY26 earnings show a company growing fast while facing new sustainability pressures. Revenue surged on strong AI and cloud demand, carbon removal commitments doubled, and data centers expanded. At the same time, rising water use highlights the environmental costs of AI. Together, the results show how Microsoft is trying to balance financial growth, climate action, and resource management as its AI-driven business scales.

Big Numbers, Bigger Momentum: Microsoft’s Q2 FY26 Performance

Microsoft reported strong results for the second quarter of fiscal 2026, ending December 31, 2025. The company’s total revenue was $81.3 billion, up 17% from the $69.6 billion reported in the same period last year.

Net income, the profit after expenses, was $38.5 billion. This figure rose 60% from about $24.1 billion in the second quarter of fiscal 2025. Microsoft also reported a diluted earnings per share (EPS) of $5.16. This was up 60% from $3.23 per share in the prior year. Operating income also increased by 21% year over year to was $38.3 billion. 

The tech giant also reported large growth in its cloud and AI-related businesses. Revenue from Microsoft Cloud reached $51.5 billion in the quarter. This was an increase of 26% compared with the prior year.

Breaking this down:

  • Intelligent Cloud revenue was $32.9 billion, up 29%.
  • Productivity and Business Processes revenue was $34.1 billion, up 16%.
  • More Personal Computing revenue was $14.3 billion, down 3%.
microsoft fy26 income statement
Source: App Economy Insights

The company also reported its remaining performance obligations, future contracted revenue yet to be recognized, at $625 billion. This was up 110% compared with the same time last year.

Microsoft continued to return cash to shareholders. In the quarter, it returned about $12.7 billion through dividends and share buybacks — an increase of about 32% year over year.

These results show that Microsoft continued to grow across major business segments in Q2 FY 2026. Cloud services and AI-related products remained key drivers of revenue growth. At the same time, personal computing revenue, which includes Windows licensing, Surface devices, and search advertising, experienced a small decline.

Despite these robust results, Microsoft’s stock fell about 11% after the earnings. It dropped by $52.95 to close around $428.68 in late trading after hitting a low of $421.11. This is due to investors’ concerns about slow cloud growth and high spending on AI.

Microsoft MSFT stock price

Alongside its strong financial performance, Microsoft is also taking major strides in its environmental commitments.

Carbon Removal Leadership: Doubling Impact in 2025

Sustainability remains central to Microsoft’s strategy. In 2025, the company more than doubled its carbon removal agreements to 45 million metric tons of CO₂, up from 22 million tons in 2024.

microsoft carbon removal contracts 2023-2025

These purchases include a mix of nature-based solutions. They cover forestry and soil carbon projects, plus direct air capture technologies. The agreements span North America, Europe, and Africa, targeting high-quality, verified removal credits with long-term permanence.

Microsoft’s move reflects a broader trend among tech giants committing to net-zero and carbon-negative strategies. Other big buyers are Amazon, Google, and Stripe. They’re investing in carbon removal to offset emissions that can’t be cut yet.

By securing long-term offtake agreements, Microsoft ensures these projects receive funding to scale operations and deliver measurable climate impact. Analysts predict that global corporate carbon removal purchases might exceed 150 million metric tons each year by 2030. This shows a fast-growing market that mixes corporate sustainability goals with investment chances.

AI’s Hidden Cost: Data Centers and Water Demand

Microsoft also released projections on AI-driven data center water consumption. With AI workloads surging, water use in Microsoft’s global data centers is expected to rise 150% by 2030 compared with current levels. That’s equal to using about 18 billion liters over the said period. 

The increase is mainly due to liquid cooling systems used to maintain GPU and CPU performance in AI servers. Water is essential to prevent overheating and maintain efficiency. Microsoft’s water needs are spiking hardest in dry areas.

  • In Phoenix (hit by 20 years of drought), the company cut its 2030 estimate from 3.3 billion liters to 2 billion by running hotter data centers.
  • Near Jakarta, Indonesia (a sinking city with drained underground water), the forecast dropped from 1.9 billion to 664 million liters.
  • In Pune, India (where shortages caused protests and a “No Water, No Vote” push), it fell from 1.9 billion to just 237 million liters—Microsoft wouldn’t say why.

As AI adoption grows, data centers will consume more energy and water, especially in regions with concentrated cloud infrastructure.

global data center water use projection Bloomberg

In an interview, Priscilla Johnson, Microsoft’s former director of water strategy until 2020, stated:

“Water took a back seat. Energy was more the focus because it was more expensive. Water was too cheap to be prioritized.”

Microsoft is now exploring solutions such as:

  • Advanced cooling technologies to reduce water intensity per compute unit
  • Use of recycled water in data centers where feasible
  • AI-driven energy and resource optimization to manage electricity and water demand

The company emphasizes that AI deployment must be balanced with sustainability practices, ensuring growth does not lead to unsustainable water consumption or carbon emissions.

Where Growth Meets Responsibility

Microsoft’s Q2 results show that growth and sustainability are connected. Investments in AI, cloud, and enterprise services boost revenue while increasing resource demand. The company’s carbon removal goals and energy-efficient data center plans help reduce environmental impacts.

Key metrics illustrate this balance:

  • Revenue growth of 9% year-over-year
  • Cloud revenue of $30.5 billion, up 12%
  • Carbon removal agreements totaling 45 million metric tons
  • Projected AI data center water increase of 150% by 2030

These initiatives demonstrate that Microsoft is trying to align profitability with long-term climate goals. Investing in clean technology, energy efficiency, and carbon removal shows that big companies can grow responsibly. This approach also helps reduce environmental impacts.

What Comes Next for AI, Climate, and Capital

Microsoft expects AI adoption to boost demand for:

  • Data center capacity
  • Cloud computing
  • Specialized hardware like GPUs

Analysts predict the global AI data center market could double by 2030, creating both financial and sustainability challenges.

The carbon removal market is also expected to expand. With 45 million tons already contracted, Microsoft’s continued leadership signals corporate influence in scaling carbon removal projects.

Forecasts show that voluntary carbon removal deals might exceed $15 billion each year by 2030. This growth is mainly due to tech companies, industrial firms, and financial institutions.

Water management in data centers is another critical area. Companies need to invest in better cooling and recycled water solutions to help meet rising demand while protecting local water resources. Microsoft’s transparency around water use provides a model for responsible AI deployment globally.

Overall, Microsoft’s earnings report not only reflects strong financial performance but also highlights the company’s sustainability leadership. Growth, carbon removal, and AI infrastructure are linked. They provide insights for companies like Microsoft trying to balance profit with environmental responsibility.

Royal Caribbean’s (RCL) Record 2025 Profits Meet Carbon Challenges of the Cruise Industry

Royal Caribbean Cruises Ltd. (NYSE: RCL) kicked off 2026 with strong financial results for 2025. The company’s success reflects a broader recovery and growth in the global cruise industry. Alongside financial gains, the industry faces growing scrutiny over environmental impact. 

Cruise ships are highly carbon-intensive per passenger, prompting major lines—including Royal Caribbean, MSC, Carnival, and Norwegian Cruise Line—to invest in cleaner fuels, energy-efficient technologies, and shore power solutions. 

This article looks at the cruise sector’s financial health, passenger growth, and environmental issues. It also discusses how companies are working to balance profits with sustainability.

Smooth Sailing: 2025 Profits and 2026 Outlook

Royal Caribbean Cruises had solid financial results in 2025 and a positive outlook for 2026. The company made nearly $18 billion in revenue in 2025, up from about $16.48 billion in 2024.

Net income also grew to about $4.27 billion, compared with roughly $2.88 billion the year before. Adjusted earnings per share (EPS) rose to $15.64, showing improved profitability.

Royal Caribbean Cruise financial results 2025
Source: Royal Caribbean Cruises

The company also generated a strong operating cash flow of about $6.4–6.5 billion and returned around $2 billion to shareholders during the year. Record cruise bookings and higher ticket prices helped drive these results.

Royal Caribbean’s board expects double-digit revenue growth in 2026, along with higher capacity. Adjusted EPS is projected between $17.70 and $18.10. Around two-thirds of 2026 cruise capacity is already booked at strong pricing, supporting this forecast.

Jason Liberty, the company CEO, remarked:

“2025 was an outstanding year, and the momentum is further accelerating into 2026… and we continue to see strong and growing preference for our leading brands and differentiated vacation experiences. We expect another strong year of financial performance with both revenue and earnings growing double digits, and we remain on track to achieve our Perfecta goals by 2027.”

After the earnings call, the company’s stock climbed over 6%, mainly due to strong 2026 guidance. 

Royal Caribbean Cruises RCL stock price

These results show not only a recovery from pandemic lows but also sustained demand for cruises. Analysts expect this trend to continue as global travel and premium leisure spending grow.

Passenger Waves: Cruise Industry Expansion and Emissions 

The global cruise industry is growing fast. Projections show over 38 million passengers by 2026, up from around 37.7 million in 2025. This growth follows strong momentum from 2024 and reflects overall travel trends.

cruise passengers outlook
Source: Cruise Lines International Association

Higher demand is encouraging cruise lines to add ships and expand routes. Royal Caribbean, for example, has ordered new Discovery Class vessels and is growing its river cruise segment with more ships planned through 2031. This shows long-term confidence in the market.

Carbon Wake: Cruise Emissions vs Other Travel

Cruising, however, has a higher environmental impact than many other types of travel. Cruise ships are among the most carbon-intensive forms of travel per passenger per distance traveled. This is because they need fuel not just to move but also to run cabins, restaurants, pools, and entertainment.

Even large, efficient cruise ships by Royal Caribbean emit around 250 grams of CO₂ per passenger-kilometer. That is higher than most long-haul flights or hotel stays. Onboard services and hotel-style energy use make cruises even more carbon-heavy.

For perspective:

  • A five-night cruise of 1,200 miles produces about 1,100 pounds (≈500 kg) of CO₂ per passenger.
  • A flight covering the same distance plus a hotel stay produces roughly 264 kg of CO₂ per person.

This means a cruise can generate about 2x the greenhouse gas emissions of an equivalent flight-and-hotel trip.

Trains and electric cars have much lower emissions per passenger. For example, traveling by national rail produces about 35 g CO₂ per kilometer, and international trains like Eurostar are even lower at 4.5 g CO₂ per kilometer.

The Carbon Footprint of Cruise Ship vs Major Travel Methods
Data source: Voronoi App

Other comparison insights:

  • Emissions per passenger-kilometer: Large cruise ships emit 0.43–0.65 kg CO₂, depending on occupancy and efficiency. Economy-class flights emit 0.15–0.20 kg, while high-speed rail is around 0.04 kg. Cruises can be 2–10x more carbon-intensive per passenger.
  • Fuel and technology impact: Using LNG instead of heavy fuel oil reduces CO₂ by 20–25%, but methane slip and upstream emissions can reduce gains. Air lubrication and optimized routing can cut fuel use by 5–10% per voyage.

Ship engines burn huge amounts of fuel. Amenities like air conditioning, theaters, pools, and restaurants add to the energy demand. Cruises remain a luxurious experience, but travelers should know that they usually have a higher carbon footprint than flights, plus hotels or land-based travel. This shows that while cruises are luxurious and convenient, they have a much higher carbon footprint than most other ways of traveling.

Cruise ships also emit sulfur oxides (SOx), nitrogen oxides (NOx), and fine particles, which can harm air quality in port cities and marine ecosystems. Many passengers also fly to and from cruise ports, adding more carbon emissions that are often not included in cruise footprint estimates.

How Cruise Lines Are Addressing Environmental Impact

Cruise companies, including Royal Caribbean, are working to reduce their environmental impact. Many aim to reach net-zero greenhouse gas emissions by 2050 or earlier.

Royal Caribbean’s Destination Net Zero strategy focuses on:

  • Alternative fuels: LNG-powered ships, biofuels, and fuel cell technology.
  • New ship technologies: Advanced hulls, air lubrication systems, and shore power connections.
  • Operational efficiency: Optimized routes and engine improvements to reduce fuel use per passenger.
Royal Caribbean Cruise emission reductions pathways
Source: Royal Caribbean Cruises

Other cruise lines are also taking action to tackle their environmental footprint: 

MSC Cruises used efficiency tools and smart itinerary planning to cut 50,000 tonnes of CO₂ in 2024. They are testing hybrid propulsion and shore power at multiple ports. Carnival Corporation is expanding LNG and biofuel use while increasing shore-side electrical connections. They are also researching carbon capture for ships.

Likewise, Norwegian Cruise Line (NCL) is adding LNG-powered ships, battery-assisted propulsion, and energy-efficient onboard systems. NCL is also expanding shore power at ports.

Disney Cruise Line uses hybrid exhaust gas cleaning, advanced wastewater treatment, and fuel-efficient hulls while eliminating single-use plastics onboard. Meanwhile, Princess Cruises applies energy-saving tech, waste reduction, and wastewater treatment, while testing LNG as a fuel alternative.

Overall, the cruise industry faces pressure to reduce carbon intensity. Cleaner fuels, new technologies, and operational efficiency are becoming standard. Environmental responsibility is now a key part of long-term business strategy.

Forecast Horizon: Growth, Finance, and Green Goals

Royal Caribbean and the cruise industry are financially strong. High bookings, growing revenue, and positive forecasts show that demand for cruises is rising. Investments in new ships and offerings aim to meet demand across different traveler groups.

Cruise forecasts show over 38 million passengers by 2026, highlighting ongoing interest. Electric and hybrid propulsion, shore power, biofuels, and fuel-saving technologies are slowly becoming standard.

Challenges remain. Reducing cruise carbon intensity to levels similar to other travel modes will require more alternative fuels, stricter rules, and continued innovation.

Still, many cruise lines have pledged net-zero targets, often aligned with global shipping goals. Passengers are also more aware of environmental impact, driving demand for greener cruises.

Balancing Growth and Emissions

Royal Caribbean’s strong earnings and positive outlook show a resilient and growing industry. Record bookings and strategic investments indicate financial health and long-term growth.

However, carbon emissions remain a major issue. Cruises generally produce more CO₂ per passenger than many other vacations. Cruising is also considered to emit the most emissions compared to other travel methods. Thus, the industry faces pressure to reduce this impact.

Understanding both the financial and environmental sides can help travelers make better choices. For cruise companies and policymakers, balancing growth with emissions reductions is key for the future of cruising.