A Guide to Compliance Carbon Credit Markets

Compliance Carbon Credit Market Overview

Carbon markets are generally divided into two main categories: voluntary carbon markets and compliance carbon markets.

Compliance carbon markets operate under laws or regulations that require certain companies or sectors to limit, reduce, or pay for their greenhouse gas emissions. Governments can use several approaches to put a price on carbon, including emissions trading systems (ETSs) and carbon taxes.

In an ETS, a government or regulator sets rules for covered emissions and creates a limited supply of allowances. Each allowance typically represents the right to emit one metric ton of carbon dioxide equivalent (tCO₂e). Companies that emit less than their available allowances may be able to sell surplus units, while companies that exceed their limits may need to buy additional allowances or other eligible units to meet their compliance obligations.

Unlike the voluntary carbon market, demand in compliance markets is created primarily by legal and regulatory requirements. This makes government policy one of the most important factors affecting allowance supply, demand, and prices.

Compliance carbon pricing has expanded significantly over the past decade. The World Bank reported that, as of April 1, 2026, 87 direct carbon-pricing instruments were in operation worldwide, including 40 emissions trading systems and 47 carbon taxes. Together, these systems covered just over 29% of global greenhouse gas emissions.

The growth of these systems has also increased the economic importance of carbon pricing. Direct carbon-pricing instruments generated more than $107 billion in public revenue in 2025, according to the World Bank.

Compliance carbon markets have expanded far beyond the handful of major systems that dominated the market when this guide was first published. Today, carbon pricing is used across national, regional, and subnational jurisdictions, with each system operating under its own rules, emissions coverage, and pricing mechanisms.

As a result, there is no single global compliance carbon credit price or one uniform model for carbon trading. The value of allowances and other eligible compliance units depends on government policy, emissions caps, economic activity, energy demand, market design, and the availability of supply.

Understanding these differences is essential for anyone seeking to understand how compliance carbon markets work and how they are evolving.

Compliance Carbon Market Landscape

The global compliance carbon market has expanded well beyond the small group of emissions trading systems that dominated the market a few years ago.

In 2026, 41 emissions trading systems (ETSs) are in force worldwide, covering about 26% of global greenhouse gas emissions, according to the International Carbon Action Partnership (ICAP). Three national ETSs — in Japan, India, and Vietnam — launched in 2026, while additional systems remain under development or consideration.
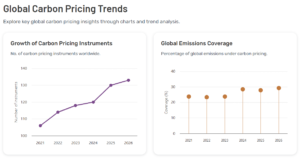
carbon pricing trend world bank 2026
Source: World Bank

When carbon taxes are included, the global carbon pricing landscape is even larger. The World Bank counts 87 implemented direct carbon pricing instruments in 2026, comprising 40 ETSs and 47 carbon taxes. Together, these instruments cover nearly 30% of global GHG emissions.

Major Compliance Carbon Markets

Several large systems continue to shape global carbon pricing:

  • European Union: The EU Emissions Trading System (EU ETS) remains one of the world’s largest and most established carbon markets.
  • China: China’s national ETS is the world’s largest emissions trading system by covered emissions and continues to expand its sectoral coverage.
  • California: California’s cap-and-trade program is a major North American carbon market and operates as part of the broader Western Climate Initiative.
  • United Kingdom: The UK operates its own ETS following its departure from the EU ETS.
  • South Korea: The Korea ETS remains one of Asia’s largest carbon markets.
  • New Zealand: The New Zealand ETS covers major parts of the country’s economy, including forestry.
  • Australia: The Safeguard Mechanism uses a baseline-and-credit approach to regulate emissions from large industrial facilities.
  • Japan, India and Vietnam: All three launched national ETSs in 2026, adding significant new sources of regulated carbon market demand.

Other compliance systems operate at the national, regional, or subnational level. The World Bank’s carbon pricing database tracks systems across North America, Europe, Asia, Latin America, Africa, and other regions.
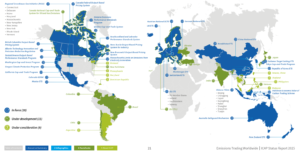
Global ETS Map of Current Compliance Credit Market Landscape
Source: ICAP

Carbon Market Revenues Are Growing

The expansion of compliance markets has also increased their financial importance.

ETSs generated a record nearly $80 billion in revenue in 2025, according to ICAP. Across carbon taxes and ETSs, the World Bank estimates that direct carbon pricing generated more than $107 billion for public budgets in 2025.

These revenues can support climate programs, clean energy investment, infrastructure, and other government priorities. The exact use of the funds varies by jurisdiction.

A More Fragmented Global Market

The growth of compliance carbon markets creates a larger global market but also increases fragmentation.

Each system has its own rules for emissions coverage, allowance allocation, caps, auctions, offsets, banking, borrowing, and compliance. Prices can therefore differ significantly between jurisdictions.

This fragmentation is also important for companies operating across multiple countries. A business may face different carbon costs depending on where its facilities operate and which emissions are covered by local regulations.

For investors and market participants, understanding the design of each individual system is therefore more important than treating compliance carbon markets as one global market.

  • The global compliance carbon market is no longer defined by three major ETSs. It is now a growing network of national, regional, and subnational systems, with governments increasingly using carbon pricing as a tool to reduce emissions and support the transition to lower-carbon economies.

So, let’s break down each major compliance credit market…

The European Union ETS

The European Union Emissions Trading System (EU ETS) is the world’s first major emissions trading system and remains the largest ETS by trading volume and value. It began in 2005 and covers the EU Member States plus Iceland, Liechtenstein, and Norway. Its main sectors include power, industry, aviation, and maritime transport. EU ETS-covered emissions account for about 40% of the EU’s total greenhouse gas emissions.

The system uses a cap-and-trade model. Companies must surrender one EU Allowance (EUA) for each tonne of CO₂ equivalent they emit. Allowances are allocated through auctions and, for some industries, free allocation.

EU ETS Emissions and Targets

The EU has steadily tightened the emissions cap. The current system is designed to reduce covered emissions by 62% by 2030 from 2005 levels. Since the ETS launched, emissions in its covered sectors have already fallen by about 50%. Verified emissions declined another 1.3% in 2025.

Maritime transport entered the EU ETS in 2024. A separate ETS2 covering buildings, road transport, and additional sectors is scheduled to begin auctioning allowances in 2027.

EU Carbon Allowance Prices

The 2026 EU ETS cap is approximately 1.185 billion tCO₂e for electricity, heat, industry, and maritime transport, plus 26.2 million tCO₂e for aviation.

The average 2026 auction price is about €73.43 ($82.97) per tonne, while the average secondary-market price is €74.35 ($84.01). Prices fluctuate with energy demand, economic conditions, fuel prices, allowance supply, and expectations about future climate policy.
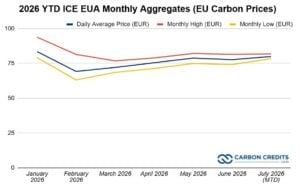
EU carbon prices futures from ICE

The EU’s Market Stability Reserve (MSR) also adjusts allowance supply to address major imbalances in the market.

EU ETS Revenue

The EU ETS has become a major source of climate-related funding. Auctions generated more than €43 billion in 2025, while total auction revenue since 2013 exceeded €258 billion by the end of 2025.

EU Member States and EU funds use this revenue to support clean energy investment, industrial decarbonization, and the broader energy transition.

The EU ETS remains a central part of Europe’s climate policy and is expected to become increasingly important as the bloc works toward climate neutrality by 2050.

California Cap-and-Trade Program

California’s Cap-and-Trade Program, now part of the state’s broader Cap-and-Invest Program, began in 2012 and is one of North America’s longest-running compliance carbon markets. It operates jointly with Québec’s carbon market through the Western Climate Initiative.

The program requires covered entities to surrender allowances equal to their greenhouse gas emissions. It covers large industrial facilities, electricity generators and importers, fuel suppliers, and other regulated entities. California’s program is designed to help achieve the state’s economy-wide target of reducing emissions 40% below 1990 levels by 2030 and reaching carbon neutrality by 2045.

California Carbon Allowance Prices

California allowances are sold through quarterly auctions and traded in the secondary market.

For 2026, California’s annual auction reserve price is $27.94 per allowance. In the August 2025 joint auction with Québec, California allowances cleared at $28.76 in the current auction and $28.50 in the advance auction.

The program also has a price-ceiling mechanism to limit extreme compliance costs. The 2026 price-ceiling sale price is $102.52 per allowance or price-ceiling unit.

California Cap-and-Trade Revenue

California generates significant public revenue from allowance auctions. The funds are deposited into the state’s Greenhouse Gas Reduction Fund and support programs intended to reduce emissions, improve air quality, expand clean transportation, and advance climate-related investments.

California’s carbon market is therefore both a regulatory mechanism and an important source of funding for the state’s climate policies.

The program continues to evolve as California prepares for its 2030 emissions target and 2045 carbon neutrality goal, with future changes expected to influence allowance supply, demand, and prices.

China National Emissions Trading System

China launched its national Emissions Trading System (ETS) in 2021, creating the world’s largest emissions trading system by covered emissions. The market initially focused on the power sector but has since expanded significantly.

In 2025, China officially added the steel, cement, and aluminum smelting sectors to the national ETS. The expansion brought about 1,500 additional facilities into the system and increased coverage to roughly 60% of China’s total greenhouse gas emissions.

The new sectors entered the first compliance cycle covering 2024–2025 emissions, with detailed allowance-allocation rules released in late 2025. The system is expected to tighten over time as China moves toward more stringent emissions benchmarks.

China Carbon Allowance Prices

China’s national carbon market trades China Emission Allowances (CEAs). Unlike the EU ETS, China’s system has historically relied heavily on free allocation and carbon-intensity benchmarks rather than a fixed absolute emissions cap.
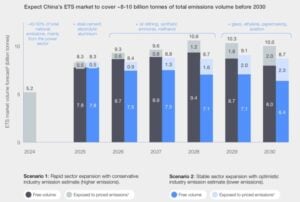
china compliance carbon market ets
Source: WEF Asia’s Carbon Markets Strategic Imperatives for Corporations, 2025.

Carbon prices remain significantly below those in the EU ETS. Market prices are influenced by allowance allocation, industrial output, energy demand, regulatory changes, and expectations about future tightening.

China’s Climate Targets

China has pledged to peak carbon dioxide emissions before 2030 and achieve carbon neutrality before 2060. The national ETS is one of the policy tools being used to support these goals.

The expansion into heavy industry marks an important change for China’s carbon market. As the system covers more sectors and allowance allocation becomes more stringent, its influence on industrial emissions and China’s broader carbon-pricing strategy is expected to increase.

Other Major Compliance Carbon Markets

The global compliance carbon market now extends well beyond the EU, California, and China. In 2026, 41 emissions trading systems (ETSs) are in force worldwide, covering about 26% of global greenhouse gas emissions. Another 16 systems are under development or consideration, according to the International Carbon Action Partnership.

Several established markets are important parts of this expanding network:

  • United Kingdom: The UK ETS began in 2021 after the country left the EU ETS. It covers energy-intensive industries, power generation, and aviation.
  • South Korea: The Korea ETS (K-ETS) launched in 2015 and covers about 78% of the country’s GHG emissions, making it one of Asia’s largest compliance markets.
  • New Zealand: The New Zealand ETS covers major sectors including forestry, industrial processes, and waste. The government has set unit-supply limits through 2030.
  • Australia: Australia’s Safeguard Mechanism regulates emissions from large industrial facilities using declining baselines and tradable Safeguard Mechanism Credits. The policy is being reviewed during 2026–2027.
  • Japan: Japan’s national ETS launched in 2026 as part of its GX policy framework.
  • India: India’s national Carbon Credit Trading Scheme began its transition toward an emissions-trading framework in 2026.
  • Vietnam: Vietnam launched its national ETS in 2026, initially focusing on major emitting sectors.

These newer systems reflect a broader shift toward emissions trading in emerging and developed economies. ICAP reports that ETSs are now operating in 14 G20 nations, while the World Bank finds that all large middle-income economies have either implemented or are planning direct carbon pricing instruments.

The result is a more diverse global compliance market. Each system has different rules for emissions coverage, allowance allocation, caps, offsets, banking, and trading. These differences mean that allowance prices and market risks can vary significantly between jurisdictions.

Compliance Markets vs. Carbon Credits

Compliance carbon markets and carbon credit markets are related, but they are not the same thing.

Most emissions trading systems primarily trade emissions allowances. An allowance gives a regulated company the right to emit a specified amount of greenhouse gases under that system. For example, one EU Allowance (EUA) represents the right to emit one tonne of CO₂ equivalent under the EU ETS.

Carbon credits are different. A carbon credit generally represents one tonne of greenhouse gas emissions reduced or removed by a project or program. Credits can come from activities such as methane capture, reforestation, renewable energy, or carbon removal.

Allowances vs. Carbon Credits

The key difference is how the units are created and used:

  • Compliance allowances: Created by a government or regulatory authority as part of an emissions trading system. Covered companies use them to meet legal emissions obligations.
  • Carbon credits: Generated by emissions-reduction or carbon-removal projects and typically represent one tonne of CO₂e reduced or removed.
  • Compliance markets: Operate under mandatory government rules, with demand driven by regulated entities.
  • Voluntary carbon markets: Allow companies and other buyers to purchase and retire credits voluntarily.

Some compliance systems allow certain carbon credits or other external units to be used for compliance, subject to specific rules. However, this does not make all carbon credits equivalent to compliance allowances. Eligibility depends on the jurisdiction and its regulations.

The World Bank tracks ETSs, carbon taxes, and carbon crediting mechanisms as separate categories within its global carbon pricing data.

This distinction is important when comparing prices. A compliance allowance and a voluntary carbon credit can both be quoted in dollars or euros per tonne, but their prices reflect different market structures, regulations, supply constraints, and compliance requirements. The World Bank also cautions that carbon prices across jurisdictions are not directly comparable because coverage and compliance arrangements differ.

Understanding this difference is essential when evaluating compliance carbon markets, carbon-credit markets, or investment products linked to either market.

Risks and Challenges in Compliance Carbon Markets

Compliance carbon markets can help reduce emissions, but they also face several risks that can affect companies, governments, and investors.

Policy and Regulatory Risk

Compliance markets depend heavily on government policy. Changes to emissions caps, allowance allocation, eligible sectors, compliance rules, or climate targets can affect both supply and demand.

As more jurisdictions introduce or expand carbon pricing, companies must also monitor changes across multiple regulatory systems. The World Bank counted 87 implemented carbon-pricing instruments in 2026, including 40 ETSs and 47 carbon taxes. This growing number of systems also increases regulatory complexity.

Carbon Price Volatility

Allowance prices can rise or fall as economic conditions, energy prices, industrial output, weather, emissions levels, and policy expectations change.

Some markets use mechanisms to manage excessive price movements or supply imbalances. For example, the EU ETS uses a Market Stability Reserve (MSR) to adjust allowance supply. In 2026, about 190.5 million EU allowances are scheduled to be placed into the reserve between September 2026 and August 2027.

Oversupply and Allowance Scarcity

An ETS can become less effective if too many allowances remain available. Oversupply can weaken the carbon-price signal and reduce incentives to cut emissions.

The opposite problem can also create challenges. A shortage of allowances can push prices sharply higher and increase compliance costs for businesses. Well-designed market-stability mechanisms aim to balance these risks.

Carbon Leakage and Competitiveness

Companies operating in carbon-priced jurisdictions may face higher costs than competitors in regions with weaker or no carbon pricing. This can create concerns about carbon leakage, where production or investment shifts to jurisdictions with less stringent climate policies.

Governments use measures such as free allowance allocation and border carbon measures to address these risks. The EU, for example, continues to provide some free allowances to sectors considered vulnerable to carbon leakage.

Fragmented Global Markets

There is no single global compliance carbon market. Each jurisdiction can use different rules, allowance designs, emissions caps, and compliance requirements.

As a result, carbon prices are not directly comparable across markets. The World Bank specifically notes that differences in coverage, compliance requirements, and compensation arrangements make cross-market price comparisons difficult.

These challenges mean that compliance carbon markets require ongoing policy oversight and careful market design. For businesses and investors, understanding the specific rules of each market is essential before assessing its carbon price, compliance costs, or investment potential.

Investing in the Compliance Carbon Credit Markets

Compliance carbon markets can provide investment exposure to carbon prices, but they differ significantly from traditional commodity and financial markets. Their performance is closely linked to government policy, emissions caps, energy markets, and economic activity.

Direct participation is also not the same in every jurisdiction. Some markets restrict who can hold or surrender compliance allowances, while financial exchanges offer derivatives that provide price exposure without requiring investors to directly manage allowances.

How Investors Can Gain Exposure

One of the main routes is through futures and options linked to carbon allowances. For example, ICE Endex lists futures and options based on EU Allowances (EUAs). A standard EUA futures contract represents 1,000 EUAs, with each EUA representing one tonne of CO₂ equivalent. ICE also offers smaller EUA contracts and EUA options.

Other exchanges offer derivatives linked to regional compliance markets, including California carbon allowances and the Regional Greenhouse Gas Initiative (RGGI).

Investors may also gain indirect exposure through financial products, companies involved in carbon market infrastructure, or businesses whose costs and revenues are affected by compliance carbon prices. The availability of these products varies by market and jurisdiction.

Key Investment Risks

Compliance carbon markets carry several important risks:

  • Policy risk: Governments can change emissions caps, allocation rules, eligible sectors, or other market regulations.
  • Price volatility: Allowance prices can respond sharply to energy prices, economic conditions, emissions levels, and policy expectations.
  • Market-design risk: Changes in allowance supply can significantly affect prices.
  • Regulatory differences: Each compliance market has its own rules, making global exposure more complex.
  • Liquidity risk: Smaller or newer markets may have less trading activity than established systems such as the EU ETS.
  • Derivatives risk: Futures and options can involve leverage, margin requirements, and the potential for losses beyond an initial investment.

The expansion of compliance carbon markets does not remove these risks. Instead, it creates more markets with different regulatory and economic drivers.
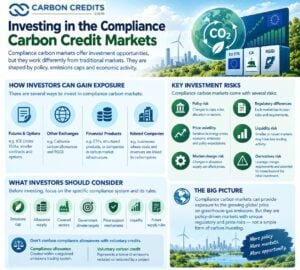
Investing in the Compliance Carbon Credit Markets

What Investors Should Consider

Before investing, investors should understand the specific compliance system behind the product. Key factors include the market’s emissions cap, allowance supply, covered sectors, government climate targets, price-support mechanisms, trading liquidity, and rules governing future supply.

Compliance carbon allowances should also not be confused with voluntary carbon credits. An allowance is created within a regulated emissions trading system, while a carbon credit generally represents a tonne of emissions reduced or removed by a project.

Compliance carbon markets can therefore offer exposure to the growing global price on greenhouse gas emissions, but they should be evaluated as policy-driven markets with significant regulatory and price risks, rather than as a simple form of carbon investing.

The Bottom Line

Compliance carbon markets have grown from a small number of regional systems into a global network of 41 emissions trading systems and 47 carbon taxes.

These markets now cover more than 29% of global greenhouse gas emissions, while direct carbon pricing generated more than $107 billion in public revenue in 2025. New national ETSs in Japan, India, and Vietnam are further expanding the global carbon pricing landscape.

The EU ETS, California’s cap-and-trade program, and China’s national ETS remain important markets, but they now operate alongside dozens of other systems with different rules and price structures.

For companies, understanding these markets is increasingly important as governments tighten emissions policies and carbon costs become a larger part of business decisions. For investors, compliance carbon markets can provide exposure to carbon prices, but they also carry significant policy, regulatory, market, and price risks.

The key point is that there is no single global carbon price or compliance market. Each system has its own rules, emissions coverage, allowance supply, and compliance requirements.

As carbon pricing expands, these differences will remain central to how compliance carbon markets develop and how businesses and investors participate in them.

EC Grants €1.1bn to Clean Energy Projects from EU ETS Revenues

The European Commission (EC) granted €1.1 billion to support clean energy projects from the EU Emissions Trading System (ETS) fund.
 
The EC signed agreements to grant 7 projects that support the EU’s climate transition. The funding is from the Innovation Fund, sourced from the EU ETS. This Fund comes from 450 million allowances from the current EU ETS in 2021/30.
 
Under the EC’s Fit for 55 proposals, 50 million allowances more will be added to the fund from the revised ETS. There will also be 150 million allowances more from transport and buildings emissions.

The 7 Clean Energy Projects Financed by EU ETS

The projects aim to reduce emissions by over 76Mt of CO2eq during the first 10 years of their operation.
 
These projects are using innovative low-carbon technologies at an industrial scale. They span various major sectors like hydrogen, biofuels, solar energy, cement, steel, and chemicals. The carbon capture and storage are also covered.

Here is a sneak peek of the clean energy projects granted by the EU ETS Fund:

Kairos@C in Belgium. This project aimed to avoid emissions of 14 Mt of CO2eq. It intends to make the first and biggest cross-border carbon capture and storage.
 
BECCS at Stockholm. This other one plans to avoid 7.83 Mt of CO2eq. It will create a Bio-Energy Carbon Capture and Storage (BECCS) facility at a heat and power biomass plant. BECCS will use both CO2 capture and heat recovery.
 
Hybrit Demonstration in Sweden. This project will replace fossil-based technology with green alternatives like hydrogen use. Thus, it will revolutionize the iron and steel industry in Europe, avoiding about 14.3 Mt of CO2eq.
 
Ecoplanta in Spain. Among the clean energy projects supported by EU ETS, this one will hit the smallest CO2 avoidance of 3.4 Mt of CO2eq. It will use waste to deliver a first-of-a-kind commercial plant in Europe, recovering 70% of CO2 in waste.
 
K6 Program in France. Meant to avoid 8.1 Mt of CO2eq, this program will produce the first carbon-neutral cement in Europe. It will do so by using an airtight kiln and cryogenic carbon capture technology and will store CO2 in the sea.
 
The TANGO project in Italy. This one avoids the highest 25 Mt of CO2eq by producing high-performance PV modules and multiplying capacity by 15x more (200 MW – 3 GW).
 
SHARC Project in Finland. This Sustainable Hydrogen and Recovery of Carbon project aims to avoid over 4 Mt of CO2eq. It will reduce emissions by using renewable hydrogen and carbon capture technology.

EU’s Transition to Green

According to the European Green Deal, funding those clean energy projects via EU ETS is “… a smart investment into the decarbonization and resilience of Europe’s economy.”
 
Also, it raises Europe’s stance on clean technology while helping speed up its green transition.
 
Better yet, the shift to renewable energy is the key to reducing emissions and reaching the EU’s net-zero goal in 2050. And the funding from the EU ETS to support those clean energy projects is one step toward that.

Climeworks Raises $650 Million to Scale Up Its Carbon Removal Technology

Climeworks, a Swiss startup, has raised $650 million for scaling up its carbon removal technology (direct air capture).

Global GHG emissions should peak before 2025 to avoid disastrous climate change effects, according to a report by the IPCC. It says that the world has to act now to prevent warming from going beyond the critical temperature of 1.5°C.

Such a scenario does not only need massive reductions in carbon emissions. It also requires removing the existing CO2 in the air. And Climeworks is one of the startups that provides a means to do it.

Climeworks Carbon Removal Technology

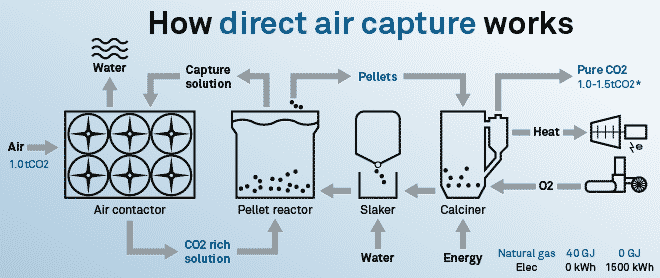
Climeworks is running the biggest carbon removal plant in the world, based in Iceland. This direct air capture (DAC) technology traps CO2 and injects it into the underground.

The image below illustrates how this carbon removal technology works.

As shown above, it works by moving huge quantities of air through a special chemical that filters out CO2. It functions like a magnet that attracts iron fillings.

The captured air is heated to release the pure CO2 stream that is then pumped deep underground, where it becomes stone.

Currently, Climeworks’ DAC plant can capture only around 4,000 tons a year. This corresponds to the yearly emissions of about 600 people only residing in Europe.

So, if Climeworks wants to have significant contributions to meeting climate goals by 2050, it has to scale up its DAC operations. This is why the funding is very important for its purpose of scaling up.

Where Will the Equity Funding Go?

So far, the $650 million equity funding is the biggest amount ever raised by a carbon removal company.

The financing is from some of the most renowned and largest institutional technology investors. These include Partners Group, BigPoint Holding AG, GIC, and Global Founders Capital. Other investors are from Baillie Gifford, Swiss Re, John Doerr, M&G, and more.

The funding will help unlock the next phase of Climeworks’ carbon removal growth, ramping up its DAC to a multi-million-ton capacity.

The startup will use the money to build a 40,000-ton DAC plant with the goal of capturing over a million tons a year by 2030.

When asked about the plant’s location, the CEO, Christoph Gebald, said, “Iceland is a top favorite because of its excellent geology.”

Other potential locations are Norway and Oman. Or it could be somewhere else in North America where there is access to cheap green energy. This is vital due to the nature of the direct carbon removal process.

The DAC technology is very energy-intensive because of the procedures involved. And thus, using only renewable or carbon-free energy is a must so as not to negate its goal of cutting emissions.

Right now, Climeworks’ direct competitors are the Canadian startup Carbon Engineering Ltd. and the US-based Global Thermostat.

Meanwhile, Climeworks continues to scale up. It was a Venture Kick winner in 2010, a Venture Leader in 2017, and one of the TOP 100 Swiss Startups from 2011 to 2014.

The startup expects to grow and reach 400 workers by the end of next year, up from 180 employees today.

Stellantis Plans to be Carbon Net Zero by 2038 Without Tesla

Stellantis, the 6th largest automotive firm worldwide, revealed its plan to become carbon net zero by 2038.

The automaker owns 14 different car brands. These include famous ones like Fiat, Chrysler, Dodge, Ram, Jeep, Alfa Romeo, Citroen, Peugeot, and Maserati.

The company seeks to be the industry champion in fighting climate change. It uses its 2021 emissions as a baseline to reduce Scope 1 and 2 by 50% in 2025 and 75% in 2030.

And unlike most auto companies that plan to hit net zero goals by 2050, the automaker aims to achieve it by 2038.

Stellantis 2021 Baseline for Carbon Net-Zero Plan

In 2021, Stellantis Scope 1 emissions equal to over 1.6 million tonnes of CO2eq, while Scope 2 emissions amounted to 2.2 million tonnes of CO2eq. This translates to 0.663 tons of CO2eq per vehicle manufactured.

Here is the company’s breakdown of GHG emissions per region for 2021 for more details.

Stellantis Carbon Emissions

When it comes to tracking and managing its carbon footprint and targets, Stellantis follows the SBTi (Science-Based Target Initiative) method.

For 2021 alone, the automaker’s emissions of CO2 eq for cars sold in Europe only is equal to 136 million tonnes.

The images below show the firm’s main emission items by activities per emissions scope.

Stellantis Scope 1-2

Stellantis’ initiatives in the previous year allowed it to reduce direct emissions (Scope 1 + 2) by 49,924 tonnes of CO2eq. This is equivalent to 8.8 kg of CO2eq per vehicle produced.

For instance, the electrification ramp-up and technical improvements to its cars reduced significant emissions. This particularly involves its battery electric vehicles (BEVs) and low emission vehicles (LEVs).

The LEV models sold in 2021 accounted for 12.8% of passenger cars in Europe and 3.4% (cars and trucks) in the US.

In line with Stellantis’ carbon net-zero target, it plans to make LEV sales become 100% in Europe and 50% in the US in 2030. Likewise, the automaker also aims to have more than 75 BEVs and earn BEV sales of 5 million vehicles by the end of this decade.

For the same year, Stellantis also managed to invest over €6.3 million in energy savings, corresponding to about €1.1 per vehicle produced. It was also able to gain a share of decarbonized electricity of 45%.

Stellantis Carbon Emissions Roadmap

To become carbon net-zero in 2038, the automaker focuses on the following main levers.

Short term 2025:

  • Energy management in all plants

  • Energy-efficient projects

Medium-term 2030:

  • Site compression and improvement of industrial footprint

  • Use and production of renewable energies

Long term 2038:

  • Technical innovations (e.g. Hydrogen, Power to gas)

  • CO2 capture and storage

  • Compensation of residual emissions

In addition, the firm continues to invest in CO2 reduction projects. This entails taking part in major emissions allowance schemes. These include the EU ETS and the Canadian Federal Output-Based Pricing System (OBPS).

Stellantis implemented two distinct internal carbon prices to aid its investments.

The first one refers to the shadow price of carbon. Its purpose is to show industrial climate-related risks and opportunities to guide the firm on which projects to invest in.

The other one is called the internal carbon price. This is to measure the cost efficiency of Stellantis’ technical levers that reduce vehicle emissions.

Finally, to make its reduction efforts run smooth, the firm links its 3 major CSR issues to its net zero ambition. These are:

  • Vehicle CO2 emissions (100% nameplates with BEV offering in EU and US)

  • Industrial and sites carbon footprint (Scope 1 and 2 emissions are net-zero)

  • Carbon footprint of the supply chain: purchasing and logistics
    (carbon net-zero per Paris Agreement)

On top of its carbon net-zero plan, Stellantis also aims to double its net revenues to $335 billion by 2030. This and sustain its big profit margins while growing efforts to electrify its cars.

PNG Suspends New Carbon Credit Deals While Writing New Rules

The government of Papua New Guinea (PNG), suspended new voluntary carbon credit projects while making new rules to govern them.
 
PNG decided to develop a stronger legal framework governing voluntary carbon credit deals. These carbon credit schemes are arrangements made between developers and resource owners directly. Government is not part of the negotiation.
 
While PNG is creating new laws, the environment ministry, Wera Mori, set a moratorium on new carbon deals. This action was due to red flags raised over a new carbon credit deal in the Oro province.
 
The temporary ban covers all the new carbon deals. The ministry said that this is “… To ensure proper stock take and audit of existing voluntary carbon projects.”

Why PNG Bans Voluntary Carbon Credit Deals

The moratorium came after an industry watchdog, got the government’s attention. The group faulted the 100-year carbon credit scheme in Oro province, citing a lack of key details.
 
They also called on Verra, a global certifying body for voluntary carbon standards, to reject the Oro deal.
 
In response, the PNG government banned the deal and other new carbon credit schemes in the meantime. But once the new regulations are in place, the voluntary carbon market in the country will be open again.
 
Though the suspension will impact the carbon credit market big time, it’s a must. In fact, the Oro province governor, Gary Juffa, said that it’s well overdue.
 
Juffa noted that this has been the case for far too long already. The so-called “carbon cowboys” have been collecting big profits from carbon credit deals. But they are giving the forest stewards and caretakers in the province very little.
 
The coalition of other concerned society groups is also pressuring the government to have strict rules regulating the market. They said that there are already voluntary carbon projects in every part of PNG.
 
Without the safeguards like free, prior, and informed consent (FPIC), the market will take advantage of the native landowners.
 
FPIC is a legal tool meant to protect native landowners against commercial loggers.

The Carbon Credit Market and PNG

Carbon credits are regarded as a pivotal means for countries to hit net-zero emissions goals. Unfortunately, outside Europe, the voluntary carbon credit market remains unregulated. And the case of PNG is one example.
 
The country is home to the world’s 3rd largest tropical rainforest. It keeps 7% of the earth’s biodiversity, making PNG so attractive to carbon financiers.
 
Even more important, protecting the forests is vital to PNG’s climate goals. That is to halve emissions by 2030 and be carbon neutral by 2050.
 
Also, PNG has been the world’s biggest tropical timber exporter since 2014. But, over 70% of timber production in the country is illegal, according to reports.
 
So, if carbon cowboys continue to sway landowners to do unregulated carbon projects, the forests will be at risk.
 
Hence, having safeguards on these projects is crucial for PNG’s carbon market to thrive, ensuring that there is proper oversight. 

IPCC AR6 Report on Climate Change: We Must Act Now

The Intergovernmental Panel on Climate Change (IPCC) released the third and final installment of its AR6 report on climate change.
 
The report is Working Group III’s contribution to IPCC Sixth Assessment Report (AR6). It was published today after getting the approval of 195 member governments of the IPCC.
 
Along with the two other AR6 reports, this report is vital for climate science analysis. 
 
In general, it provides scientific data on annual GHG emissions from 2010 to 2019. It also lays out potential solutions on how to reduce emissions. These solutions are the consolidated ideas of 278 scientists from 65 countries.

Evidence Presented in IPCC AR6 Report on Climate Change

The key message of the report is this: to make our planet safe for the next generations, we must act now. It means the entire world needs urgent action to reduce GHG emissions across all sectors.
 
Otherwise, the goal to limit global warming to the critical 1.5 degrees Celsius is beyond reach.
 

The IPCC’s AR6 report on climate change shows scientific evidence why we should act now or it would be too late.

From 2010 to 2019, the average annual global GHG emissions were at their highest historical levels, as shown below.

Figure SPM.1: Global net anthropogenic GHG emissions (GtCO2-eq yr-1) 1990–2019

Though the rate of increase has slowed down, the next few years’ warming reductions are critical.
 
The assessment indicates that getting to 1.5°C requires GHG emissions to peak before 2025, at the latest. Then the emissions must go down by 43% by 2030. Meanwhile, a reduction of around a third in methane is also a must.
 
In the words of the IPCC Chair, Hoesung Lee, “We are at a crossroads. The decisions we make now can secure a liveable future. We have the tools and know-how required to limit warming.”
 
Lee also noted that there are climate actions taken by countries that are proving effective. Likewise, there has been a consistent decrease in the costs of renewable energy of up to 85% since 2010.
 
Another essential report highlight is the creation of policies that improved energy efficiency. Also, global efforts had lowered deforestation rates while enhancing the use of renewables.
Figure SPM.3: Unit cost reductions and use in some rapidly changing mitigation technologies
But still, more concerted efforts to achieve massive emissions reductions are necessary.

IPCC’s AR6 Solutions to Mitigate Global Warming

The AR6 report outlines climate mitigation strategies that cover all the major sectors. These include energy, transport, buildings, urban, industry, forestry, and agriculture.
 
Scientists in the IPCC believe that if those climate mitigations will take effect, the world can at least reduce emissions by half by 2030.
 
While rapid reductions have to occur across the board, the biggest impact will be from the energy sector. This means significant reductions in fossil fuel use and widespread electrification. It also calls for more energy efficiency and the use of alternative fuels like hydrogen.
 
In other main emitter sectors, the same solutions may also help reduce emissions. Carbon capture and storage can also be a potential option to help mitigate warming.
 
Finally, IPCC’s AR6 report on climate change stresses the need to consider other means. The two important ones are closing global investment gaps and achieving SDGs.
 
All three IPCC AR6 reports will be synthesized and published in September right before the major COP27 happens in Egypt.

India’s Ambitious Climate Goal Threatens by the Power Sector

India’s lofty climate goal is at risk due to the financial problems that power retailers face, along with other issues.

Part of the country’s green plan is to increase renewable energy capacity by the end of 2022.

But estimates from BloombergNEF reveal that India is likely to miss its 175 GW target. This translates to around 36% of failing to achieve such renewables goal.

This scenario is an indicator that the country is having structural issues on its way to net zero. The power suppliers, in particular, which control about 90% of the nation’s electricity supply are one of the main culprits.

How Hard is it to Achieve India’s Climate Goal?

The financial distress of India’s power retailers is the key reason why its 2022 target seems to fail. They struggle to pay off debts and recover losses, affecting their service delivery.

Such a situation led to power suppliers’ missed payments to power producers. In effect, it also impacts other transactions across the industry, hindering growth.

For instance, wind projects that won government auctions did not manage to take off. This is largely linked to the issues confronting the distribution utilities.

Thus, industry experts believe that it’s imperative not to rely on state power retailers in hitting India’s climate goal.

Otherwise, it will put the nation’s climate goals at risk.

One way to expand its renewables target is to use new technologies like green hydrogen. This prompted the government to use extreme measures to offer citizens affordable, clean energy.

Unfortunately, the quest for clean energy has driven energy prices too high. This makes things even more challenging for the nation to advance its climate plan. Other major factors are also at play.

Too many policy changes and tax matters.

“Renewable energy is a business where making the most out of the investment is vital”, the CEO of a solar power developer said. But, if there are too many changes in a policy that affect the cost, growth in the sector becomes slow.

Also, taxes and import tariffs increases caused uncertainties in costs. For example, a sharp rise in renewable energy equipment taxes, from 5% to 12%, hit power developers so hard.

Likewise, major solar power developers in India are dubious about the new import tax. They are forced to delay big solar projects, holding 900 MW, because of a high customs tax of 40%.

Such is the case with the renewables partnership between Scatec ASA and Acme Solar Holdings. There are other renewables projects that can largely contribute to India’s climate goal. But those structural issues are putting them on hold.

So, What Comes Next for India?

India managed to report some renewables achievement, 152.9 GW + 72.6 GW, powered by hydro, solar, and wind. But still, such figures are too far from India’s ambitious climate goal set by Modi at the COP26 summit.

The country seeks to have 500 GW of renewables by 2030, getting huge interest from investors.

Yet, what’s even more critical than winning investors’ attention is fixing the major problems hurting the power sector in India.

Netflix Bought 1.5 Million Carbon Credits in 2021

The streaming giant, Netflix, bought 1.5 million carbon credits in 2021.
 
The technology company said that such an amount of carbon offsets had cut down its scope 1 and 2 emissions by 10%. The carbon credits were from 17 carbon projects the firm chose from more than 150 million tonnes.

Projects Comprising Netflix Retired Carbon Credits

Most of the projects are under Verra, a global carbon crediting organization.
 
One of them is the Vida Manglar Blue Carbon. The project is for protecting the mangroves and biodiversity of the Colombian Caribbean. It accounts for the full value of mangroves as a nature-based climate solution.
 
Netflix also retired carbon offsets from various projects verified in the Verra registry. These include the Chyulu Hills REDD+ Project which protects 410,000 hectares of forest in Kenya.
 
Another one is the Envira Amazonia Project. It is a tropical rainforest conservation project in Brazil. Likewise, the Kasigau Corridor REDD+ Project also protects a wildlife forest in Africa.
 
Other projects are the Northern Kenya Grasslands Project and the Reforesting Degraded Lands in Chile. Both projects are also under Verra management.
 
With those carbon projects, Netflix stated it had avoided about 14,000 tonnes of emissions last year. Retiring the credits from the projects enabled the firm to be on track with its carbon goals.

Netflix Net-Zero Carbon Targets

Last March 2021, Netflix revealed its “Net Zero + Nature” plan to hit net-zero GHG emissions by the end of 2022. The company’s approach to net-zero involves three R’s: Reduce, Retain and Remove.
 
Reduce means reducing Netflix scope 1 and 2 emissions by 45% in 2030, per the SBTi Guidance. This requires switching to using renewables and sustainable aviation fuel during film productions.
 
Retain involves keeping existing carbon storage by preventing more CO2 from reaching the air. Under this strategy, Netflix focuses on carbon credits that conserve at-risk natural areas. These include tropical forests and other critical ecosystems.
 
Lastly, Remove refers to investments in projects that capture and store carbon through natural solutions like grasslands and mangroves. The Vida Manglar Blue Carbon, in particular, is an example.
 

What makes Netflix’s carbon offset projects of high quality is its diligent evaluation process. It includes a five-step screening of RFP-based procurement, resulting in identifying the highest-quality nature-based projects

 
According to reports, Netflix managed to retire a total of 1.3 million carbon credits from the start of 2021.
 
Unfortunately, all full-scope emissions increased by 50% from 1.05 million tonnes in 2020 to 1.54 million tonnes in 2021. This was due to the increase in TV and film productions after the pandemic.

The Importance of Scope 3 Emissions in The Race to Net Zero

The pressure to seek net zero pledges that include Scope 3 emissions is rising.

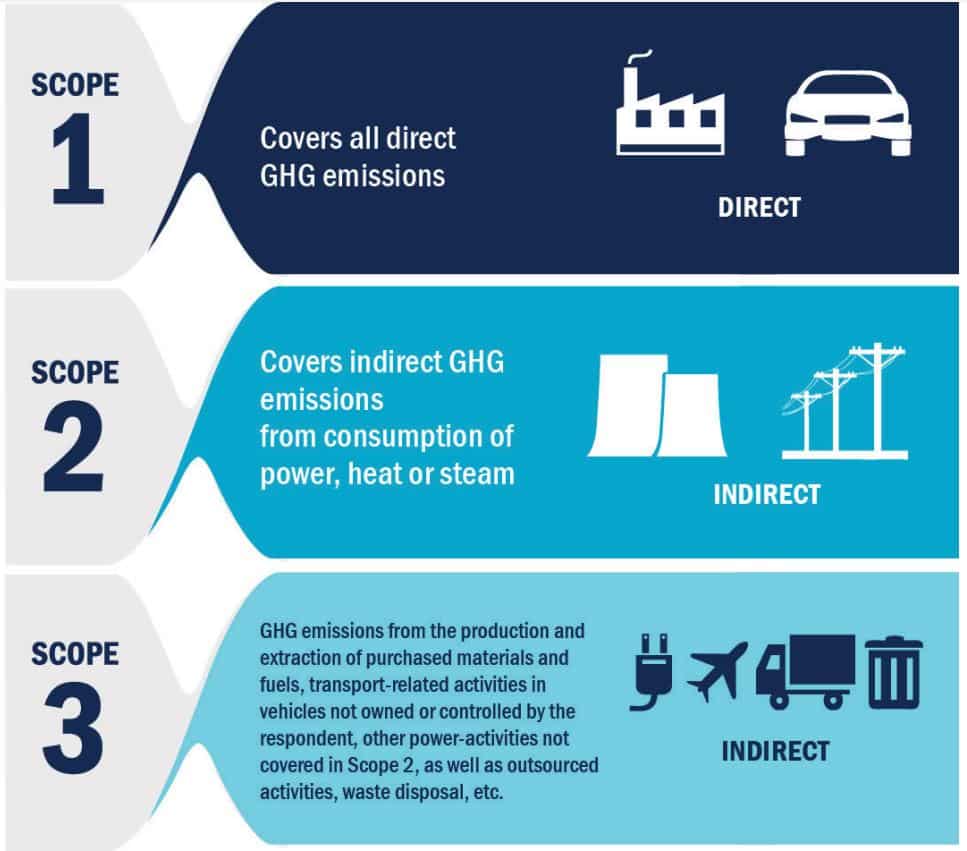
Here is an overview of the differences between Scope 1, Scope 2, and Scope 3 emissions.

Scope 123 emissions

CO2 emissions falling under Scope 3 include value chain emissions, and carbon footprint from suppliers, customers, business travels, company leases, and more.

Businesses with low Scope 1 and 2 emissions, but high Scope 3 emissions may soon face financial issues if they don’t pay attention to it. Why is that so?

Investors’ Focus Favoring the Importance of Scope 3 Emissions

Before investors were looking for companies to reduce only operational emissions (Scope 1) and indirect emissions from energy purchases (Scope 2).

But now, they are shifting their focus to the whole business supply chain.

ESG investors are looking for companies that are able to change and commit to achieving climate goals.

Thus, the main question they have concerns the entire activities that firms are doing or not relating to emissions. This means the importance of Scope 3 emissions is of high interest, too. In fact, it is where the largest carbon footprint is happening.

According to the Greenhouse Gas Protocol, there are 15 classes of Scope 3 emissions. GHG Protocol uses a world-renowned standard to measure and manage GHG emissions of companies and their value chains. It identifies “purchased goods and services” and “use of sold products” as most vital.

Take for instance the case of the oil and gas industry. O&G companies often have big Scope 3 emissions from end-product combustion.

Those value chain emissions are even much higher, 6x or more than the combined Scope 1 and 2 emissions.

In fact, many businesses have Scope 3 emissions that account for over 70% of their total footprint.

Why Dealing With Value Chain Emissions is Tricky?

As investors prefer a low emissions economy, a company’s climate plans have to align with it. But, companies with high supply chain emissions but low operational emissions may find it tough.

The financial challenge is due to various things. These include policy risks, carbon pricing, and shifts in end-product market demand.

Worse is that companies don’t have enough control over their Scope 3 emissions. This makes factoring in and managing supply chains emissions complex and burdensome.

Complicating the issue is a lack of regulatory guidance promoting the importance of Scope 3 emissions.

SEC had recently issued a proposed rule on emissions disclosure. Yet, while it has clear guidelines on Scopes 1 and 2 disclosure, disclosing supply chain emissions is left to the company to determine.

Is Scope 3 emissions “material” to disclose, too? It depends on the firm to decide.

For bigger companies that have been reporting all their emissions, it is a must. But for smaller ones that don’t have the capacity to do it, they are an exception to the SEC’s rule.

IETA Releases Guidelines on Blockchain Use in Carbon Markets

The International Emissions Trading Association issued guidelines on blockchain use in carbon markets.
 
IETA is the main lobby group for the international Voluntary Carbon Markets (VCM). It aims to establish a functional framework for trading in GHG emission reductions.
 
For years, the IETA is tracking digital innovations that can improve VCM performance. Just recently, it has issued a set of preliminary principles for using blockchain in VCMs.

What Prompts IETA’s Guidelines on Blockchain Use in Carbon Markets?

The IETA has observed the rapid emergence of digital carbon assets. And so, they decided to create the guidelines as a precautionary measure. They added that digital tokens must only be from recognized carbon standards.
 
Likewise, the IETA requested carbon registries like Gold Standard to make proper labeling. More so, they need to hold carbon credits in escrow accounts to prevent double selling.
 
Also, the body calls on all carbon standards to review blockchain providers. This is part of the industry’s Know Your Customer (KYC) and Anti-Money Laundering (AML) checks.
The following are some of the key points of IETA’s preliminary guidelines.

IETA’s Initial Guiding Principles on Blockchain

  • Credible standards: carbon-backed digital tokens should come from verified and registered projects. Only government-approved carbon crediting schemes or the Standards must endorse those projects.
  • Registry control: it is only the Standards that may permit carbon credits tokenization. And so, the Standards must have a system in place to perform this role.
  • Tokens: tokens that are for issuance and verified are valid for stamping. But unverified, canceled, and retired carbon credits are not qualified for tokens.
  • Transparency: all token issuers are subject to KYC and AML reviews. This is important for consumer protection and transparency.
  • Investor Safeguards: issuers must ensure that digital climate assets are fit for investors. This is crucial in cases where there is no direct link to the underlying carbon asset. 
  • IT Security: the use of proven methods of protection against cyber threats is a must.
  • Claims: only the removed and retired tokenized credits are permissible for claims. The mere holding of the credits, not retiring them, are not valid for compensation claims.

Impacts of IETA’s Principles on Blockchain

Right now, many items of the guidelines on blockchain use in carbon markets are not executed yet. This is because carbon-backed blockchain initiatives are a recent development in the market. In fact, they are not governed by carbon regulations.
 
According to IETA, if market players follow those set of principles, they can aid in market growth. The carbon crypto innovations will speed up market linkages and expand access in developing nations.
 
A word of caution, though, from the administering body. If not done right, incorrect blockchain use in carbon markets may threaten public confidence.