Disseminated on behalf of Alaska Energy Metals Corporation
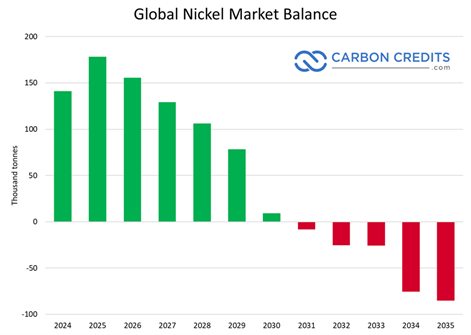
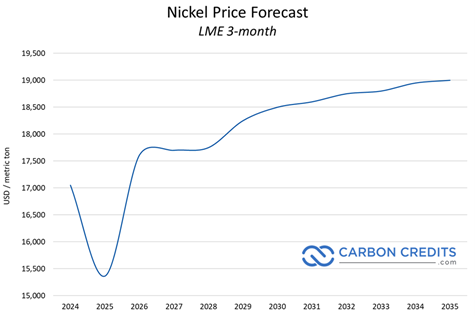
The global nickel market is shifting fast. Years of oversupply pushed nickel prices lower and delayed new mining investments. But recent price gains suggest the cycle may be turning. In early 2026, nickel prices jumped about 18% in a single month, highlighting how sensitive the market is to supply expectations.
For investors, this shift creates a high-risk, high-reward opportunity. Early-stage developers advancing projects today could benefit disproportionately when deficits emerge. Alaska Energy Metals Corporation (AEMC) sits at the center of this narrative, with its Nikolai Nickel Project moving toward a Preliminary Economic Assessment (PEA) in 2026 and growing momentum in the U.S. critical minerals policy landscape.
Nickel Prices Are Rising, and the Market Is Fragile
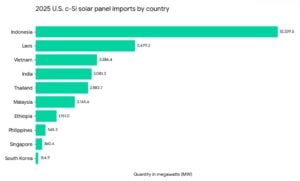
Nickel’s recent rally reflects growing concerns about future supply. Indonesia dominates global nickel production, and any policy shift there can move prices instantly. Markets reacted strongly to speculation about Indonesian output controls, showing how fragile the supply balance remains.
Despite today’s inventories, analysts warn that the world will need massive investment to meet future demand. Estimates suggest roughly $66 billion in global nickel supply chain investment may be required to avoid shortages later this decade.
This gap creates a structural opportunity. Low prices discourage new mines today, but demand from EVs, grid storage, and stainless steel continues to rise. And companies advancing projects during the downturn could benefit when the cycle flips.
Nikolai Nickel Project: A Strategic U.S. Critical Minerals Asset
AEMC’s flagship Nikolai Nickel Project in Alaska ranks among the largest undeveloped nickel resources in the United States. The project also contains copper, cobalt, chromium, platinum, palladium, and iron, making it a polymetallic critical minerals asset.
This resource mix strengthens the investment case. Nickel and cobalt are essential for batteries. Platinum group metals support hydrogen and industrial applications. Chromium and iron add potential by-product revenue streams.
Thus, domestic critical minerals projects like Nikolai are becoming strategic priorities as governments seek to reduce reliance on foreign supply chains.
New Work Program Accelerates Path to PEA
In October 2025, AEMC closed a $1 million non-brokered private placement, issuing roughly 11.8 million units at $0.085 per unit. Each unit included one common share and one warrant exercisable until October 2030. Insider participation and no finder’s fees signaled management confidence in the project.
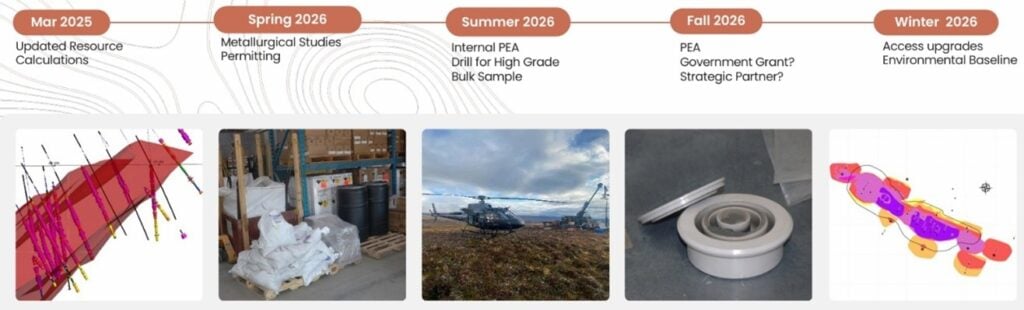
The company outlined a focused work program designed to move Nikolai toward economic evaluation:
- Metallurgical studies to produce concentrates
- Hydrometallurgical testing to assess on-site metal production
- Permitting for road extensions and camp upgrades
- Internal economic evaluations for a PEA
- Planning for a 2026 field program and investor outreach
These steps are critical. Metallurgy, infrastructure, and early economics determine whether large deposits can become mines.
The current share structure shows:
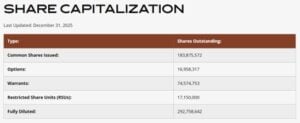
Hydrometallurgy, RecycLiCo, and Lucid Partnership Add Value
AEMC’s Memorandum of Understanding with RecycLiCo Battery Materials adds a downstream processing angle. RecycLiCo’s U.S. subsidiary will test whether its hydrometallurgical technology can refine metals from Nikolai ore.
Alongside, the nickel miner has also signed an MOU with Lucid Group, Inc (NASDAQ: LCID), maker of the world’s most advanced electric vehicles.
AEMC confirmed hydrometallurgical studies as part of its development plan. On-site refining could reduce reliance on foreign smelters, improve margins, and strengthen U.S. supply chain security.
Integrated mining and refining projects often command premium valuations. They also attract government support and strategic partnerships.
Trump-Era Critical Minerals Push Boosts Domestic Projects
U.S. policy momentum around critical minerals accelerated during former President Donald Trump’s administration and continues to influence today’s strategy. Trump’s executive orders declared critical minerals a national security priority and directed federal agencies to support domestic mining, processing, and recycling.
This policy shift led to:
- Funding programs under the Defense Production Act
- Streamlined permitting initiatives
- Federal grants for mining, processing, and battery supply chains
- Public-private partnerships for domestic critical minerals
These initiatives laid the foundation for today’s expanded funding and permitting reforms. Projects like Nikolai align directly with this policy framework, positioning AEMC to benefit from federal incentives, grants, and offtake partnerships.
FAST-41 and Government Engagement Reduce Risk
Nikolai is listed on the U.S. Permitting Council’s FAST-41 Transparency Dashboard. FAST-41 aims to accelerate permitting and improve coordination across federal agencies.
AEMC has also reported ongoing engagement with U.S. government departments regarding Nikolai’s role in domestic supply chains. This alignment matters for investors. Government backing can reduce permitting risk, unlock funding, and attract strategic partners.
Emily Domenech, Permitting Council Executive Director.
“I am excited to welcome the Nikolai Nickel project to the FAST-41 program. We are proud to support more mining projects that will strengthen the U.S. economy and reduce our reliance on foreign nations. I look forward to working with the Alaska Energy Metals Development Corporation to provide a transparent and predictable federal permitting process while achieving President Trump’s vision for American energy dominance.”
2026 PEA: A Major Valuation Catalyst
AEMC has initiated internal scoping studies to evaluate mining rates, sequencing, and economics. Early plans focus on extracting higher-grade near-surface zones first to improve project economics.
The Preliminary Economic Assessment is a major milestone. It converts geological resources into financial metrics like net present value and internal rate of return. Mining equities often re-rate significantly after a credible PEA.
With a PEA targeted for 2026, AEMC could hit this milestone as nickel markets tighten—a powerful combination for valuation.
Valuation Leverage to Nickel Prices
Junior miners offer strong leverage to commodity prices. A 10–20% increase in nickel prices can dramatically improve project economics for bulk tonnage deposits. The recent 18% monthly nickel rally highlights how quickly sentiment can change. If prices stabilize near $18,000–$20,000 per tonne, project valuations could rise sharply.
Key upside catalysts include:
- Sustained nickel price recovery
- Positive metallurgical and hydromet results
- Completion of the PEA
- Permitting and infrastructure progress
- Government funding or strategic partnerships
Each milestone reduces risk and increases valuation multiples.
Macro Tailwinds: EVs, Grid Storage, and Infrastructure
Nickel remains critical for high-energy-density batteries used in premium EVs and heavy-duty applications. Even as lithium iron phosphate batteries grow, nickel-rich chemistries dominate performance segments.
Stainless steel demand also continues to grow with global infrastructure and urbanization. Combined demand growth will strain supply, especially as Indonesian ore grades decline and regulatory pressures increase.
Western governments are pushing to localize critical minerals supply chains. This macro backdrop supports long-term bullish scenarios for domestic nickel developers.
M&A and Strategic Optionality
Large miners, automakers, and battery manufacturers increasingly seek secure North American supply. Nikolai’s scale, polymetallic (high-grade Ni-Cu-PGE massive sulphide mineralization) profile, and location make it a potential joint venture or acquisition target.
Downstream processing partnerships further increase strategic value. Domestic refining capability could attract OEMs, defense contractors, and federal agencies seeking supply security.
This optionality adds upside beyond commodity price appreciation.
Investment Outlook: From Oversupply to Opportunity
The nickel market’s surplus today hides a structural supply challenge. Massive investment is needed to meet electrification demand, yet low prices discourage new projects. This disconnect creates asymmetric opportunities for developers advancing projects during downturns.
AEMC’s Nikolai Nickel Project sits at the intersection of rising demand, domestic supply chain policy, and improving market sentiment. The company has secured financing, launched metallurgical and hydromet studies, engaged government stakeholders, and targeted a 2026 PEA.
Trump-era critical minerals policies and ongoing federal funding programs further strengthen the domestic mining investment thesis. If nickel prices continue to recover and AEMC delivers on technical milestones, the company could see a significant valuation re-rating.
In a world racing to electrify and localize supply chains, domestic nickel developers are becoming strategic assets. AEMC could emerge as one of the most leveraged plays on America’s critical minerals push.
To sum up, AEMC CEO Gregory Beischer commented,
“The cost and time savings for further exploration and development once ground access is established will be quite significant. It is very encouraging to see proactive streamlining and coordination amongst permitting agencies. We are grateful to the Permitting Council for including the Nikolai Nickel project in the FAST-41 program. With Nikolai hosting six Critical Minerals – nickel, cobalt, copper, chromium, platinum and palladium, two of which, nickel and cobalt, are Defense Production Act Title III materials deemed to be in shortfall, we are extremely well aligned with the U.S. national security objective of developing long-lived, domestic sources of metals and minerals essential to the national economy and national defense. Nikolai is a project potentially capable of significantly reducing US nickel and cobalt import dependency and vulnerability.”
- MUST READ: Nickel Prices Hit $18,000 in 2026 Amid Global Oversupply, US Boosts Domestic Supply Chain
Live Nickel Spot Price
Unit: USD/Tonne------Loading Chart...