What DECARBON 2026 Reveals About the Industryโ€™s Next Move

0

The oil and gas industry is moving from intention to action. With a focus on sustainability and operational advancements, this sector is investing in groundbreaking technologies to meet new demands. Find out how the Oil and Gas Decarbonisation Congress (DECARBON) 2026 is driving this transformation and reshaping the global energy landscape.

The oil and gas sector has grown weary of abstract discussions around decarbonisation, hydrogen’s future and other optimistic projections. Grand narratives have done little to solve real-world problems, and industry players are increasingly unwilling to indulge them. Instead, the focus is shifting toward practical, technology-based solutions, even if most are still in their early stages. These changes are a response to pressure for environmental accountability and a direct consequence of the sectorโ€™s underlying realities. Specifically, the finite nature of natural resources and the rising costs of extraction have compelled companies to adopt long-term strategies aimed at sustaining profitability and resilience. As a result, investments are finally beginning to flow where they matter most โ€” into technologies that can both curb emissions and sharpen operational efficiency. Rhetoric, it seems, is losing ground to results.

The Oil and Gas Decarbonisation Congress (DECARBON) 2026, held on 9โ€“10 February in Vรถsendorf, Austria brings together technical specialists, project leaders and technical specialists to examine the most relevant trends and practical approaches to reducing carbon emissions across the upstream, midstream and downstream sectors.

Low-Carbon Hydrogen: Infrastructure and Application

Hydrogen (Hโ‚‚) is widely recognised as one of the most critical tools in global decarbonisation strategies. According to the International Energy Agency (IEA), low-carbon hydrogen production could reach 180 million tonnes per year by 2050, depending on infrastructure deployment and policy alignment.

While green hydrogen holds great promise, its implementation remains largely aspirational due to current cost barriers. As a result, discussions around hydrogen

must go beyond ideal scenarios to address the market situation. This is why the agenda of the Oil and Gas Decarbonisation Congress 2026 includes a range of hydrogen technologies that are particularly relevant today.

The Congress features a Leaders Panel addressing the development of efficient hydrogen infrastructure, green hydrogen value chain development and foundational processes in low-carbon hydrogen production. Among the speakers are Tamรกs Mรฉrล‘, Head of Green Hydrogen Value Chain Management at MOL Group, and Fabio Ferrari, Head of the Circular Carbon and Integration Solutions Department at NextChem, along with other industry leaders.

Digitalisation and Operational Performance

Digital tools have reshaped asset management and environmental monitoring across the energy industry. Automation, AI and real-time analytics have helped reduce emissions, cut OPEX and increase system stability. According to recent reports, technology leaders like Siemens are using digital twins and AI-powered analytics to monitor emissions, optimise system performance and support decarbonisation efforts across various sectors.

This growing emphasis on digital innovation is further reflected in a roundtable session at DECARBON 2026, focused on the role of technology in advancing sustainability objectives. Mario Calado Industry Strategy Lead at Siemens AG, participates in the discussion and shares insights into how digital transformation could be realised. Complementing this, Florian Klein, Business Development Manager for Energy Transition at Linde Advanced Operations Solutions, outlines how companies applied advanced operations systems to reduce energy use and move towards an autonomous plant. Moreover, at the Congress delegates have a chance to learn more about machine learning powered optical gas imaging solutions, P2X technologies, satellite technology and many others.

Electrification in Upstream Operations

Electrification has proved an effective lever for reducing Scope 1 and Scope 2 emissions in upstream operations as it has improved energy management and reduced operational variability.

During the session focused on decarbonisation for upstream operations, Ali Aboosi (Business Development Manager at Chromalox) presents the deployment of electric process heating systems across production assets. Dr. Bo Fu, CEO of Oiler.ai, contributes insights on the machine-learning-powered optical gas imaging solution for real-time methane leak detection and quantification. Additionally, Fayez Al-Mezel, Business Planning Specialist at Kuwait Oil Company, take part in the discussion, offering energy transition strategies for the upstream sector.

Carbon Capture and Storage at Industrial Scale

Carbon Capture, Utilisation and Storage (CCUS) remained a priority for industrial decarbonisation. According to McKinsey & Company, CCUS capacity needs to increase more than 120 times by 2030 to align with global net-zero targets. Progress toward this goal is underway: as of the first quarter of 2025, global operational CCUS capacity reached just over 50โ€ฏmillion tonnes of COโ‚‚ per year, reflecting a year-on-year increase.

To showcase how these targets are being addressed in practice, the Closing Panel at DECARBON 2026 presents case-studies from active CCUS projects across Europe, with a focus on integration, commercial readiness and cross-sector collaboration.

Speakers included:

โ— Dr Marc Scherle, Project Manager, Business Development & Sales, Linde Engineering โ€“ Decarbonisation of process industry using Linde technologies

โ— Phillip Cooper, Project Director, Petrofac โ€“ Design of the Aramis CCS pipeline system

โ— Kleopatra Avraam, Strategic Planning Senior Director, DESFA โ€“ Overview of DESFA’s CCS Project, APOLLOCO2

โ— Andreas Grobler, Strategic CCUS Partnership Manager, Shell Deutschland โ€“ Case examples from Shellโ€™s global operations

The discussions at DECARBON 2026 underscore a clear industry pivot: away from theoretical promises and toward credible solutions. Topics like hydrogen infrastructure, digital transformation, upstream electrification and CCUS must be actively evaluated and, in some cases, deployed. Faced with finite resources and

rising operational pressures, the sector is responding not with rhetoric, but with targeted investment in technologies that deliver measurable outcomes. The message of DECARBON 2026 is clear: decarbonisation is not a distant ambition โ€” itโ€™s a competitive edge, and itโ€™s happening now.

As the Congress motto states, “Reimagine the future of energy”, this call remains relevant across all segments of the industry. Explore whatโ€™s next with DECARBON 2026: https://sh.bgs.group/39p

Digital Marketing Goes Green: Google Launches Carbon Footprint Tool for Google Ads

Google just made it easier for advertisers to go green. The tech giant has launched Carbon Footprint for Google Adsโ€”a new tool that helps marketers measure and manage the carbon emissions from their ad campaigns.

After testing it with a few large advertisers earlier this year, Google has now opened it up to everyone. The tool gives users access to first-party data showing how much carbon their ads produce across Google Ads, Display & Video 360 (DV360), Search Ads 360 (SA360), and Campaign Manager 360 (CM360).
Understanding Ad Emissions with Googleโ€™s Carbon Footprint Tracker

The Carbon Footprint tool is designed to help advertisers see the bigger picture when it comes to sustainability. It breaks down emissions data across Scopes 1, 2, and 3, following the Greenhouse Gas Protocol and the Ad Net Zero Global Media Sustainability Framework. These standards make sure the numbers are accurate and in line with global climate reporting guidelines.

Hereโ€™s what advertisers can do with it:

  • Get detailed, account-specific data: The tool uses Googleโ€™s first-party data to calculate emissions for each account based on targeting, media mix, and auction activity.
  • Use trusted standards: Reports follow the Greenhouse Gas Protocol (GHGP) and Global Media Sustainability Framework (GMSF), which means the data meets international sustainability benchmarks.
  • See exactly where emissions come from: Reports split the data into Scopes 1, 2, and 3, including both market- and location-based Scope 2 figures.

With this information, advertisers can identify where their emissions are highestโ€”and take steps to reduce them.

Easy Access, Fresh Data

Advertisers using Google Ads, DV360, SA360, or CM360 can request their Carbon Footprint report directly from Google. Reports are updated every month and include data starting from January 2024.

For instance, if you request a report on October 20, 2025, it will include data from January 2024 through September 2025. Advertisers can submit up to five report requests a day, each covering up to 25 account IDs. Google processes up to 10,000 total requests daily across all advertisers.

Location-based emissions estimates for Google Ads go back to January 2024, while both market-based and location-based estimates for DV360, SA360, and CM360 start from July 2024.

Making Advertising More Sustainable

Googleโ€™s rollout of this tool is a big step for the ad industry. It helps marketers better understand their environmental footprint and gives them the insights they need to take action.

This isnโ€™t just about meeting compliance requirementsโ€”itโ€™s about making smarter choices. Advertisers can use this data to plan more efficient campaigns, reduce waste, and make their marketing strategies more eco-friendly.

In todayโ€™s world, sustainability isnโ€™t just good ethicsโ€”itโ€™s good business. Consumers increasingly want to support brands that care about the planet. By taking steps to reduce emissions, companies can boost their reputation and connect with those values.

Googleโ€™s Commitment to Green Tech

This launch fits perfectly with Googleโ€™s long-term sustainability goals. The company aims to run entirely on carbon-free energy and reach net-zero emissions by 2030. By giving advertisers access to tools like Carbon Footprint for Google Ads, Google is encouraging other businesses to follow the same path.

It also ties into Googleโ€™s broader eco-friendly efforts, from promoting sustainable shopping filters to helping companies track emissions through Google Cloud. Altogether, these tools show Googleโ€™s belief that sustainability should be built into digital products, not added as an afterthought.

Cutting Emissions Amid AI Growth

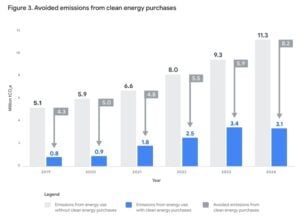
The companyโ€™s total greenhouse gas emissions have risenย 51% since 2019, with AI being a key driver.ย However, its latest sustainability report revealed a notable achievement: a 12% drop in energy emissions from its data centers in 2024, even as AI demand surged.

google emissions
Source: Google

These data centers form the backbone of its AI operations. In 2024, they consumed 30.8 million megawatt-hours of electricity, more than twice the level recorded in 2020. The surge underscored the immense energy needs behind AIโ€™s rapid expansion.

Despite the spike in power use, up 27% year-over-year, Google successfully reduced its direct emissions. The company credited this to long-term clean energy contracts, efficiency upgrades, and advanced cooling systems, which helped curb climate impact while keeping pace with AI-driven workloads.

In short, Google showed that scaling AI and cutting emissions can go hand in hand with the right technology and commitment.

google emissions
Source: Google

A Step Toward Cleaner Advertising

If widely adopted, this tool could transform how the industry thinks about advertising. For years, the ad world has been criticized for its environmental impact, from data centers powering digital ads to the energy used in ad production. Now, thereโ€™s a concrete way to track and improve those impacts.

But the real change will come from how advertisers use this data. Measuring emissions is just the first stepโ€”acting on that information is what really counts. Companies that use these insights to reduce their footprint could set the standard for greener marketing practices.

Thus, Googleโ€™s Carbon Footprint for Google Ads shows that advertising is sustainable. It allows brands to balance performance with responsibility, proving that effective marketing doesnโ€™t have to come at the planetโ€™s expense.

As more advertisers embrace this kind of transparency, sustainability could become a standard metric alongside reach and engagement. And thatโ€™s a big win for both business and the environment.

Googleโ€™s move shows that every click, impression, and campaign can be measured not only by what it achievesโ€”but also by its impact on the world around us.

Study Finds Carbon Offsets Failing to Deliver Real Climate Impact

A new peer-reviewed study suggests that most carbon offset programs have failed to deliver real reductions in greenhouse gas emissions. The study in the Annual Review of Environment and Resources (2025) finds that offsets, credits companies buy to offset their emissions, havenโ€™t significantly slowed global warming.

The authors, led by climate scientist Joseph Romm, reviewed over ten years of data. They found that most offsets are tied to projects that would have occurred regardless. This means that many credits do not represent genuine emission reductions.

Carbon offsets are a cornerstone of corporate climate strategies. Despite billions in voluntary carbon markets (VCM), global carbon dioxide levels hit a record 424 parts per million in 2024, says the World Meteorological Organization. The study claims that offset systems, as they are now, provide more accounting ease than real benefits to the atmosphere.

Why Most Carbon Credits Miss the Mark

The paper identifies three main reasons why offsets have underperformed.

First, โ€œadditionalityโ€ โ€” the idea that a project must only exist because of offset funding โ€” is often not met. Many renewable energy and forest conservation projects would likely move forward without carbon credit revenue.

Another research from 2024 shows that about 87% of VCM offsets likely do not provide real and additional emission reductions. This widespread failure mainly comes from project designs that give too much credit to common renewable energy and forest conservation efforts. Many of these would have happened even without the projects.

Second, measurement and permanence are major issues. Forest-based credits account for about 40% of the voluntary carbon market. They can lose stored carbon due to wildfires, drought, or illegal logging. Studies cited in the review show that over 90% of forestry offsets examined failed to guarantee long-term carbon storage.

Third, double-counting remains common. Some emissions reductions are claimed by both the project developer and the host country, undermining integrity.

Some forest offset projects fail to consider leakage. This means emissions may shift to other places, leading to over-crediting. Similar estimates show that more than half of the offsets in different carbon markets may face double-counting or overstatement.

The result, according to Rommโ€™s team, is that less than 10% of offsets on the market deliver genuine, measurable, and lasting emission cuts.

The Scale of the Problem: Billions in Doubt

The voluntary carbon market was once expected to reach $50 billion by 2030, driven by corporate net-zero pledges. But growth has slowed sharply since 2022, as buyers question credit quality and reputational risk increases.

carbon credit market value 2024

Market value fell by more than 60% between 2022 and 2024, according to BloombergNEF. Major companies like Nestlรฉ, Gucci, and EasyJet have reduced offset purchases. Instead, they are focusing on funding direct emission cuts in their operations.

Over 1.5 billion carbon credits are still in circulation. This accounts for over a billion tonnes of claimed emission reductions, despite the slowdown. The study warns that if these credits lack real-world carbon removal, they might delay climate action. This is because they create a false sense of progress.

Rebuild or Retreat? How the Carbon Market Fights for Credibility

The studyโ€™s findings have triggered strong reactions across the carbon market. Many organizations see the problems. They argue for reform instead of giving up.

The Integrity Council for the Voluntary Carbon Market (ICVCM) is an independent global group. In 2024, it launched its Core Carbon Principles (CCPs). These rules set minimum standards for quality, transparency, and permanence. ICVCM began approving credits that meet its criteria in 2025, with the goal of restoring buyer confidence.

Similarly, major registries like Verra and Gold Standard have updated their methodologies. Verra now requires projects to provide verified, real-time monitoring data. They must also account for climate risks like fire and deforestation.

Gold Standard has shifted its focus from offsets to โ€œclimate contributions.โ€ This change pushes companies to invest more in reducing emissions, not just compensating for them.

Industry experts noted that the industry must โ€œshift from quantity to quality.โ€ They emphasized that strong verification systems and independent audits can help rebuild trust.

Even governments are stepping in. At COP30 in Belรฉm, Brazil (2025), negotiators plan to finalize the global rules for carbon trading under Article 6 of the Paris Agreement. These rules will define how international credits can be traded without double-counting.

Examples of New Approaches

Some initiatives are emerging to fix long-standing issues.

  • Technology-based removals: Startups like Climeworks and Charm Industrial are producing credits based on direct air capture and bio-oil sequestration. These methods store carbon permanently, though they remain costly โ€” up to $600 per tonne.
  • Jurisdictional forest programs: Countries like Indonesia and Gabon are piloting large-scale carbon programs that use satellite monitoring to ensure transparency.
  • Corporate reform: Companies like Microsoft and Delta Air Lines will only buy credits from projects that show real, lasting carbon removal. They won’t focus on avoided emissions anymore.

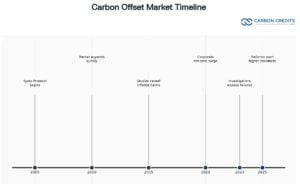
These changes show a shift from offsetting emissions to removing carbon. This aligns better with science-based targets. The timeline below shows major developments in the carbon offset market.ย 

carbon offset market timeline

What the Data Really Says About Climate Accounting

The Annual Review study makes a clear recommendation: carbon offsets should no longer be used as a substitute for direct emission cuts. Instead, they can play a role in funding innovation or supporting communities during the transition.

Romm and his team say that governments need to stop using low-quality offsets. They also want strict global oversight. They warn that without reform, carbon markets may face the same credibility issues. This could lead to public backlash like the one seen in 2023 and 2024.

Still, the authors acknowledge that offset mechanisms can evolve. โ€œOffsets could help if they fund projects that remove carbon permanently and are verified transparently,โ€ the paper notes.

Beyond Offsets: Toward a Stronger and More Honest Market

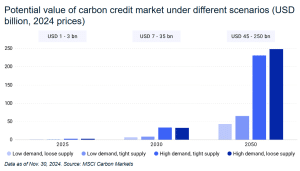
Despite criticism, few expect the voluntary carbon market to disappear. Instead, it is likely to become smaller but more credible. BloombergNEF analysts estimate that a strong market could hit $30 billion each year by 2035. Also, the MSCI forecasts it could reach up to $35 billion in 2030. This growth will come from verified carbon removals and compliance-linked credits.

carbon credit market value 2050 MSCI

The broader transition is also creating new demand for accountability. Investors, regulators, and consumers want companies to show how they verify offsets. They also want to see how these offsets fit into long-term plans for reducing carbon emissions.

The Integrity Councilโ€™s certification process and the UNโ€™s Article 6 rules are expected to shape the next decade of carbon trading. They could remove low-quality projects and direct funding to real climate solutions.

The study delivers a tough message: the world cannot buy its way out of the climate crisis. Offsets, as they exist today, have not slowed global warming. The new wave of reforms shows that transparency and integrity might make carbon markets part of the solution.

For now, the future of offsets depends on whether companies, investors, and regulators can rebuild trust, shifting from promises on paper to real-world carbon reduction and removal.

Brookfield’s $20B Close Sets Record for Global Clean Energy Funding

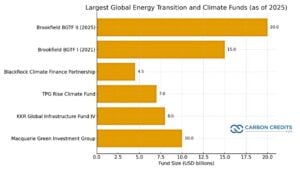
Brookfield Asset Management has raised 20 billion U.S. dollars for its second global energy transition fund. This makes it the largest private fund ever created for clean energy and decarbonization projects.

The fund, called the Brookfield Global Transition Fund II (BGTF II), will invest in renewable energy, carbon capture, nuclear, and other low-carbon solutions worldwide. Brookfield said the fund exceeded its target.

The company will commit about 25 percent of the capital from its own balance sheet, showing strong confidence in the opportunity. More than 200 global investors joined the fund, including major pension funds, sovereign wealth funds, and insurers.

Brookfield also secured 3.5 billion dollars in co-investments from partners that will join in large projects. The firm has already deployed $5 billion from the fund into new projects. This shows a quick start in building clean energy infrastructure on a large scale.

From BGTF I to BGTF II: Bigger, Broader, and More Ambitious

Brookfieldโ€™s first transition fund, BGTF I, launched in 2021 with $15 billion. It focused on renewable power, carbon capture, battery storage, sustainable aviation fuel, and nuclear services through Westinghouse.

That first fund achieved strong performance. Brookfield says BGTF II now targets a net internal rate of return (IRR) of about 12%, slightly higher than the goal of the first fund.

BGTF II builds on that experience and scale. It seeks to change carbon-heavy industries, grow clean energy, and back technologies that reduce emissions. The company manages over $850 billion in assets. This gives it the reach and skills to handle a large platform.

Connor Teskey, President of Brookfield Asset Management, remarked:

โ€œEnergy demand is growing fast, driven by the growth of artificial intelligence as well as electrification in industry and transportation. Against this backdrop we need an โ€˜any and allโ€™ approach to energy investment that will continue to favor low carbon resources. Our strategy will succeed by investing in the technologies that will deliver clean, abundant, and low-cost energy and transition solutions that underpin the global economy.โ€

Where the Money Will Go

BGTF II focuses on three major investment areas:

  • Clean energy expansions, such as wind and solar projects.
  • Transition technologies include battery storage, grid modernization, carbon capture, and next-generation nuclear.
  • Sustainable solutions that cut emissions in industries and transportation.

Early investments already include Neoen in France, Geronimo Power in the United States, and Evren in India. These projects plan to create more than 10 gigawatts of clean energy. They will use wind, solar, and battery storage.

Brookfield plans to deploy capital across North America, South America, Europe, and the Asia-Pacific region. The company is expanding into emerging markets, such as India and Brazil, where energy demand is increasing rapidly. Clean power investments can also make a big social impact.

Brookfield Renewable Partners global operations

Brookfield now oversees over 200 gigawatts of renewable power. This capacity, built or in development, can supply electricity to hundreds of millions of homes worldwide.ย 

Record Scale in a Fast-Changing Market

The 20-billion-dollar fund comes at a time of record investment in clean energy. The International Energy Agency reports that global renewable power investment hit 680 billion dollars in 2024. Total energy transition funding also exceeded 1.7 trillion dollars.

energy investment 2025 IEA report

Private infrastructure investors can raise over 2 trillion dollars by 2030 for clean energy projects. Brookfieldโ€™s new fund shows how private capital is stepping in to meet that demand.

The size of BGTF II sets it apart from rivals. It surpasses other large climate funds managed by firms like BlackRock, KKR, TPG, and Macquarie. Many analysts see it as proof that energy transition investments are moving from a niche market to the financial mainstream.

global energy transition fund brookfield

Some of the worldโ€™s biggest investors have backed the fund. Sovereign wealth funds from the Middle East, European pension plans, and large insurers all made multi-billion-dollar commitments. Strong demand allowed Brookfield to close the fund early and above target.

Beyond Returns: ESG with Real-World Results

Brookfield’s first transition fund, BGTF I, helped avoid over 100 million tonnes of COโ‚‚ emissions. This was achieved through the projects it financed. The new fund, BGTF II, is expected to double that impact over the next decade.

The company says its clean energy projects create tens of thousands of skilled jobs. These jobs are in construction, operations, and maintenance worldwide. In emerging markets such as India and Brazil, new renewable projects are creating steady jobs. They are also boosting local economies.

BGTF II boosts Brookfield’s role as a top investor in sustainable infrastructure from an ESG perspective.

  • Environmental: The fund supports renewable generation, energy storage, and industrial decarbonization โ€” key areas for cutting emissions.
  • Social: The projects promote local job creation and responsible sourcing.
  • Governance: Brookfield promises clear ESG reporting. They provide third-party checks on emissions cuts and metrics for investors.

These steps align with global net-zero goals and contribute to keeping global temperature rise below 1.5 degrees Celsius.

Why It Matters: The Private Capital Shift to Clean Power

Brookfieldโ€™s new fund is a signal of how the global energy system is changing.ย The rise of artificial intelligence, data centers, and electric vehicles is driving rapid growth in electricity demand. At the same time, governments are tightening climate policies and pushing for more clean power capacity.

Funds like BGTF II help fill the gap between public targets and real-world project financing. Private capital can move faster than government budgets and can help deliver clean energy solutions at scale.

The fund also shows that investors see climate projects as long-term infrastructure instead of short-term experiments. Stable cash flows from renewables and storage assets attract institutions. They seek both returns and a positive impact.

Building the Next Generation of Clean Energy

Brookfield plans to deploy BGTF IIโ€™s capital over the next 5 to 7 years. Early focus areas include North America, Europe, India, and Latin America โ€” regions with clear climate policies and rising energy demand.

If executed well, the fund could help close the global investment gap in clean power and low-carbon infrastructure. It will show that sustainability and profitability can go hand in hand, and it works best with strong management and scale.

Brookfieldโ€™s 20-billion-dollar Global Transition Fund raise marks a milestone in global finance. It shows how private capital can drive the shift toward low-carbon growth โ€” helping to build the next generation of clean energy systems, one project at a time.

Solar Now the Worldโ€™s Cheapest Energy, Powering the Clean Transition

Solar energy has officially claimed the title of the worldโ€™s most affordable source of electricity. According to new research from the University of Surreyโ€™s Advanced Technology Institute (ATI), solar power now costs as little as ยฃ0.02 per kilowatt-hour in the sunniest regions.

The study, published in Energy and Environmental Materials, highlights how solar photovoltaic (PV) technology has transformed from a niche innovation into the backbone of the global clean energy revolution.

As countries race to cut carbon emissions and combat climate change, the rapidly falling cost of solar power is unlocking access to clean energy on an unprecedented scale.

Solar Becomes the Cornerstone of a Low-Carbon Future

Professor Ravi Silva, co-author of the study and Director of the ATI, emphasized that even in less sunny nations like the UK, solar power has become the most cost-effective option for large-scale generation.

He precisely noted,

โ€œEven here in the UK, a country that sits 50 degrees north of the equator, solar is the cheapest option for large-scale energy generation. Globally, the total amount of solar power installed passed 1.5 terawatts in 2024 โ€“ twice as much as in 2020 and enough to power hundreds of millions of homes. Simply put, this technology is no longer a moonshot prospect but a foundational part of the resilient, low-carbon energy future that we all want to bring to reality.โ€ย 

This milestone shows that solar energy is no longer experimental. Itโ€™s a proven cornerstone of the low-carbon future the world is building toward.

Alongside solar, the cost of lithium-ion batteriesโ€”key to storing renewable powerโ€”has dropped by a staggering 89% since 2010. This sharp decline has made solar-plus-storage systems a competitive alternative to conventional gas-fired power plants.

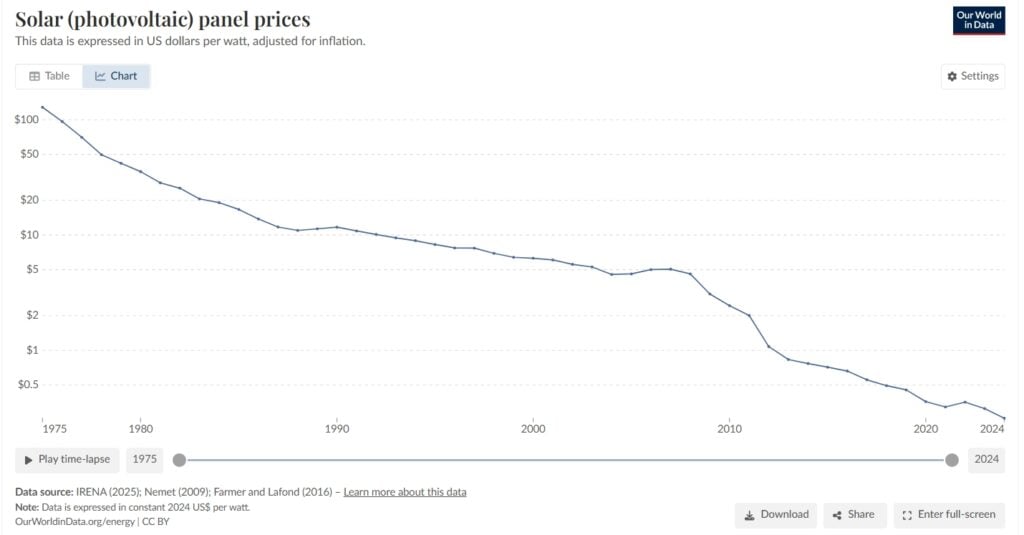
Solar panel price

Global Solar Costs Fall Over 80% in a Decade

According to the International Renewable Energy Agency (IRENA), the global weighted-average levelized cost of electricity (LCOE) for utility-scale solar PV dropped by over 80% between 2010 and 2023. In sun-rich regions, it now costs as little as $0.03 per kilowatt-hourโ€”making it the cheapest source of new electricity generation worldwide.

This steep decline stems from a mix of technological, economic, and policy factors. Breakthroughs in solar cell efficiency, bifacial modules, and tracking systems have dramatically boosted energy output.

Also, competitive auctions and long-term power purchase agreements (PPAs) have made solar development more transparent and efficient. Industry experience has also cut costs for installation and maintenance.

Today, solar PV is cheaper than coal, gas, and even wind in many markets, shifting the question from โ€œWhy choose renewables?โ€ to โ€œHow fast can we deploy them?โ€

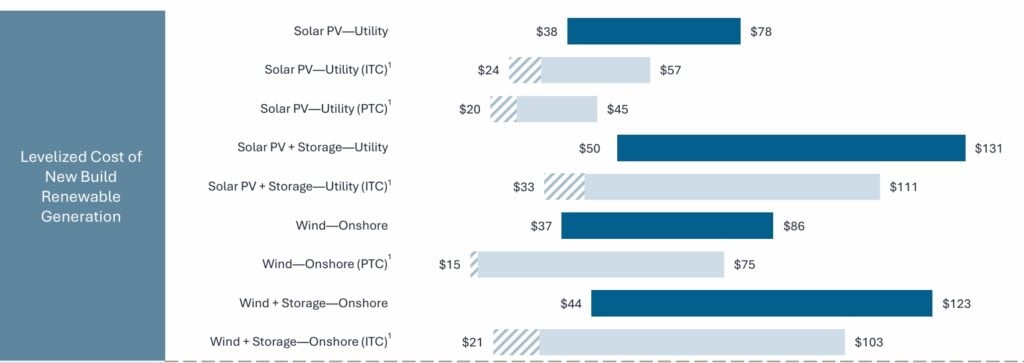
Levelized Cost of Energy Comparisonโ€”New Build Renewable Generation

Cost of renewable solar
Source: Lazards Report

Chinaโ€™s Role in Falling Clean Energy Costs

Meanwhile, bigger economies, especially from large-scale manufacturing in China, have lowered hardware and installation costs.

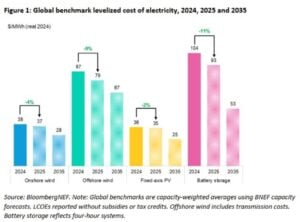
Bloomberg also expects the cost of clean energy technologies, i.e., solar, wind, and battery storage, to drop further in 2025. It could be falling 2โ€“11% and breaking last yearโ€™s records. In almost every part of the world, new solar and wind farms are now cheaper to build and operate than new coal or gas plants

Significantly, Chinaโ€™s overcapacity in clean tech has led some countries to impose import tariffs, temporarily slowing cost declines. Still, BNEF expects levelized costs for clean energy to fall 22โ€“49% by 2035, keeping renewables on track for long-term growth.

  • Battery storage costs dropped a third in 2024 to $104/MWh, driven by oversupply from slower EV sales, with prices expected to cross $100/MWh in 2025.
  • Fixed-axis solar farms fell 21% globally, while wind and solar generation costs are projected to decline another 4% and 2%. It ensures clean energy remains cheaper than fossil fuels.
clean energy costs solar
Source: Bloomberg

Storage Revolution: Solar Power Around the Clock

The global energy storage boom has turned solar from an intermittent resource into a 24-hour power solution. It’s because of the massive cost reductions in batteries, solar-plus-storage systems can now compete head-to-head with gas-fired plants.

However, challenges remain in connecting large volumes of solar power to existing grids. Regions like California and China have already experienced energy curtailment due to grid congestion when solar output exceeds demand.

Dr. Ehsan Rezaee, co-author of the University of Surrey study, noted that โ€œsmart grids, artificial intelligence forecasting, and stronger regional interconnections will be essential to maintain power system stability as renewable adoption grows.โ€

Global Policy Boosts vs. U.S. Uncertainty

Supportive policy frameworks are key to sustaining solarโ€™s momentum.ย In Europe, the Green Deal and RePowerEU initiatives have simplified permitting and set aggressive renewable targets.

Indiaโ€™s Production Linked Incentive (PLI) scheme, meanwhile, is strengthening local solar manufacturing to reduce dependence on imports. These measures are not only cutting carbon emissions but also advancing energy security, job creation, and economic growth.

International partnerships, such as the International Solar Alliance (ISA), continue to drive collaboration, knowledge exchange, and capacity building, particularly in developing nations that stand to benefit most from affordable solar energy.

OBBBA: Dimming the Sunshineย 

However, the story is slightly different in the U.S. In July 2025, President Trump signed the One Big Beautiful Bill Act (OBBBA), which speeds up the phase-out or early termination of most renewable energy tax credits and clean energy incentives established under the IRA.

As a result, U.S. clean energy incentives are being rapidly scaled back, with many tax credits set to expire or face new restrictions and deadlines, creating significant uncertainty for investors and project developers.

Breakthrough Technologies Drive the Next Wave

Solar technology innovation is accelerating at record speed. Researchers at the University of Sydney recently achieved a world-first breakthrough with a 16 cmยฒ triple-junction perovskite solar cell delivering 23.3% efficiency for large-area devices. A smaller version reached 27.06% efficiencyโ€”the highest globallyโ€”and retained 95% performance after 400 hours of continuous operation.

Perovskite solar cells could revolutionize the market by boosting energy output by up to 50% without expanding land use. They can be made as thin, flexible films at lower temperatures than traditional silicon panels, cutting production costs significantly. Over the past decade, perovskite efficiency has soared from 3% to over 25%, with tandem cells poised to exceed 30%. These innovations will further drive down solar costs and expand applications across rooftops, vehicles, and portable systems.

Solar Dominates Future Renewable Growth

The International Energy Agency (IEA) forecasts that global renewable capacity will double by 2030โ€”adding 4,600 gigawatts (GW), equivalent to the combined power generation capacity of China, the EU, and Japan.

  • Solar PV will account for nearly 80% of this growth, followed by wind, hydropower, and bioenergy.
solar energy
Source: IEA

According to DNVโ€™s latest Energy Transition Outlook, global solar capacity is expected to surpass 3,000 GW by the end of 2025, with China holding 47% and Europe 20%. It further highlights:

  • Solar already generates about 10% of the worldโ€™s electricity and is projected to reach 20% by 2029 and 40% by 2045.
  • Behind-the-meter (BTM) solar used by households and businesses is also on the rise and is expected to make up 30% of total solar generation by 2060.
  • Wind power is projected to nearly double to over 2,000 GW by 2030, but solar remains the lowest-cost option in most markets.

India is emerging as the second-fastest renewables market after China, advancing its 2030 targets. Expanded auctions and rapid rooftop solar growth contribute to the solar boom.

However, the world still falls short of the COP28 goal to triple renewable capacity by 2030, achieving about a 2.6-fold increase from 2022 levels. Closing this gap will require continued investment, innovation, and political will.

Building a Resilient Solar Future

As solar continues to dominate the global energy landscape, integration challenges must not be ignored. Expanding transmission networks, deploying digital grid management tools, and investing in advanced materials will be crucial.

Professor Silva emphasizes that sustained policy backing and continued innovation will determine how quickly the world transitions to a clean, resilient energy future.

The Renewable Energy Institute applauds solarโ€™s rise as the cheapest source of electricity and continues to provide accredited training to build the skills needed to sustain this momentum.

Thus, from record-low costs to record-breaking efficiency, solar energy is reshaping the global energy system faster than anyone imagined. Its combination of affordability, scalability, and innovation is driving the clean energy transition forward.

The question now isnโ€™t if solar will dominate, but how quickly the world can harness its full potential.

Renewables 2025: How China, the US, Europe, and India Are Leading the Worldโ€™s Clean Energy Growth

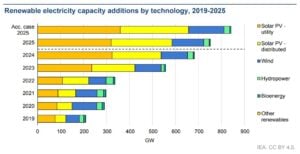
The worldโ€™s renewable energy sector has entered a new phase of record growth. According to the International Energy Agencyโ€™s Renewables 2025 report, global renewable power capacity grew by more than 510 gigawatts (GW) in 2024 โ€” the fastest increase ever recorded. Another 520 GW is expected to be added in 2025, pushing renewables to account for over 90% of all new global power capacity.

Solar and wind dominate this growth. By 2025, solar will account for nearly three-quarters of new installations. This growth comes from cheaper technology, improved grid integration, and supportive policies. Wind power is also recovering after a slowdown in 2022โ€“2023, supported by new offshore projects in Europe, China, and the United States.

The IEA says the worldโ€™s total renewable capacity will reach nearly 5,800 GW by 2025, up from around 4,200 GW in 2023. That means renewables now generate about 30% of global electricity and are on track to reach 42โ€“45% by 2030.

Renewable electricity capacity additions by technology

Four regions โ€” China, Europe, the United States, and India โ€” are responsible for almost 90% of this global expansion. Each is moving at a different pace, but together they are transforming how the world produces and consumes energy.

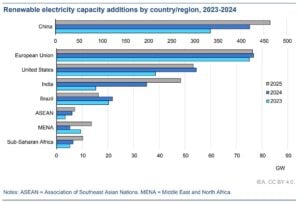
Renewable electricity capacity additions by country

Europe: Accelerating the Energy Transition

Europe continues to lead in energy policy and innovation. In 2024, the European Union added more than 70 GW of new renewable capacity, driven mainly by solar. This is a record year. It shows the blocโ€™s goal to cut reliance on imported fossil fuels. They aim to meet their Green Deal target of a 55% emissions reduction by 2030.

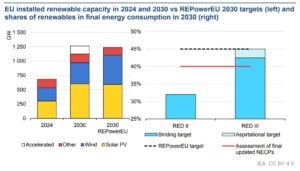
Solar capacity across the EU doubled between 2020 and 2024, reaching over 300 GW, while wind capacity passed 220 GW. The IEA predicts that Europe will add 450 GW of renewables from 2025 to 2030. This will raise the total capacity to almost 870 GW by the end of the decade.

EU installed renewable capacity in 2024 and 2030

Much of this growth is tied to the REPowerEU plan, which aims to speed up permitting and expand rooftop solar. Offshore wind is gaining popularity. Countries like Germany, Denmark, and the Netherlands are investing in North Sea projects.

Despite progress, Europe faces challenges. Delays in grid expansion and limited local manufacturing capacity for wind turbines have created supply bottlenecks. Even so, strong policy support and high carbon prices still make renewables the best choice for power generation.

United States: Policy Support and Private Investment Drive Expansion

The United States is entering a period of major renewable growth, supported by the Inflation Reduction Act (IRA) and record private investment. The IEA expects the U.S. to add around 400 GW of new renewable capacity by 2030, effectively doubling its current base.

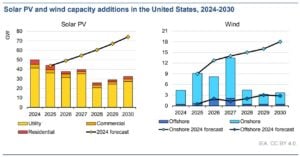
In 2024, U.S. solar installations rose by nearly 40%, reaching 45 GW for the year. Solar now accounts for the largest share of new capacity additions. Wind power also recovered, with onshore and offshore projects expanding in Texas, California, and along the East Coast.

Solar PV and wind capacity additions in US

Renewables currently generate about 26% of U.S. electricity, up from 22% in 2022. The IEA projects this share will climb to over 40% by 2030, driven by federal tax incentives and falling technology costs.

Battery storage is another fast-growing sector. Storage capacity doubled between 2023 and 2024, helping stabilize variable solar and wind output. The IRAโ€™s clean energy credits could draw over $400 billion in investments by 2032. This boost will help generate energy and support U.S. manufacturing of solar panels and turbines.

Challenges remain. The U.S. needs to modernize its grid and streamline permitting for transmission lines to connect renewable projects to demand centers. But the direction is clear โ€” renewables are becoming the backbone of Americaโ€™s energy system.

China: The Global Powerhouse of Renewables

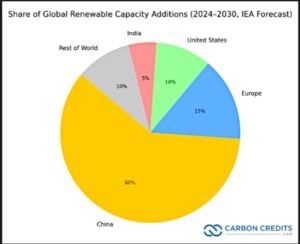
China remains the undisputed leader in renewable energy growth. The IEA projects that China will account for about 60% of all new renewable capacity added worldwide by 2030.

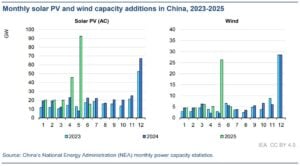
In 2024 alone, China installed more than 260 GW of new renewables โ€” more than the rest of the world combined. Solar made up the majority of this, with over 190 GW of solar capacity added during the year.

Wind power grew by 60 GW. China kept building big onshore and offshore projects in Inner Mongolia, coastal areas, and deserts.

Monthly solar PV and wind capacity additions in China

China now has an estimated 1,400 GW of total renewable capacity, representing about half of the global total. Renewables already supply more than 35% of Chinaโ€™s electricity, up from 27% in 2020.

Government policy is the key driver. China aims to reach 1,200 GW of combined solar and wind capacity by 2030, a target it is likely to achieve five years early. The countryโ€™s large manufacturing base keeps equipment prices low globally. This helps other regions grow their clean energy fleets.

Still, integration challenges persist. Some provinces face grid congestion and curtailment โ€” when renewable power canโ€™t be used due to transmission limits. The IEA recommends that China continue to invest in grid upgrades and flexible storage systems to handle its rapid growth.

India: The Fastest-Growing Emerging Market for Renewables

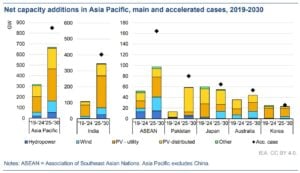
India is now the fastest-growing renewable energy market among developing economies. The IEA expects Indiaโ€™s renewable capacity to nearly double between 2023 and 2030, expanding from around 190 GW to 360โ€“380 GW.

renewable net capacity additions India

Solar energy is leading the charge. In 2024, India added more than 17 GW of solar capacity, supported by large auctions and declining costs. Wind capacity also grew modestly, and new hybrid projects combining solar and wind are improving reliability.

The governmentโ€™s goal is ambitious: 500 GW of non-fossil capacity by 2030, which would cover about 50% of total power demand. India is also expanding its domestic solar manufacturing base to reduce dependence on imports.

Hydropower and bioenergy continue to play supporting roles, particularly in rural electrification. The IEA reports that renewable energy in India cuts over 250 million tonnes of COโ‚‚ emissions each year. This makes India a major player in global emission reductions, second only to China.

However, financing and grid infrastructure remain key hurdles. The report notes that India needs annual clean energy investments of about $60โ€“70 billion through 2030 to meet its targets.

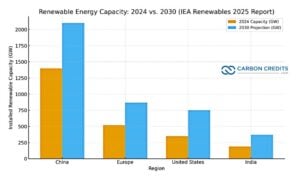
The chart below compares renewable energy capacity in 2024 vs. 2030 projections for the four key regions,ย based on the IEA Renewables 2025 report.

renewable energy capacity by region IEA report
Data source: IEA Report

It clearly shows Chinaโ€™s dominant position, followed by steady growth in Europe and the U.S., and rapid expansion in Indiaโ€™s renewable capacity by the end of the decade.

The Decade of Clean Power: A Turning Point for Global Energy

The combined momentum of China, Europe, the United States, and India is reshaping global energy markets. Together, these four regions will account for almost 90% of all renewable capacity growth by 2030.

The pie chart shows each regionโ€™s share of total global renewable capacity additions from 2024 to 2030, based on the IEA forecast. It alsoย shows how dominant China remains in driving renewable expansion, while Europe, the U.S., and India together account for about one-third of the worldโ€™s clean-energy growth.

share of global renewable capacity additions 2030 IEA 2025 report
Data source: IEA Report

Global renewable electricity capacity is expected to surpass 6,200 GW in 2025 and reach 8,300 GW by 2030 โ€” roughly triple the total in 2015. Solar will remain the dominant source, followed by wind and hydropower.

Yet challenges persist. The IEA warns that grid constraints, permitting delays, and uneven financing could slow progress in developing economies. To stay on track for the net-zero pathway, annual renewable additions must rise to around 800 GW per year by 2030.

Still, the direction is clear. The world is entering a decade where clean power becomes the main driver of growth, investment, and energy security. The actions of these four key players will determine how fast the transition happens and how close we come to a truly sustainable global energy system.

Lucid Motors (LCID) Stock Rises on Record Quarter: Growth, Green Goas, and the Road Ahead

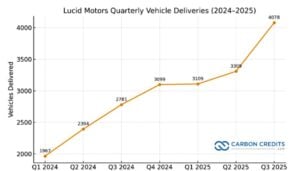
Lucid Motors reached a new milestone in the third quarter of 2025, sending its stock higher. The company delivered 4,078 vehicles, marking its best quarterly performance so far. This was a 46% increase from the same period last year.

Still, the result fell short of expectations. Analysts had forecast around 4,300 deliveries, so the actual number missed the mark by a small but important margin. Lucid also produced 3,891 vehicles during the quarter, below some estimates that predicted over 5,000.

By September 2025, Lucid had produced nearly 10,000 vehicles yea- to-date and delivered over 10,400 units to customers. Earlier this year, the company adjusted its full-year guidance to between 18,000 and 20,000 units, lower than earlier projections.

To meet even the lower end of that range, Lucid would need to produce more than 8,000 vehicles in Q4 โ€” roughly double its previous quarterly output. Itโ€™s a tough target that will test Lucidโ€™s ability to scale up production while managing costs and maintaining quality.

Whatโ€™s Behind Lucidโ€™s Q3 Numbers?

Several factors led to the carmaker’s Q3 achievements:

Tax Credit Surge

One big driver of Lucidโ€™s record quarter was the rush to qualify for the U.S. $7,500 federal EV tax credit, which expired at the end of September. Many customers placed orders to beat the deadline, boosting short-term demand.

Lucid quarterly EV deliveries 2024-2025

Some Lucid models didnโ€™t meet the credit rules for direct purchases. However, buyers accessed the credit through leasing programs. This helped lift deliveries in the months leading up to the creditโ€™s expiry.

New Model Momentum

Lucidโ€™s Gravity SUV, expected to launch soon, helped renew consumer and investor interest. SUVs make up a much larger share of the EV market than luxury sedans, and Lucidโ€™s entry into this segment could expand its customer base.

For now, the Lucid Air sedan remains the companyโ€™s main product. It is known for high efficiency, premium design, and long range. But strong SUV demand suggests Lucidโ€™s future growth will depend heavily on Gravityโ€™s success.

Supply and Production Challenges

Lucid still faces production challenges. Key components like permanent magnets and electronic chips remain hard to source. These supply constraints limit how quickly Lucid can ramp up output, even when demand is healthy.

The company added a second production shift in its Arizona plant this year to increase capacity. However, scaling a young EV factory takes time. Quality checks, supplier reliability, and workforce training all affect production rates.

Some of the production shortfall in Q3 came from Lucidโ€™s focus on delivering existing inventory. The company focused on fulfilling customer orders instead of increasing stock. This decision slightly lowered new production figures.

Market Expectations

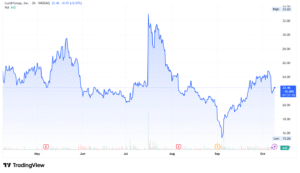
The shortfall also reflects how high investor expectations have become. Lucid is competing in a crowded and fast-moving EV market. When analysts expect more aggressive growth, even a record performance can look underwhelming. Yet, Lucid’s stock climbs up after reporting record growth.ย 

LUCID lcid stock price

Tariffs, inflation, and higher material costs also weigh on the companyโ€™s margins. As global trade changes, the costs of batteries and raw materials like lithium, nickel, and aluminum keep shifting.

Racing with Giants: How Lucid Stacks Up in the EV Arena

Lucidโ€™s Q3 gains came during a strong period for the EV industry overall. Several automakers reported delivery growth in 2025 as consumer confidence in EVs improved and infrastructure expanded.

For comparison, Tesla delivered nearly half a million vehicles in the same quarter. General Motors also set records, delivering over 66,000 EVs across its brands. Lucidโ€™s numbers are far smaller but still show steady progress for a newer company.

What sets Lucid apart is its focus on efficiency and technology. The Lucid Air remains one of the most energy-efficient electric vehicles ever built, capable of traveling over 800 kilometers on a single charge in some models.

That efficiency appeals to luxury buyers and plays into Lucidโ€™s sustainability goals: lower energy use per vehicle helps reduce its carbon footprint and supports net-zero alignment.

Driving Green: How Lucid Builds Efficiency into Every Mile

Lucid Motors positions itself as a sustainability-driven automaker. The company aims to build some of the most efficient EVs in the world while cutting emissions at every stage.

Lower Energy Use and Emissions

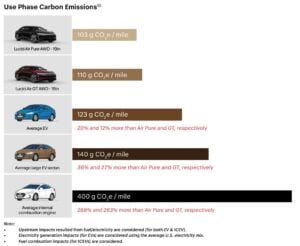
Lucid designs its motors, batteries, and software in-house. This vertical integration allows it to reduce energy losses and improve performance. The Lucid Air has up to 30% lower lifecycle emissions than some other luxury EVs. This is due to its lightweight materials and smart battery management.

Lucid air pure carbon emissions
Source: Lucid

Lucid’s production plant in Casa Grande, Arizona, uses some renewable energy. The company is also looking for more clean energy sources. As production scales, maintaining low emissions per vehicle will be critical.

Transparency and Reporting

Lucid publishes regular sustainability reports outlining its environmental performance and goals. It is a member of the United Nations Global Compact, which promotes corporate responsibility in areas like labor, human rights, and climate action.

Lucid also receives independent ESG risk ratings from firms that measure how well companies manage sustainability challenges. These ratings help investors understand the environmental and social impact of Lucidโ€™s business model.

Circular Design and Materials

The company is working on a circular design approach โ€” recycling and reusing materials wherever possible. For example, battery packs are made for easy disassembly. They can be reused in energy-storage systems after their automotive life ends.

Lucidโ€™s engineers are also researching sustainable materials for interiors, such as plant-based leathers and low-impact textiles. These steps align with the growing demand for environmentally responsible luxury products.

The Roadblocks to Lucidโ€™s Expansion

Lucidโ€™s record quarter is encouraging, but major hurdles remain, including:ย 

  1. Production Ramp-Up: To meet its 2025 goal of 18,000 to 20,000 vehicles, Lucid must roughly double quarterly production in Q4. That requires stable supply chains, smooth plant operations, and strong workforce coordination.
  2. Post-Incentive Demand: Now that the U.S. EV tax credit has expired, sales may dip temporarily. Lucid will need new marketing and financing options to keep the momentum going.
  3. Cost and Competition: Rising input costs and new EV competition could pressure prices. Established automakers like BMW, Mercedes, and Tesla are expanding their electric lineups. Price wars in the EV market are already common.
  4. Scaling Sustainability: As production grows, Lucid must ensure suppliers meet strict sustainability standards. Mining for battery materials, energy use in manufacturing, and logistics all add to its carbon footprint.

Maintaining ESG credibility will be key as the company expands globally. Investors increasingly favor automakers that combine growth with clear climate strategies.

Can Lucid Stay Luxurious, Profitable, and Green?

Lucidโ€™s third quarter proves that its products are gaining traction. Deliveries are increasing, brand awareness is growing, and the company is gradually expanding its production.

But the missed forecasts show that growth alone isnโ€™t enough. To win investor confidence and compete with larger players, Lucid must show consistent, predictable performance.

At the same time, its sustainability promise remains central to its brand identity. Lucid wants to create vehicles that are both luxurious and eco-friendly. The luxury carmaker focuses on using less energy, reducing emissions, and setting new efficiency standards.

If Lucid keeps a balance between high-end innovation and real-world sustainability, it can secure a lasting spot in the fast-changing EV market. But to succeed, it must show it can turn potential into steady, scalable success while also keeping its environmental promises.

Top Gold ETFs to Watch Now as Gold Prices Break $4,000 โ€” IAU, GLD, and GDX Lead the Pack

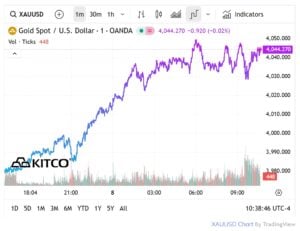
Gold prices climbed to new highs on Monday, with December futures reaching a record $4,014.60 per ounce. The yellow metal stayed strong as investors sought safety amid global uncertainty and a prolonged U.S. government shutdown.

Goldman Sachs raised its December 2026 gold price forecast from $4,300 to $4,900 per ounce, citing steady central bank purchases and renewed investor interest in gold-backed ETFs. Spot gold has surged 52% so far this year, supported by a weaker U.S. dollar and rising geopolitical tensions.

gold prices
Source: KITCO

But first, letโ€™s take a closer look at gold ETFs โ€” what they are and why so many investors are turning to them.

What Are Gold ETFs and Why Are They Popular?

Gold Exchange-Traded Funds (ETFs) mirror the market price of physical gold without requiring investors to hold the metal themselves. Each ETF unit typically represents one gram of 99.5% pure gold, traded on stock exchanges just like shares.

Key features of gold ETFs include:

  • Backed by physical gold stored in secure vaults
  • Real-time pricing and easy trading through Demat accounts
  • No storage or making charges
  • Lower transaction costs and high liquidity
  • Transparent pricing that tracks the spot gold rate

Central Banks and ETFs Fuel the Gold Price Rush

Reports say that Chinaโ€™s central bank has played a major role in driving gold demand. In September, the Peopleโ€™s Bank of China (PBOC) added to its gold reserves for the 11th month in a row, increasing holdings to 74.06 million troy ounces from 74.02 million in August. The value of these reserves also jumped to $283.29 billion, up from $253.84 billion the previous month.

Goldman Sachs expects central banks to keep buying gold, with around 80 tonnes forecast for 2025 and 70 tonnes for 2026, as emerging economies continue to diversify away from the U.S. dollar.

At the same time, strong inflows into gold ETFs are supporting the rally, giving investors an easier and safer way to gain exposure to rising gold prices.

Top Gold ETFs to Watch: IAU, GLD, and GDX

Gold ETFs provide a practical, cost-effective, and transparent way to invest in gold, avoiding the hassle of storage, insurance, and purity verification.

iShares Gold Trust (IAU)

IAU is one of the largest gold ETFs with around $72.7 billion in market capitalization. Each share represents roughly 0.01 ounces of gold, making it affordable for small investors. With a low expense ratio of 0.25%, IAU offers cost-effective access to physical gold.

However, it does not follow a specific ESG (Environmental, Social, and Governance) framework since it directly holds bullion. Any sustainability impact stems from the gold mining and refining practices behind the physical gold it stores.

iShares Gold Trust IAU
Source: Yahoo Finance

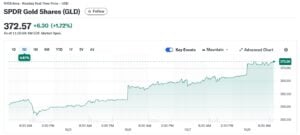
SPDR Gold Shares (GLD)

GLD is the worldโ€™s largest gold ETF, managing about $129 billion in assets. Each share equals one-tenth of an ounce of gold, stored in vaults in London, New York, and Zurich, backed by custodians like JPMorgan Chase and HSBC. It is known for its high liquidity and tight spreads.

SPDR Gold Shares has removed many barriers to investing in gold, such as buying, storing, and insuring it. The fund provides direct exposure to physical gold, minus expenses, without relying on derivatives that carry extra credit risk.

It allows investors to easily access the gold market and include it in their portfolios, offering a strategic way to diversify risk due to goldโ€™s low or negative correlation with other assets.

Like IAU, GLD does not integrate ESG criteria but depends on the ethical and environmental practices of gold suppliers and refiners.

SPDR Gold Shares (GLD)
Source: Yahoo Finance

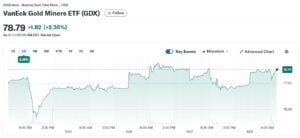
VanEck Gold Miners ETF (GDX)

GDX differs from IAU and GLD as it invests in leading gold mining companies instead of holding physical gold. Managing around $22.54 billion in assets, GDX tracks major miners such as Newmont and Barrick Gold.

The fund provides leveraged exposure to gold prices through miner performance. Since it involves mining operations, ESG factors play a more direct role covering carbon reduction, responsible sourcing, labor safety, and community development.

From an investment perspective, GDX is a highly liquid ETF with substantial assets, suited for investors seeking gold exposure and prepared for higher volatility. It benefits from inflation or economic uncertainty, offering exposure to global gold miners.

While mining stocks can be riskier than gold due to company and operational factors, GDX spreads risk across multiple large and mid-sized miners.

gdx gold etf
Source: Yahoo Finance

Sustainability Perspective: Physical Gold vs. Gold Miners

Physical gold ETFs like IAU and GLD mainly reflect the sustainability impact of gold mining through their bullion holdings. They donโ€™t actively engage in ESG initiatives. In contrast, GDX connects investors directly to mining companies that can influence sustainability outcomes through operational decisions.

Investors focused on responsible investing should assess the ESG performance of individual mining companies within funds like GDX. This approach allows for more transparency and accountability in evaluating how sustainable practices affect returns and risk exposure.

Goldโ€™s Shine Isnโ€™t Fading Anytime Soon: A Smart Safe-Haven Investment

It’s now clear that the gold price is hitting record highs due to central banks buying more, strong ETF inflows, and ongoing global uncertainty. Because of this, ETFs like IAU, GLD, and GDX give investors different ways to invest in gold, depending on their needs for liquidity, cost, and even sustainability.

At the same time, the market is watching for possible Federal Reserve rate cuts and dealing with economic uncertainty. Goldโ€™s appeal as a safe-haven asset remains strong. And Goldman Sachsโ€™ higher forecast adds to investor confidence โ€” the gold story is far from over.

gold prices

Also, institutional investors are increasingly using gold ETFs to balance portfolios and protect against stock market swings. Experts recommend investing gradually and diversifying, especially after goldโ€™s sharp price jump. Long-term investors like these ETFs because they are affordable, simple, and easy to manage.

Plus, rising interest in gold is encouraging some investors to explore other commodity ETFs, such as silver and industrial metals, to spread their risk.

In short, gold ETFs are a favorite in 2025 for their simplicity, transparency, and ability to protect against inflation and market ups and downs. Both retail and institutional investors see them as a safe and reliable way to invest in uncertain times.

U.S. Tungsten Revival: Rising Demand, Tight Supply, and Top Stocks to Watch in 2025

Tungsten, a critical mineral with unmatched heat resistance and strength, is gaining global attention. It’s dense, brittle, and grayish-white, with the highest melting point and tensile strength of any pure metal. These traits make it vital for high-performance applications. and industries needing extreme durability.

With China controlling most of the supply, the U.S. and allies are racing to secure domestic sources and diversify supply chains. Let’s deep dive into the complete outlook of the tungsten market below:

Demand Drivers: Why Tungsten Keeps Rising in Importance

The tungsten market expanded from USD 6.04 billion in 2024 to USD 6.50 billion in 2025. It is projected to grow at a CAGR of 7.95%, reaching USD 11.16 billion by 2032.

Its demand is rising due to industrial and defense needs. Key drivers include:

  • Electronics & Semiconductors: Vital for high-performance chips and circuits.
  • Defense & Aerospace: Used in rocket nozzles and armor-piercing ammunition. It also strengthens steel alloys for aerospace and defense.
  • Tungsten is used in turbine blades and as a lead substitute in ammunition.
  • Industrial Tools: Crucial for cutting and drilling in mining, construction, lighting, welding, and manufacturing.
  • Green technology and electrification:ย Increasing use of tungsten in electric vehicle batteries, energy storage, and renewable energy technologies

Industry experts are indicating that global tungsten demand is expected to rise in 2025 and the next few years. With geopolitical tensions increasing, the U.S. and allies anticipate further growth as supply diversification becomes essential.

Chinaโ€™s Tight Grip on Tungsten Supply

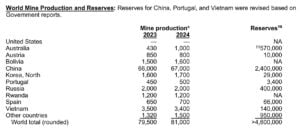
Tungsten is found worldwide, but most supply comes from China. It produces over 80% of global tungsten and holds more than half of the known reserves. Vietnam and Russia follow, contributing only a small share. Other producers like Spain, Austria, Bolivia, and Rwanda account for just 1% to 2% each.

Interestingly, other countries own about 35% of global reserves but produce only 1%. This gap shows growth potential but highlights challenges like high costs and long permitting times.

China also controls production. In late 2024, Beijing introduced new export licensing rules for tungsten, tightening supply further. Analysts view these controls as part of Chinaโ€™s strategy in global trade.

Global Push for Supply Chain Resilience

China’s dominance has raised concerns. Countries are diversifying their tungsten supply chains. New projects in Australia, South Korea, Canada, and Africa show promise, but scaling up will take years.

Vietnam, Russia, and Spain are boosting production. Smaller nations like Rwanda are gaining attention for their resources. However, these efforts face high costs and technical challenges.

China’s market control is expected to last until the early 2030s, but momentum is shifting toward more resilient supply options.

TUNGSTEN supply
Source: USGS

U.S. Tungsten Dependence: A Strategic Risk for Defense

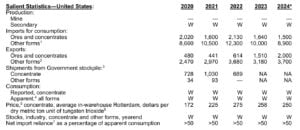
As per the U.S. Geological Survey, the U.S. has not mined/ tungsten since 2015. It relies mostly on imports, especially from China. Notably, in 2023 U.S. imported over 10,000 metric tons of tungsten.

Most U.S. tungsten is used in cemented carbide parts for construction, mining, and drilling. The rest goes to specialty steels, defense alloys, electronics, and chemicals.

This dependence poses serious risks as tungsten is vital for defense applications, including armor-piercing munitions and missile systems. Thus, supply disruptions could threaten U.S. military readiness and high-tech industries.

U.S. tungsten
Source: USGS

DoDโ€™s Big Investments and New Rules

The U.S. Department of Defense (DoD) is boosting efforts to secure tungsten, a critical metal for defense systems. Since last year, it has directed millions toward U.S. and allied projects.

In July 2025, it awarded $6.2 million under the Defense Production Act to Golden Metal Resources for the Pilot Mountain project in Nevada, the largest undeveloped tungsten deposit in the U.S.

The project aims to restore domestic production, reduce reliance on Chinaโ€™s 80% market share, and prepare for the 2027 ban on China- and Russia-sourced tungsten in defense contracts.

Procurement Rules

A new U.S. law prevents the Pentagon from sourcing tungsten, magnets, and other critical materials from adversarial nations like China, Russia, Iran, and North Korea. By January 2027, these rules will also cover the mining stage. This means tungsten mined in these countries canโ€™t enter U.S. defense supply chains.

Thus, the U.S. Department of Defense now views tungsten as a national security issue. In summary, its strategy focuses on:

  • Diversifying supply chains beyond China.
  • Funding domestic exploration and allied projects.
  • Expanding metallurgical testing and engineering studies.
  • Tightening procurement rules to phase out adversarial tungsten by 2027.

This effort demonstrates a strong commitment to boosting domestic tungsten production for new defense systems and advanced manufacturing. Additionally, it also aims to build secure supply partnerships with allies.

Top Tungsten Stocks Gaining Investor Attention

In 2025, tungsten stocks are attracting attention as the metal becomes essential across industries. Rising demand and tight supply make these stocks appealing. Investors value tungsten for its strategic role in technology and its relatively stable prices compared to other critical minerals.

Elemental Altus Royalties Corp. (ELE.V) Rises on Strong Momentum

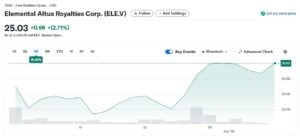
Canada-based Elemental Altus trades around $15.76 USD (OTC) and CAD 24.37 (TSX Venture) as of October 2025. Its shares climbed nearly 47% in six months, outperforming peers, with a market cap of $388 million USD. Analysts set the TSX target price at CAD 25.92, signaling upside potential.

In September 2025, it merged with EMX Royalty to form Elemental Royalty Corp. Tether Investments backed the deal with $100 million USD to buy 75 million shares at CAD 1.84 each. The capital fuels growth, acquisitions, and expansion in tungsten, rare earths, and other critical minerals.

Elemental Altus leads in the critical minerals’ royalty space, with strong stock momentum and strategic investments positioning it for growth.

Elemental Altus Royalties Corp.
Source: Yahoo Finance

American Tungsten (TUNG) Fuels U.S. Supply Revival

American Tungsten Corp. (TUNG) is gaining attention as a pure-play tungsten stock. In February 2025, it hit an all-time high of CA$2.37, reflecting strong investor confidence in the companyโ€™s efforts to develop domestic tungsten resources.

Currently, it is trading at around CAD 1.84 per share. Analysts forecast the stock to rise through the rest of 2025 and into 2026.

With a market capitalization of roughly CAD 25.72 million, the stock has experienced some volatility. This was influenced by critical minerals sector trends and tungsten market dynamics.

American Tungsten (TUNG)
Source: Yahoo Finance

However, the company’s performance remains closely tied to progress in U.S. tungsten projects, government support, and global supply-demand trends.

In March, the companyย announced that its application to join the U.S. Defense Industrial Base Consortium (DIBC) had been approved. The consortium, managed by Advanced Technology International (ATI) for the Department of Defense (DoD), connects private-sector companies with the U.S. Government to strengthen the defense supply chain.

Another key development is the IMA Mine Project in Lemhi County, Idaho, a major step in restoring U.S. tungsten production. This critical mineral supports tank armor, hypersonic weapons, submarine hulls, and semiconductors.

The mine sat idle for nearly 70 years. It is now being redeveloped to meet rising domestic demand. With a few publicly traded tungsten companies existing in North America, American Tungsten is the top choice for investors in U.S. supply chains.

The Rise of Tungsten Juniors

However, this year, several junior mining companies focusing on tungsten in the U.S. are also gaining attention, particularly those developing critical mineral resources to strengthen domestic supply chains.

One such example is Patriot Critical Minerals. It owns100% of the MEGA Deposit in Elko County, Nevada, a strategically located resource that could help close the domestic tungsten supply gap.

The deposit contains approximately 19 million tonnes of mineralized material, with about 32,300 tonnes of contained tungsten trioxide.

Tungsten Prices Stay High Amid Tight Supply

In September 2025, tungsten bar FOB prices held steady at USD 95โ€“97 per kg. Meanwhile, tungsten concentrates (scheelite and wolframite) traded at RMB 284,000 per ton. This marked a 1.1% drop from peak levels but doubled the price from early 2025, showing strong market volatility.

tungsten prices
Source: SMM

However, global prices continue to fluctuate due to Chinese export restrictions, production issues, and rising demand in defense, aerospace, and electronics. At the same time, supply-demand gaps, geopolitical tensions, and stockpiling keep prices elevated.

In conclusion, rising demand, tight global supply, and national security concerns make tungsten a strategic mineral. Consequently, U.S. projects and companies like Elemental Altus, American Tungsten, and Patriot Critical Minerals are actively reducing reliance on China.

As production ramps up, tungsten will play an increasingly vital role in defense, technology, and industrial applications.

TSLA Stock Slides After Tesla Unveils โ€˜Affordableโ€™ Model Y and Model 3 โ€” Investor Confidence Wavers

Tesla is once again in the spotlight of the EV world with the launch of its most affordable versions of the Model Y SUV and Model 3 sedan. On October 7, 2025, the company unveiled โ€œStandardโ€ trims of its two bestsellers, priced at $39,990 for the Model Y and $36,990 for the Model 3. The move marks Teslaโ€™s latest attempt to reignite demand amid slowing sales, fierce competition, and the loss of the $7,500 U.S. federal EV tax credit.

While the announcement initially stirred excitement, investor sentiment quickly turned cautious. Many had hoped for even deeper price cutsโ€”possibly closer to the long-promised $25,000 Tesla. The unveiling highlighted a strategic shift by Elon Musk: opting for affordability through existing models rather than introducing a completely new low-cost vehicle platform.

Breaking Down Teslaโ€™s New โ€œStandardโ€ Models

The new โ€œStandardโ€ variants are stripped-down versions of Teslaโ€™s premium trims. They feature fewer upgrades and shorter ranges but come with the same core technology, including access to Teslaโ€™s Supercharger network.

Key details:

  • The Model Y Standard is about $5,000 cheaper than previous trims.
  • The Model 3 Standard starts under $37,000, but still well above investor hopes for a sub-$30,000 model.
  • The new models aim to lift sales volumes and defend market share against growing competition from BYD, Rivian, and traditional automakers entering the EV market.
  • Muskโ€™s earlier $25,000 EV projectโ€”rumored to be Teslaโ€™s โ€œModel 2โ€โ€”was scrapped last year in favor of modifying current production lines.

For Tesla, the real challenge is finding the right balance between keeping prices low and staying profitable. The price cuts could boost sales, but at the same time, they might reduce profits since battery materials and shipping costs are still high.

Why TSLA Stock Dipped Despite Pricing Push?

Despite the buzz surrounding the October 7 announcement, Teslaโ€™s stock (TSLA stock) reflected mixed investor emotions. Shares closed down nearly 5% at $433 after spiking briefly ahead of the event. The stock has still gained about 7% in 2025, but it has underperformed the S&P 500 and remains highly sensitive to quarterly delivery numbers and market expectations.

Tesla shares hit $453.25 earlier that day, marking a 12.2% gain year-to-date before the decline. The volatility suggested that while investors welcomed the effort to boost affordability, many were disappointed that prices werenโ€™t slashed further.

Analysts also warned that the new lower-priced versions might hurt sales of Teslaโ€™s more expensive models, which could slow down the companyโ€™s overall growth.

tsla stock tesla
Source: Yahoo Finance

Analysts Turn Conservative

Wall Streetโ€™s tone toward Tesla has shifted from bullish to cautious. The current analyst consensus rates Tesla as a โ€œHold,โ€ with an average price target of $342.82โ€”implying potential downside from current trading levels.

Options data also reflect waning enthusiasm. Traders have sold off most October $470 call options, while implied volatility has dropped 27%, signaling a more restrained outlook.

Analysts from Wedbush noted that while the new Standard models could help Tesla maintain its quarterly delivery pace, the pricing left them โ€œrelatively disappointed.โ€ The companyโ€™s next few quarters will test whether these trims can sustain demand without eroding profitability.

Q3 2025: Record Deliveries but Margin Strain

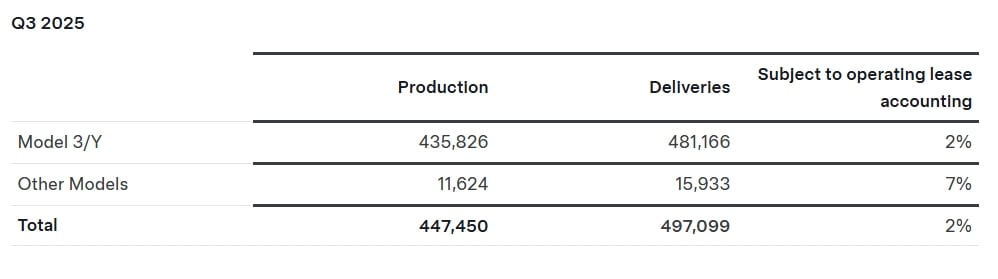
Teslaโ€™s Q3 2025 results gave the company some breathing room. It delivered a record 497,099 vehicles, beating Wall Street expectations and setting a new milestone. Despite this success, financial challenges persist.

tesla Q3
Source: Tesla

Earnings per share are projected at $0.37, a 40% decline compared to the same quarter last year. Furthermore, the expiration of the $7,500 U.S. EV tax credit and ongoing price cuts have put pressure on profitability.

Still, Teslaโ€™s balance sheet remains strong, with $37 billion in cash, easily covering its $30 billion in short-term debt.

Delivery growth suggests Tesla is running efficiently, but analysts remain cautious. Many believe Q3 sales were boosted by customers rushing to buy before the tax credit expired. This front-loading of demand could lead to softer sales in Q4.

Thus, even with strong deliveries, TSLA stock remains sensitive to these financial pressures. Investors are closely watching to see whether Tesla can maintain momentum without further cutting prices and compressing its margins.

Teslaโ€™s Strategic Pivot: From EVs to AI and Robotaxis

Elon Musk has been steering Tesla toward artificial intelligence, robotaxis, and humanoid robotsโ€”technologies he believes will drive the companyโ€™s next phase of growth. In late 2024, he suggested that the long-awaited affordable car might be used mainly as a robotaxi rather than a regular consumer vehicle.

This approach aligns with Teslaโ€™s broader strategy to prioritize autonomous driving and recurring software revenue. A lower-priced model could help build a future robotaxi fleet and open new ways to earn from Teslaโ€™s self-driving features.

However, investors are split. Some see this as a smart move that could strengthen Teslaโ€™s position in mobility technology. Others worry it could distract from Teslaโ€™s core EV business, which faces shrinking margins, rising competition, and high expectations from the market.

Competition Heats Up Across the EV Market

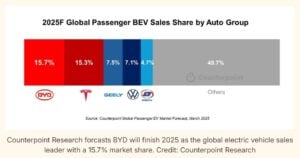
Teslaโ€™s dominance is being tested on all fronts. In China, BYD continues to outpace Tesla in sales volume. In Europe and the U.S., automakers like Volkswagen, Ford, and GM are scaling their EV production lines with aggressive pricing strategies.

The loss of federal incentives further complicates Teslaโ€™s position. Competitors that still qualify for subsidies can offer cheaper, effective prices, eroding Teslaโ€™s competitive edge. The company must rely on its brand power, efficiency, and innovation to sustain growth.

Even though Teslaโ€™s growth story remains compelling, several risks loom large. Industry pundits highlight the following challenges.

  • Competition: Legacy automakers and new startups are closing the innovation gap quickly.
  • Incentive Losses: The expiration of the $7,500 U.S. EV tax credit could dampen sales momentum.
  • Supply Chain Sensitivity: Battery material shortages and global logistics disruptions could slow production.
  • Margin Pressure: Price cuts, cost inflation, and heavy R&D investments are squeezing profits.
  • Valuation Risk: With a valuation above 100x earnings, even small setbacks could trigger sharp stock corrections.

EV sales

RELATED:

Balancing Growth with Sustainability

Now talking about sustainability, Tesla is ahead in the game. The company reported a total carbon footprint of 56 million metric tons COโ‚‚e in 2024, including emissions from operations and supply chains.

  • Yet, Teslaโ€™s vehicles helped customers avoid 20 million metric tons of COโ‚‚e that year compared to traditional cars.

Regulatory credits also continue to play a big role in Teslaโ€™s profits. In 2024, the company earned $2.76 billion from selling carbon creditsโ€”a 54% jump from 2023. These credits made up nearly 39% of Teslaโ€™s net income, showing just how important carbon markets remain to the companyโ€™s bottom line.

tesla emissions
Source: Tesla

Can Teslaโ€™s โ€œAffordableโ€ EVs Sustain Long-Term Growth?

Teslaโ€™s new โ€œStandardโ€ lineup is a tactical reset, not a revolution. It aims to boost demand, defend market share, and protect margins in a crowded EV market.

Still, investors are unsure. Tesla posts record deliveries and holds strong cash reserves, yet its growth depends on balancing affordability, innovation, and profitability.

At the same time, the company is investing heavily in AI and autonomous driving. The big question is: will Tesla succeed by selling more cars or by getting more cars to drive themselves?

These affordable EVs may keep sales steady, but bigger challenges lie ahead. Rising competition, tight margins, and shifting investor sentiment will test Teslaโ€™s ability to stay profitable while driving innovation forward.