Disseminated on behalf of Surge Battery Metals.
Every time instability erupts in the Middle East, North Americans feel it where it hurts most—at the gas pump. It happened in 1979, when the Iranian Revolution sent shockwaves through global energy markets. Oil supplies tightened. Prices surged, and inflation followed. Entire economies slowed under the pressure.
For millions of households, the crisis’s impact was personal. It showed up in longer lines at gas stations and rising costs across daily life.
Nearly five decades later, the pattern is repeating.
Renewed tensions across key oil-producing regions are once again tightening global supply. Prices are rising. Consumers are feeling the impact. And once again, events unfolding thousands of miles away are shaping the cost of energy at home.
This pattern suggests a persistent structural vulnerability in North America’s exposure to global oil‑supply shocks. The region still depends heavily on global oil markets. That means supply disruptions, no matter where they occur, can quickly ripple through the system.
The result is a familiar cycle: geopolitical instability leads to supply concerns, which drive up prices, which then feed directly into the cost of living.
A Cycle Consumers Know All Too Well
When prices spike, households adjust. Commuters rethink travel. Businesses absorb higher costs or pass them on. Inflation pressures build. The impact spreads far beyond the energy sector.
With average gasoline prices currently around $4 per gallon in the US ($5.50 in California), or roughly $1.05 US per liter ($1.45 in California), the connection between global events and local fuel prices is no longer theoretical – it is a lived experience. This is why energy security is increasingly framed as both a policy concern and a kitchen‑table issue.
The events of 1979 were a warning. Today’s rising prices are another. The difference is that North America now has more options than it did back then.
Electric vehicles, battery storage, and renewable power systems are no longer future concepts. They are already part of the energy mix. And for those who have made the shift, the experience is very different, and the transition is already complete.
Instead of watching fuel prices climb, they are plugging in.
Graham Harris, Chairman of Surge Battery Metals, has spoken openly about this shift in practical terms. While rising oil prices create uncertainty at the pump, he charges his electric vehicle at home.
The contrast between gasoline dependency and electrification is becoming more visible.
When oil prices rise, gasoline costs follow. But electricity prices tend to be more stable, especially when supported by domestic generation and renewable sources. That difference is simple but powerful. It changes how people experience energy volatility.
One system is exposed to global shocks. The other is increasingly tied to domestic infrastructure. This contrast highlights how the energy transition is reshaping exposure to global price shocks.
Some analysts increasingly frame the energy transition not only as a climate imperative but also as a strategy to reduce exposure to external risk. It relates to questions of control over where energy comes from, how it is produced, and how stable it is over time.
And at the center of that transition is one critical material: lithium.
Lithium: The Foundation of Energy Independence
Lithium is the core component of modern battery technology. It powers electric vehicles, supports grid-scale energy storage, and plays a growing role in advanced defense systems.
As electrification expands, demand for lithium is rising across multiple sectors.
But here is the challenge: much of today’s lithium supply still comes from outside the United States. This creates a familiar dynamic.
Just as oil dependency has long exposed North America to geopolitical risk, reliance on foreign lithium supply introduces a new layer of vulnerability. The commodity is different, but the structure is similar.
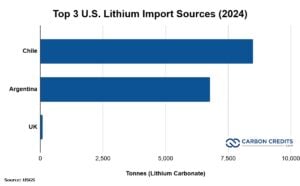
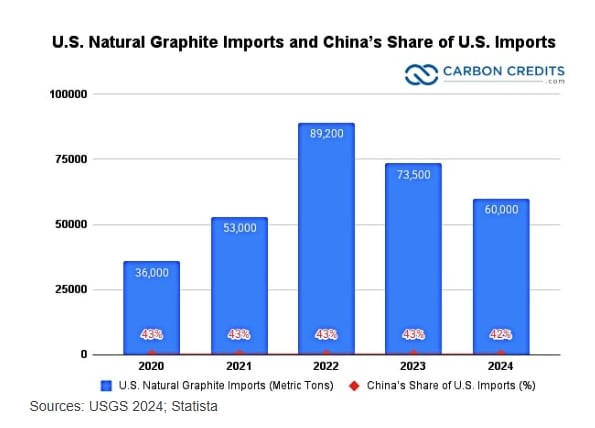
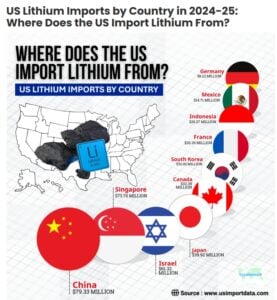
The United States imported the majority of its lithium from Chile and Argentina in 2024. Together, they accounted for roughly 98% of the total supply. Smaller volumes were sourced from the UK, France, and China.
That is why domestic production is becoming a central focus of energy and industrial policy.
In March 2025, Donald Trump signed an executive order titled “Immediate Measures to Increase American Mineral Production.” The directive called for faster permitting, expanded development, and reduced reliance on foreign supply chains for critical minerals.
The message of the order was clear: building domestic capacity is now a strategic priority.
A Domestic Resource Takes Shape in Nevada
Within this broader shift, projects like Surge Battery Metals’ (TSX-V: NILI | OTCQX: NILIF) Nevada North Lithium Project (NNLP) are gaining attention.
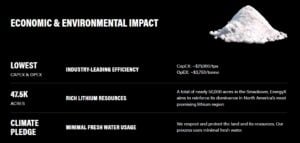
NNLP hosts a measured and indicated resource of 11.24 million tonnes of lithium carbonate equivalent (LCE) at an average grade of 3,010 ppm lithium, based on company disclosures. This makes it the highest-grade lithium clay resource identified in the United States to date.
A 2025 Preliminary Economic Assessment (PEA) outlines the project’s scale:
- After-tax NPV (8%): US$9.21 billion
- Internal Rate of Return (IRR): 22.8%
- Mine life: 42 years
- Average annual production: ~86,300 tonnes LCE
- Employment: ~2,000 construction jobs and ~350 long-term operational roles
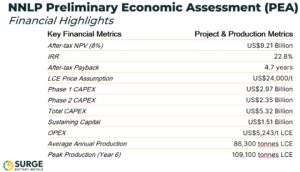
These figures indicate potential in terms of scale, longevity, and the ability to contribute to domestic supply if the project moves forward. At full production, NNLP has the potential to rank among the larger lithium-producing assets globally, based on third-party analysis.
Recent drilling results announced by Surge Battery Metals have further strengthened NNLP’s profile as a standout asset. In February 2026, step-out drilling found a 31-meter intercept with 4,196 ppm lithium from surface. This is much higher than the project’s average of 3,010 ppm Li. It also extends high-grade mineralization nearly 640 meters beyond the current resource boundary.
Infill drilling showed a steady, thick, high-grade core. It included intercepts like 116 meters at 3,752 ppm Li and 32 meters at 4,521 ppm Li. These results support future resource expansion. They also highlight the project’s scale, quality, and technical readiness as it prepares for a Pre-Feasibility Study.
Beyond the project itself, it reflects a broader policy and industry shift toward building more domestically anchored energy systems.
From Oil Dependency to Mineral Security
The connection between oil and lithium is not always obvious at first glance. Oil fuels internal combustion engines, while lithium supports batteries and energy‑storage systems, with distinct technologies and supply chains.
But the underlying issue is the same. Dependence on external sources creates exposure to external risk.
In the case of oil, that risk has played out repeatedly over decades. Supply disruptions, price shocks, and geopolitical tensions have all shaped the market.
With lithium, the industry is earlier in its development. But the stakes are rising quickly.
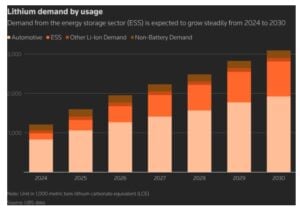
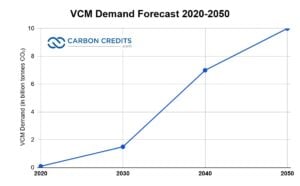
Global demand for lithium grew about 30 % in 2024, driven mainly by batteries for electric vehicles and energy storage, according to IEA data. Demand in 2025 continued at high rates, and under current policies, lithium demand is projected to grow fivefold by 2040 compared with today.
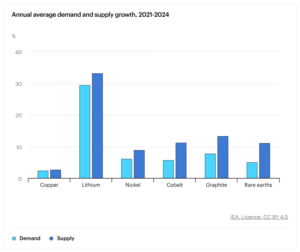
At the same time, supply growth is struggling to keep pace with demand forecasts. These trends show that ensuring a stable, secure supply is becoming just as important as expanding production.
That is where domestic projects come in, such as Surge Battery Metals’ NNLP.
They may not eliminate global market dynamics, but they can reduce exposure to them. They can provide a buffer against volatility. And they can support a more stable, self-reliant energy system.
A Turning Point – or Another Warning?
While history does not repeat in the same way, similar patterns can be observed.
The oil shocks of the 1970s revealed a vulnerability that shaped energy policy for decades. Today’s market signals are pointing to a similar challenge—this time at the intersection of oil dependency and critical mineral supply.
The difference is that the range of policy and technological options available today is broader. Electrification is already underway. Battery technology is advancing. Domestic resource development is gaining policy support. The pieces are in place.
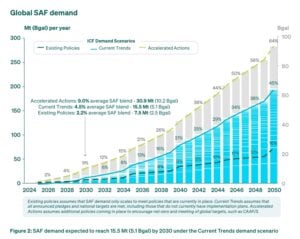
Data from the International Energy Agency’s Global EV Outlook 2025 shows that global battery demand reached a historic milestone of 1 terawatt-hour (TWh) in 2024. This surge was mainly due to the growth of electric vehicles (EVs).
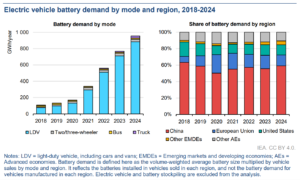
By 2030, demand is expected to more than triple, exceeding 3 TWh under current policies. This reflects not only rising EV adoption but also expanding stationary storage demand. Both of which rely on critical minerals like lithium.
Electric vehicles continue to displace traditional oil use as well. The same IEA analysis shows that by 2030, EVs will replace over 5 million barrels of oil daily. This is about the size of a major country’s transport sector, highlighting how electrification is changing energy markets.
What remains uncertain is the pace at which these changes will occur.
Will rising fuel prices once again fade as markets stabilize? Or will they serve as a catalyst for deeper structural shifts?
That question matters not just for policymakers or investors, but for everyday consumers.
Because at the end of the day, energy transitions are not measured in policy papers. They are measured in daily decisions—how people power their homes, fuel their vehicles, and respond to rising costs.
DISCLAIMER
New Era Publishing Inc. and/or CarbonCredits.com (“We” or “Us”) are not securities dealers or brokers, investment advisers, or financial advisers, and you should not rely on the information herein as investment advice. Surge Battery Metals Inc. (“Company”) made a one-time payment of $75,000 to provide marketing services for a term of three months. None of the owners, members, directors, or employees of New Era Publishing Inc. and/or CarbonCredits.com currently hold, or have any beneficial ownership in, any shares, stocks, or options of the companies mentioned.
This article is informational only and is solely for use by prospective investors in determining whether to seek additional information. It does not constitute an offer to sell or a solicitation of an offer to buy any securities. Examples that we provide of share price increases pertaining to a particular issuer from one referenced date to another represent arbitrarily chosen time periods and are no indication whatsoever of future stock prices for that issuer and are of no predictive value.
Our stock profiles are intended to highlight certain companies for your further investigation; they are not stock recommendations or an offer or sale of the referenced securities. The securities issued by the companies we profile should be considered high-risk; if you do invest despite these warnings, you may lose your entire investment. Please do your own research before investing, including reviewing the companies’ SEDAR+ and SEC filings, press releases, and risk disclosures.
It is our policy that information contained in this profile was provided by the company, extracted from SEDAR+ and SEC filings, company websites, and other publicly available sources. We believe the sources and information are accurate and reliable but we cannot guarantee them.
CAUTIONARY STATEMENT AND FORWARD-LOOKING INFORMATION
Certain statements contained in this news release may constitute “forward-looking information” within the meaning of applicable securities laws. Forward-looking information generally can be identified by words such as “anticipate,” “expect,” “estimate,” “forecast,” “plan,” and similar expressions suggesting future outcomes or events. Forward-looking information is based on current expectations of management; however, it is subject to known and unknown risks, uncertainties, and other factors that may cause actual results to differ materially from those anticipated.
These factors include, without limitation, statements relating to the Company’s exploration and development plans, the potential of its mineral projects, financing activities, regulatory approvals, market conditions, and future objectives. Forward-looking information involves numerous risks and uncertainties and actual results might differ materially from results suggested in any forward-looking information. These risks and uncertainties include, among other things, market volatility, the state of financial markets for the Company’s securities, fluctuations in commodity prices, operational challenges, and changes in business plans.
Forward-looking information is based on several key expectations and assumptions, including, without limitation, that the Company will continue with its stated business objectives and will be able to raise additional capital as required. Although management of the Company has attempted to identify important factors that could cause actual results to differ materially, there may be other factors that cause results not to be as anticipated, estimated, or intended.
There can be no assurance that such forward-looking information will prove to be accurate, as actual results and future events could differ materially. Accordingly, readers should not place undue reliance on forward-looking information. Additional information about risks and uncertainties is contained in the Company’s management’s discussion and analysis and annual information form for the year ended December 31, 2025, copies of which are available on SEDAR+ at www.sedarplus.ca.
The forward-looking information contained herein is expressly qualified in its entirety by this cautionary statement. Forward-looking information reflects management’s current beliefs and is based on information currently available to the Company. The forward-looking information is made as of the date of this news release, and the Company assumes no obligation to update or revise such information to reflect new events or circumstances except as may be required by applicable law.
Disclosure: Owners, members, directors, and employees of carboncredits.com have/may have stock or option positions in any of the companies mentioned: .
Carboncredits.com receives compensation for this publication and has a business relationship with any company whose stock(s) is/are mentioned in this article.
Additional disclosure: This communication serves the sole purpose of adding value to the research process and is for information only. Please do your own due diligence. Every investment in securities mentioned in publications of carboncredits.com involves risks that could lead to a total loss of the invested capital.
Please read our Full RISKS and DISCLOSURE here.