$10 Trillion in Carbon Cost? How U.S. Emissions Hit the Global Economy

Climate change is not only a physical threat, but it also affects the world’s economy. A major new study published in the journal Nature on March 25, 2026, puts a clear number on this impact. It finds that carbon dioxide (CO₂) emissions from the United States caused about $10.2 trillion in total economic damage worldwide between 1990 and 2020. This makes the U.S. the largest single contributor to climate-related economic loss over that period.

The study shows that emissions slow economic growth in many countries. Rising temperatures cut productivity, lower output, and hurt long-term economic performance around the globe.

Marshall Burke, the lead author of the study, remarked:

“If you warm people up a little bit, we see very clear historical evidence, you grow a little bit less quickly. If you accumulate those effects over 30 years, you just get a really large change by the end of 30 years. It’s like death by a thousand cuts. And you have people being harmed who did not cause the problem, and that feels just fundamentally unfair.”

The researchers focused on carbon dioxide, the most common greenhouse gas. They used data on how temperature affects economic activity and then linked that to how much CO₂ different countries have emitted since 1990. This method links climate science to real economic results, including slower growth, lower productivity, and smaller national outputs.

Counting the Dollars: $10 Trillion in U.S.-Linked Damage

One of the study’s central findings is striking. From 1990 to 2020, U.S. emissions likely caused around $10.2 trillion in global economic damage. This means that warming linked to U.S. emissions has reduced economic production across many countries. The study links these impacts to heat’s long-term effects on labor, agriculture, and overall economic growth.

The damage is not confined to other nations. Roughly 30% of that $10.2 trillion figure is estimated to have occurred within the United States itself. In other words, U.S. emissions have slowed economic growth at home as well as abroad. The remaining impacts are spread across the global economy.

The researchers found that U.S. emissions led to about $500 billion in damage in India and around $330 billion in Brazil during that time. These figures show how carbon released in one area can affect economies far away.

economic damage of global warming
Source: Burke, M., Zahid, M., Diffenbaugh, N.S. et al. Quantifying climate loss and damage consistent with a social cost of carbon. Nature 651, 959–966 (2026). https://doi.org/10.1038/s41586-026-10272-6

A New Framework for Loss and Damage

The Nature study introduces a new framework for assessing what scientists call “loss and damage.” This term refers to harms that cannot be prevented by reducing emissions or avoided through adaptation alone.

The study uses economic data and climate models. It tracks how temperature changes over the years impact economic output.

  • To put the numbers into context: one tonne of CO₂ emitted in 1990 is estimated to have caused about $180 in global economic damages by 2020.

But that same tonne is projected to cause an additional $1,840 of cumulative damage by 2100, as warming continues and its effects compound over time. This highlights that past emissions still contribute to future economic harm.

The researchers highlight that these estimates focus on economic output, like goods and services. They do not account for all types of climate damage. They do not include costs from loss of life, health impacts, biodiversity collapse, cultural heritage losses, or many kinds of infrastructure damage. These excluded impacts could raise the true total cost of climate change even further.

The Social Cost of Carbon Revisited

This study is part of a broader scientific effort to understand the economic impacts of climate change. Climate and economic models show that rising temperatures are already slowing economic growth. If emissions stay high, this slowdown will get worse in the future.

Analyses by major international institutions and research groups project that climate change could reduce global GDP by a significant percentage by mid-century. This is compared to scenarios with strong mitigation, though exact figures vary by method.

The concept of estimating a “social cost of carbon” (SCC) — a monetary estimate of economic damage per tonne of CO₂ — has been used in policy analysis for years. It helps governments weigh trade-offs in climate policy. For example, they can decide how much to invest in emissions cuts versus adaptation.

social cost of carbon
Source: Resources for the Future

However, traditional SCC estimates have been debated. They depend on assumptions about future growth, discount rates, and climate sensitivity. The Nature study advances this approach by tying economic outcomes directly to observed climate impacts.

Economists and climate scientists agree that warming impacts several areas. These include agricultural yields, labor productivity, energy demand, and health outcomes. These effects reduce economic output and increase costs for businesses and governments. The latest research makes these links more explicit by assigning dollar values to the historical impacts of emissions.

Equity and Global Responsibility

The research’s results also highlight important equity questions. Low-income countries often face bigger economic impacts compared to their emissions histories.

For example, nations with warmer climates and more fragile infrastructure may experience greater output losses due to temperature increases. These effects grow over time and can worsen existing development challenges.

At the same time, richer countries with higher historical emissions may take a larger share of responsibility for damage. The Nature study shows it is possible to calculate responsibility in monetary terms. However, turning those numbers into legal or financial obligations is still complex.

Remarkably, the paper also shows that climate damage can be linked to specific activities, individuals, and companies. Burning fossil fuels for long flights greatly adds to warming.

  • Just one round-trip intercontinental flight each year for ten years can cause about $25,000 in global economic damage by 2100.
Estimated damages from emissions related to individual behaviors or firm output over varying time periods
Estimated damages from emissions related to individual behaviors or firm output over varying time periods. Source: https://doi.org/10.1038/s41586-026-10272-6

Bill Gates’ emissions stand out due to his frequent air travel and high energy use. These personal and business choices significantly contribute to his overall impact. Saudi Aramco, a top fossil fuel producer, has caused an estimated $3 trillion in climate-related economic damage worldwide since 1991.

Tail Risks and Future Costs

The researchers also point toward the future. It finds that future damages from past emissions are much larger than the losses already accrued.

Since CO₂ remains in the atmosphere for centuries, its warming effects — and the economic damages linked to them — will persist well beyond 2020. This “tail risk” means that the total cost of historical emissions could rise sharply over the rest of this century.

Climate risk is increasingly integrated into economic planning and finance. Governments, businesses, and international institutions are incorporating climate scenarios into investment decisions and risk models.

This includes assessing how rising temperatures may affect infrastructure costs, insurance markets, supply chains, and national budgets. Without strong mitigation and adaptation measures, these economic pressures are expected to grow.

A Shared Reality, Quantified

The Nature study offers a clear and data-based way to think about the economic harms of climate change. Emissions from the United States since 1990 have caused over $10 trillion in global economic damage. This includes harm in the U.S., India, and Brazil

These findings do not assign legal liability. However, they provide a meaningful picture of how climate change affects the global economy in terms of the social costs of carbon. They show that the costs of climate impacts are measurable and significant.

As the world continues to adapt and respond to climate change, understanding these economic links will be crucial for policymakers, businesses, and communities.
Verra to Launch Scope 3 Standard in 2026: A New Era for Value Chain Carbon Tracking

Verra is moving closer to launching its long-awaited Scope 3 Standard (S3S) Program, with version 1.0 phase 1 now scheduled for Q3 2026. This first release will allow companies to list project pipelines using an initial set of S3S-adapted methodologies. Although the timeline is slightly later than expected, the delay reflects a deeper push to build a stronger, more reliable system.

This move shows a clear focus on quality and long-term impact. Verra is not rushing the launch. Instead, it is taking time to improve the system. The team is refining technical frameworks, learning from pilot projects, and aligning with global standards. As a result, the final program will be stronger and easier to use. It is also likely to attract more companies and drive real climate action across supply chains.

Verra Aligns the Program With Global Climate Standards

Verra is working closely with companies, project developers, and climate experts. The goal is simple. Build a program that is practical, reliable, and easy to trust.

The extra time helps improve how the system connects with existing carbon markets. It also allows Verra to upgrade its digital tools and infrastructure. At the same time, lessons from pilot projects are shaping the final design. These pilots tested how existing Verified Carbon Standard (VCS) methods can work for Scope 3 projects in real conditions.

Training is another key focus. Verra is creating clear guidelines and support tools for project developers. This will help users understand the system quickly and scale their projects without delays.

Finally, the new timeline helps align the program with major global frameworks. These include updated climate standards and carbon accounting rules. This alignment will make the program more relevant and widely accepted.

How the Scope 3 Standard Will Transform Supply Chain Emissions

Scope 3 emissions are the biggest part of a company’s carbon footprint. In many sectors, they make up more than 75% of total emissions. These emissions do not come from a company’s own operations. Instead, they come from its supply chain—both before and after production.

Verra’s S3S Program aims to fix this problem in the following ways:

  • It brings a clear and trusted system to measure and manage these emissions.
  • Companies will be able to track real emission cuts and carbon removals in their value chains.

Explaining further, the program uses a strong measurement system. Companies will follow simple and consistent methods to calculate emissions. Then, independent auditors will check the data. This step builds trust and ensures the results are real.

New Carbon Units for Clear Tracking

Verra also introduces a new unit system. Project developers will receive Intervention Units (IUs). Companies will receive Scope 3 Intervention Units (S3IUs). These units will be recorded in a public registry. This makes tracking easy and avoids double-counting.

Co-Investment Drives Supply Chain Action

Another key feature is co-investment. Companies can invest in projects within their supply chains. In return, they can claim verified climate benefits. This system encourages suppliers, buyers, and investors to work together.

Understanding the Scale of Scope 3 Emissions

Unlike Scope 1 and 2, Scope 3 emissions cover the full value chain. They include both upstream and downstream activities.

Upstream emissions come from things a company buys. This includes raw materials, equipment, and transport. Downstream emissions happen after a product is sold. These include product use, delivery, and disposal.

The Greenhouse Gas Protocol lists more than 15 categories under Scope 3. These include goods, travel, waste, and investments. However, not every category applies to every business.

For example, a service company may have fewer downstream emissions. In contrast, a manufacturing company may see large emissions from product use and supply chains.

scope 3 emissions
Source: Greengage

Closing the Gap in Carbon Markets

Many companies want to cut Scope 3 emissions. But they face a big challenge. There are no simple and clear rules to follow. Because of this, companies often feel unsure. They do not know how to measure emissions or report results correctly. This slows down investment in supply chain projects.

As explained before, Verra’s S3S Program offers clear rules and a strong system, and also uses third-party checks and transparent tracking. As a result, companies can now invest in projects and trust the results. Finally, the outcome will be more money inflow into supply chain climate solutions.

The program also improves carbon markets. Until now, most systems have focused on standalone projects. But S3S connects emission cuts directly to company supply chains. This creates a more complete and practical approach.

Aligned With Global Climate Standards

Another strong point of the S3S Program is its global alignment. Verra designed it to match major climate frameworks.

  • It works alongside the Greenhouse Gas Protocol’s new standards. It also aligns with the updated net-zero rules from the Science Based Targets initiative (SBTi).
  • In addition, it connects with new frameworks from the AIM Platform and the Taskforce for Corporate Action Transparency (TCAT).
  • Most importantly, it aligns with Verra’s Verified Carbon Standard (VCS) version 5, released in December 2025.

This version improves the quality and trust in carbon credits. By linking with VCS 5, the S3S Program builds on a strong and proven system.

From Pilot Phase to Real-World Action

In 2025, Verra moved the program from planning to testing. It launched pilot projects and asked for public feedback.

These pilots were very useful. They showed what works and what needs improvement. They also helped adapt existing methods for real-world use. At the same time, it built the program’s structure. It set up rules, governance, and funding systems.

Verra is working with partners like the Value Change Initiative and SustainCERT. These groups help improve the program and keep it aligned with global best practices.

A Turning Point for Corporate Climate Action

Companies today face strong pressure to cut emissions. Scope 3 is the hardest part to manage, but also the most important.

Verra’s S3S Program offers a clear solution. It gives companies a simple and trusted way to act on supply chain emissions. By standardizing how emissions are measured and reported, the program makes climate action easier. It also opens new doors for investment and collaboration.

In the bigger picture, this program can support global climate goals. It helps reduce emissions at scale and strengthens trust in carbon markets.

With its 2026 launch coming soon, Verra’s Scope 3 Standard could become a key tool for companies worldwide—turning climate goals into real, measurable results.

Oil Shock Ignites Chinese EV Export Surge Around the World

Rising global oil prices are driving up demand for electric vehicles (EVs), with Chinese brands emerging as key beneficiaries. Recent spikes in crude prices are driven by heightened tensions in the Middle East and disruptions in the Strait of Hormuz, a critical oil shipping route.

These factors have pushed Brent crude above $100 per barrel and created instability in fuel markets. This has pushed many consumers to rethink fuel costs and consider EV alternatives. Higher fuel prices increase running costs for gasoline and diesel cars, making EV ownership more economical in many markets.

Chinese EVs Gain Speed Abroad

Dealers in countries like Australia and parts of Southeast Asia see growing interest in Chinese EVs. This rise comes as fuel prices increase.

Showrooms selling Chinese new energy vehicles (NEVs) are seeing more test drives, customer inquiries, and rising order volumes. In Australia, the EV market share hit a record high of 11.8% for vehicle sales. Analysts say this jump is partly due to rising petrol prices.

Chinese manufacturers like BYD, GWM, and Chery are rapidly growing abroad. Some dealers see more walk-ins and more customers buying EVs.

China’s EV industry is now the largest in the world. In 2024, Chinese automakers produced over 12.87 million plug‑in electric vehicles (PEVs), including battery electric (BEV) and plug‑in hybrid models, accounting for nearly 47.5% of total automobile production. That figure marked a strong year‑on‑year rise and underscored China’s industrial scale and export readiness.

global EV sales 2024 china lead
Source: IEA

By late 2025, more than 51% of all new vehicles sold in China were electric — a major shift from just a few years earlier.

This domestic scale provides an export advantage. Chinese EVs often cost less than similar European and North American models. This helps them succeed in markets where fuel costs hit household budgets hard.

Fuel Costs Drive Behavior Shift

Rising oil prices are a major driver of these sales trends. Global crude prices have fluctuated due to geopolitical tensions. The Strait of Hormuz route carries around 20% of the world’s oil trade. These disruptions pushed crude prices sharply higher in early 2026.

In many countries, higher retail fuel prices translate into more immediate cost pressures for consumers. Reports from countries like Australia show petrol prices over $2.50 per litre. This rise is making consumers think about EVs to lower long-term costs.

When oil prices rise, the cost gap between internal combustion engine (ICE) or gasoline cars and EVs becomes much larger. For example, at $100 per barrel oil, gasoline prices in many markets can reach about $1.20–$1.50 per liter (or $4.50–$5.50 per gallon).

ICE vs EV operating cost per km
Sources: Estimates from ICCT, IEA, U.S. DOE

At this level, a typical ICE vehicle may cost around $0.12–$0.18 per km in fuel, while an EV typically costs $0.03–$0.06 per km in electricity. This means EVs can be 2 to 4 times cheaper to run per kilometer.

Over a year, drivers can save roughly $600 to $1,500, depending on mileage and local energy prices.

Annual savings ev vs ice

Global EV Market Trends and Forecasts

The surge in Chinese EV exports aligns with broader global trends. Major industry forecasts suggest that global sales of battery electric and plug-in hybrid vehicles may top 22 million units by 2025. This could represent about 25% of all new car sales worldwide.

Global electric vehicle sales in 2025 reached nearly 21 million units, including both battery electric vehicles and plug‑in hybrid electric vehicles. This total represents a significant increase, roughly 20 % more than in 2024.

China’s share in this global growth is large. In 2024, Chinese manufacturers made up around 70% of all EV exports. This shows China’s key role in supply chains and manufacturing.

As oil demand growth slows due to EV uptake, some forecasts suggest that EVs could displace millions of barrels of global oil demand each day in the coming decade. By 2030, EV adoption could cut about 5 million barrels per day of oil use, according to major energy outlooks.

Trade Barriers vs Expansion

Despite strong export gains, barriers remain. Some regions have imposed tariffs and trade restrictions on Chinese EVs, and infrastructure gaps in charging networks can slow adoption. For example, tariffs exceeding 100% on certain Chinese EV imports in the U.S. have limited market share there.

However, Chinese OEMs are developing supplier and shipping capacity to support overseas demand. In 2025, China’s electric car makers expanded shipping through roll‑on/roll‑off carriers capable of transporting more than 30,000 vehicles, improving export logistics.

Emerging markets in Southeast Asia, Latin America, and Oceania are also showing rising EV interest. In the Philippines and Vietnam, dealerships see EV orders growing quickly. Some are even doubling their weekly sales, thanks to high fuel costs.

In India, where oil imports make up a big part of the economy, rising petrol costs make running traditional fuel vehicles more expensive. This has helped boost interest in electric vehicles, which are cheaper to operate when fuel is costly. Notably, the share of ICE retailers fell by over 25% in March.

share of gas cars in India fell bloomberg

Indian consumers and businesses view EVs as a way to shield against unstable oil prices. This also helps lower fuel costs, supporting the country’s move to electric transport.

What This Means for Energy and Transport Futures

The convergence of high oil prices and strong EV supply from China is creating a feedback loop. Higher fuel costs push consumers to consider EVs more seriously. Chinese manufacturers are well positioned to fill that demand with competitive pricing and large production scale.

The shift could speed up the move from fossil fuel cars to electric vehicles worldwide. This is especially true in price-sensitive and emerging markets. EV adoption also has implications for oil demand trends.

  • As battery and charging tech get better and EV markets grow, oil use — especially in transport — might slow down or peak sooner than we thought.

At the same time, governments and industry groups are tracking these shifts closely. Policies that support charging infrastructure, EV incentives, and emissions standards will influence how quickly the global fleet electrifies.

Ultimately, the current oil price shock may have sparked a shift in global automotive markets — one where Chinese EVs take an increasingly central role in transport electrification worldwide.

Texas Solar Market Heats Up with Meta and Google Investments

The U.S. is witnessing a surge in utility-scale solar development, driven by growing corporate demand for clean energy. Major tech companies like Meta and Google are securing long-term deals in Texas, combining renewable energy growth with economic and grid benefits.

This trend highlights how corporate commitments are shaping the future of the clean energy transition. Let’s find out.

Zelestra and Meta’s $600 Million Solar Deal

Madrid-based renewable energy firm Zelestra secured a massive $600 million green financing facility, signaling strong investor confidence in utility-scale solar. The funding, backed by Société Générale and HSBC, will support two large solar projects in Texas—Echols Grove (252 MW) and Cedar Range (187 MW).

These projects are not standalone efforts. Instead, they are part of a broader clean energy partnership with Meta, one of the world’s largest corporate renewable energy buyers. Together, they form a portion of a seven-project portfolio totaling 1.2 GW under long-term power purchase agreements (PPAs).

Sybil Milo Cioffi, Zelestra’s U.S. CFO, said:

“This financing marks a significant milestone in the delivery of our largest U.S. solar projects to date. It reflects strong confidence from Societe Generale and HSBC in our strategy and execution capabilities and reinforces our ability to attract first-class capital to support our growth platform in the U.S. market.”

Zelestra is strengthening its presence in the U.S. energy market with innovative solutions for hyperscalers and corporate clients. It is developing around 15 GW of renewable projects across key markets. In February 2026, BloombergNEF ranked Zelestra among the top 10 PPA sellers to U.S. corporations.

Solar Powering Meta’s Climate Strategy

Meta continues to aggressively expand its clean energy footprint. The company has made renewable energy procurement a core part of its climate roadmap—and the numbers clearly reflect that shift.

In 2024, Meta reported emissions of 8.2 million metric tonnes of CO₂e after accounting for clean energy contracts. In comparison, its location-based emissions stood at 15.6 million tonnes. This marked a sharp 48% reduction, largely driven by renewable energy purchases.

Moreover, the company has consistently maintained momentum:

  • Since 2020, it has matched 100% of its electricity consumption with renewable energy.
  • Over the past decade, it has secured more than 15 GW of clean energy globally.
  • Overall, renewable energy procurement has helped cut 23.8 million MT CO₂e emissions since 2021.

As a result, Meta cut operational emissions by around 6 million tonnes in 2024 alone. At the same time, it tackled value chain emissions using Energy Attribute Certificates (EACs), reducing Scope 3 emissions by another 1.4 million tonnes.

meta emissions

Most of these deals were concentrated in the U.S., highlighting the country’s growing importance in corporate decarbonization strategies.

Google Partners with Sunraycer for 400 MWac Texas Solar Project

Meanwhile, Google is also accelerating its clean energy investments. The company recently signed two long-term PPAs with Sunraycer Renewables for the Lupinus and Lupinus 2 solar projects in Texas.
These agreements will support the construction of a nearly 400 MWac solar facility in Franklin County. The project is expected to become operational by late 2027.

Importantly, this collaboration goes beyond just energy supply. It also aims to deliver broader economic benefits, including:

  • Local job creation during construction
  • Long-term tax revenue for the region
  • Continued investment in local infrastructure

David Lillefloren, CEO at Sunraycer, said:

“These agreements with Google represent a significant milestone for Sunraycer and underscore the strength of our development platform. We are proud to support Google’s clean energy objectives while delivering high-quality renewable infrastructure in Texas.”

Additionally, the deal was facilitated through LevelTen Energy’s LEAP process, which simplifies and speeds up PPA execution. This highlights how innovative platforms are now playing a key role in scaling renewable deployment.

“Google’s data centers are long-term investments in the communities we call home,” said Will Conkling, Director of Energy and Power, Google. “This collaboration with Sunraycer will fuel local economic growth while helping to build a more robust and affordable energy future for Texas.” 

Google’s Global Clean Energy Push

Google, like Meta, has built a strong clean energy portfolio over time. Since 2010, it has signed over 170 agreements totaling more than 22 GW of capacity worldwide. Its long-term ambition is even more ambitious—achieving 100% carbon-free energy, every hour of every day, by 2030.

These agreements cover more than 17.3 GW in North America, over 4.5 GW in Europe, around 400 MW in Latin America, and more than 300 MW across the Asia-Pacific region.

Significantly, between 2011 and 2024, its clean energy purchases have avoided over 44 million tCO₂e—equivalent to the total annual electricity emissions of all homes in New York State combined.

GOOGLE EMISSIONS
Source: Google

In the broader context, Google has committed over $3.7 billion to clean energy projects and partnerships, expected to generate around 6 GW of renewable electricity. For example, the company developed an investment framework supporting a 1.5 GW portfolio of new solar projects across the PJM grid.

By providing both investment capital and power purchase agreements, these projects gain a faster, more certain path to construction. In essence, the tech giant isn’t just a buyer of clean energy—it actively invests to create more, using its resources and engineering-driven approach to help these projects launch and scale.

Why Texas Is Becoming the Center of Energy Transformation

All these developments point to one clear trend—Texas is rapidly becoming a global hub for clean energy and data center growth.

On one hand, the state offers strong solar resources, vast land availability, and a deregulated power market. On the other hand, it is witnessing a surge in electricity demand, especially from data centers and AI-driven workloads.

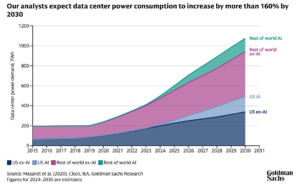
According to projections from the EIA, U.S. electricity demand could rise by 20% or more by 2030. Data centers are expected to play a major role in this growth. In fact, energy consumption from data centers increased by over 20% between 2020 and 2025.

data center

As a result, energy infrastructure in Texas is facing growing pressure. Rising industrial activity, extreme weather events, and rapid digital expansion are all contributing to grid stress. Yet, at the same time, this demand is driving unprecedented investment in renewable energy.

The EIA expects Texas to lead solar expansion in the coming years, accounting for nearly 40% of new solar capacity in the U.S. California will follow closely, and together, the two states will drive almost half of total additions.

TEXAS SOLAR

U.S. Solar Capacity for 2026: 86 GW on the Horizon 

Even though the sector has faced temporary slowdowns, the long-term outlook for U.S. solar remains highly positive.

In 2025, the U.S. added 53 GW of new electricity capacity—the highest annual addition since 2002. Notably, wind and utility-scale solar together generated 17% of the country’s electricity, a massive jump from less than 1% two decades ago.

EIA us

Looking ahead, growth is expected to accelerate again. Developers are planning to add around 86 GW of new capacity in 2026, which could set a new record. Solar alone is projected to account for more than half of this expansion.

Breaking it down further:

  • Solar is expected to contribute 51% of new capacity
  • Battery storage will make up 28%
  • Wind will account for 14%

Utility-scale solar capacity additions could reach 43.4 GW in 2026, marking a 60% increase compared to 2025 levels.

Analysis: Corporate Demand Is Reshaping Energy Markets

Overall, the developments from Zelestra, Meta, Google, and Sunraycer highlight a broader transformation underway in global energy markets.

First, corporate buyers are no longer passive participants. Instead, they are actively shaping energy infrastructure through long-term PPAs. These agreements provide stable revenue for developers while ensuring a clean power supply for companies.

corporate buyer

Second, financing is becoming more accessible. Large-scale funding deals, like Zelestra’s $600 million facility, show that banks are increasingly willing to back renewable projects with strong contractual support.

Third, regions like Texas are emerging as strategic energy hubs. The combination of rising electricity demand and favorable renewable conditions is attracting both developers and corporate buyers.

However, challenges remain. Grid reliability, permitting delays, and policy uncertainty could still impact the pace of deployment. Even so, the overall trajectory remains clear.

Clean energy demand is rising fast. Big Tech is leading the charge. And solar power is set to play a central role in meeting future electricity needs.

A Record 3.5M Methane Credits Trade at Xpansiv CBL Signals New Era for Gas Markets

A major transaction in the methane market is drawing attention across the energy sector. Xpansiv and MiQ announced the settlement of 3.5 million methane certificates on the Xpansiv CBL exchange. This is one of the largest trades of its kind to date.

The deal involved a European energy buyer and a large integrated energy producer. It covered 3.5 million MMBtu of U.S.-produced natural gas, with emissions verified under the MiQ standard.

The transaction shows that methane certification is moving from pilot programs to real market activity. It also highlights the growing demand for transparent emissions data in global gas supply chains.

What Are Methane Certificates: Tracking Invisible Emissions

Methane certificates track the emissions intensity of natural gas. They provide independently verified data on how much methane is released during production and transport.

Xpansiv CEO John Melby stated:

“We are excited to support the energy sector’s transition to certified natural gas by providing secure and scalable market infrastructure to transact and settle these innovative instruments. This transaction sets a new benchmark for the integration of verified environmental performance in the global energy markets, enhancing precision, rigor, and integrity in responsible natural gas sourcing.”

Methane is a powerful greenhouse gas. According to the International Energy Agency, methane has a much higher warming impact, 80x more than carbon dioxide over the short term. So, reducing methane leaks is one of the fastest ways to cut global warming.

methane emissions 2024 IEA data
Source: IEA

MiQ certificates assign grades based on emissions performance. These grades help buyers choose lower-emission gas. The system creates a financial incentive for producers to reduce methane leaks.

Certification also supports compliance. The European Union Methane Regulation requires companies to measure and report methane emissions using strict standards.

MiQ certification process
Source: MiQ

As rules tighten, verified data becomes more valuable. This is driving demand for certified gas and related environmental products.

From Pilot to Market Reality

This transaction is not just large. It also shows how methane markets are evolving.

  1. First, it demonstrates that market infrastructure is maturing. The trade was settled through Xpansiv’s CBL exchange, which allows secure and transparent transactions without complex bilateral agreements.
  2. Second, it reflects growing cross-border demand. European buyers are increasingly seeking certified gas to meet regulatory and corporate climate goals.
  3. Third, it sets a benchmark for scale. Earlier, methane certificate trading was limited. This deal shows that multi-million unit transactions are now possible.

Industry leaders see this as a step toward integrating emissions data into everyday energy trading. It brings methane performance closer to becoming a standard market factor, like price or volume.

Rising Demand from Data Centers and Energy Use

One key driver of methane certificate demand is rising energy consumption. The U.S. Energy Information Administration projects that U.S. natural gas use could increase by up to 7.3% between 2025 and 2027. It is also expected to hit a record-high 122.3 Bcf/d in 2027.

US natural gas production

A major reason is data center growth. Artificial intelligence and cloud computing require large amounts of electricity. Many data centers rely on natural gas for reliable power.

Tech companies are now looking at emissions across their energy supply chains. This includes methane emissions from gas production. Methane certificates offer a way to track and manage these emissions.

This trend links digital growth with environmental accountability. As data demand rises, so does the need for cleaner energy sourcing.

A Rapidly Expanding Market and Emerging Trends

Methane certification is part of a broader expansion in environmental markets. Platforms like Xpansiv support trading in:

These markets are growing quickly. On Xpansiv’s CBL exchange, trading volumes in environmental commodities have reached millions of tons annually, with strong growth in recent years.

MiQ has grown rapidly since its launch and is now a major player in methane certification. Today, MiQ certifies about 25% of U.S. natural gas production and more than 5% of global gas supply.

The MiQ registry now holds billions of issued certificates, creating a large pool of tradable emissions performance data. This scale shows that methane performance is moving beyond pilot stages and into mainstream markets.

Georges Tijbosch, CEO, MiQ, said:

“Our program gives buyers the trusted, independently verified emissions data they need to make smart choices—raising the bar for openness and accountability in the natural gas industry.”

Demand for methane certificates will grow as global regulations tighten. The IEA’s Global Methane Tracker 2025 shows that methane pledges cover about 80% of global fossil fuel production. However, only a small part has enforceable rules. This points to a rising need for verified emissions data.

oil and gas production covered by methane pledges
Source: IEA

In the EU, strict laws require ongoing monitoring, reporting, and quick leak repairs. Frameworks like OGMP 2.0 already cover around 42% of global oil and gas production. This pushes companies toward certification based on measurements.

Globally, methane causes about 30% of temperature rise since the Industrial Revolution, reinforcing regulatory urgency. As compliance moves from estimates to verified data, certified methane tracking systems are crucial for market access and trade.

At the same time, many firms are setting stricter climate targets that include methane performance. Investors are also pushing for better emissions data across energy supply chains.

Some industry forecasts suggest that markets for methane performance data and certificates could grow by more than 60% annually in the next several years. Together, these trends are likely to support continued growth in the methane certificate market.

Infrastructure is also improving. Exchanges like CBL help provide price signals and liquidity. Partnerships with firms like S&P Global aim to improve market transparency and data quality.

What This Means for the Energy Transition

The 3.5 million certificate trade highlights a broader shift in energy markets. Emissions data is becoming part of how energy is bought and sold.

Natural gas remains a key fuel in the global energy mix. But buyers are increasingly focused on how it is produced. Lower-emission gas may gain a competitive advantage.

Methane certification offers a practical tool. It allows companies to:

  • Track emissions,
  • Improve performance,
  • Meet regulatory requirements, and
  • Support climate targets.

This aligns with wider efforts to reduce greenhouse gas emissions while maintaining energy supply. In the coming years, methane certification could become a standard part of natural gas trading. It may also link more closely with carbon markets and broader climate finance systems.

With this development, the direction is clear. Environmental performance is becoming a measurable and tradable part of energy markets. Deals like this signal that the shift is already underway.

Trump Admin Pays TotalEnegries $1B to Scrap Wind Projects, Putting a Hold on America’s Clean Energy Plans

The U.S. government has agreed to pay nearly $1 billion to the French energy company TotalEnergies to cancel major offshore wind projects planned on the East Coast. The deal was announced by the Department of the Interior and represents a major shift in federal energy policy.

TotalEnergies will give up its lease holdings and invest in fossil fuel development instead. Meanwhile, the U.S. will reimburse the company for lease fees it has already paid.

This move comes as offshore wind was expected to become a key part of America’s renewable energy future. Now, it raises new questions about the future of offshore wind, the role of the federal government, and broader energy and climate strategies.

The Deal: What Happened and What It Means

Officials from the Department of the Interior and TotalEnergies announced that the company will abandon two planned offshore wind projects. These leases were located off the coasts of New York and North Carolina.

TotalEnergies will get back up to $928 million. This amount covers the money it spent on lease rights.

In return, the energy giant plans to redirect that capital toward fossil fuel development. This includes investing in liquefied natural gas (LNG) infrastructure in Texas. It also covers expanded oil and gas activities in the Gulf of Mexico and U.S. shale regions.

TotalEnergies Chair and CEO Patrick Pouyanné said:

“TotalEnergies is pleased to sign these settlement agreements with the DOI and to support the Administration’s Energy Policy. Considering that the development of offshore wind projects is not in the country’s interest, we have decided to renounce offshore wind development in the United States, in exchange for the reimbursement of the lease fees.”

The government framed the deal as a way to reduce federal exposure to expensive and “unreliable” offshore wind projects. The Interior Department described the agreement as an efficient way to shift resources toward energy sources they view as more cost‑effective.

US Interior Secretary Doug Burgum noted:

“We welcome TotalEnergies’ commitment to developing projects that produce dependable, affordable power to lower Americans’ monthly bills while providing secure US baseload power today—and in the future.”

On Hold: Offshore Wind’s Place in U.S. Energy Plans

Offshore wind power has been part of U.S. climate and energy planning for years. The National Renewable Energy Laboratory (NREL) has estimated that the United States has a technical potential of:

  • 1,476 GW of fixed‑bottom offshore wind resources
  • 2,773 GW of floating offshore wind resources

These resources could be developed off the coasts of the Atlantic, Pacific, and Gulf of Mexico.

Despite this potential, the industry is still in its early stages. As of early 2025, the U.S. had just 174 megawatts (MW) of installed offshore wind capacity. 

America offshore wind energy potential NREL
Source: NREL

Several major projects were in development and construction before the recent policy shift. These included:

  • Vineyard Wind 1, near Massachusetts
  • Empire Wind 1, near New York
  • Coastal Virginia Offshore Wind (CVOW)
  • Revolution Wind
  • Sunrise Wind

These projects were expected to add several gigawatts of clean energy to U.S. grids in the coming years. The federal government considered this one way to help meet broader climate goals. This was part of U.S. commitments under the Inflation Reduction Act and other climate legislation.

Now, the cancellation of TotalEnergies’ projects marks a notable change in that trajectory.

Costs, Risks, and Market Headwinds

Offshore wind is capital‑intensive and technically complex. The industry has faced cost pressures in recent years. Offshore wind development in the U.S. has high costs. Often, these expenses are several times greater than those for onshore wind installations.

US wind energy cost
Source: NREL study; 10.2172/2433785

In a 2025 study, fixed-bottom projects cost about $72 to $140 per MWh, while floating wind often exceeds $150 per MWh. Capital costs range from $3,000 to $6,000 per kW, with early floating projects higher. Over time, costs may fall to $50 to $100 per MWh by 2050.

In addition to costs, developers have faced supply chain issues, regulatory delays, and scaling challenges. These factors have slowed project timelines and increased financial risk.

However, offshore wind has continued to be a key part of long‑term clean energy forecasts. A 2023 U.S. Department of Energy outlook estimates up to 30 GW of offshore wind capacity by 2030. By 2050, this could reach 110 GW if policies support growth.

Offshore Wind Energy Strategic Initiatives
Source: U.S. DOE

These capacity levels would help support decarbonization efforts in the power sector and contribute to electricity market diversification. Offshore wind resources are generally strongest and most consistent offshore, offering high capacity factors compared to some onshore renewables. But now that wind projects are cancelled, these clean energy goals are under strain. 

Is This a Fossil Fuel Pivot?

Offshore wind is just one piece of a larger clean energy landscape. The U.S. has significantly expanded onshore wind and solar capacity in recent years, driven by federal tax incentives in the Inflation Reduction Act.

Offshore wind infrastructure includes large turbine components, subsea cabling, and port facilities. These elements have economic multipliers that can support regional supply chains and workforce development.

At the same time, fossil fuels remain a significant part of the U.S. energy mix. The Trump administration’s deal with TotalEnergies reflects federal policy that prioritizes traditional energy sources, such as natural gas and oil, alongside efforts to support domestic energy security.

US largest oil producers 2024

U.S. fossil fuel production remains high. In 2025, the U.S. was the world’s largest producer of crude oil and natural gas liquids combined. The country’s energy exports, including LNG, also rose sharply in recent years as global markets shifted.

Natural gas accounts for a large share of U.S. electricity generation, usually around 40% of net generation, providing a flexible baseload power source for grids.

US electricity generation share gas 2026

Global Offshore Wind Snapshot

Offshore wind development continues globally, particularly in Europe and Asia. Countries such as the United Kingdom, Germany, China, and Taiwan have deployed substantial offshore wind capacity.

Europe, for example, exceeded 30 GW of installed offshore wind capacity by the end of 2025, with continual growth projected. The global pipeline includes tens of gigawatts under development, driven by policy support and falling technology costs.

Cost reductions in turbine technology, floating wind platforms, and installation methods are expected to continue. Global forecasts project offshore wind capacity reaching 234 GW by 2030 and 2,000 GW by 2050 under the 1.5°C scenario.

global offshore wind energy forecast 2030
Source: REGlobal

These figures indicate that offshore wind could play a major role in the energy transition worldwide — even as policies vary by region.

America’s Clean Energy Goals in Flux

The TotalEnergies deal marks a clear shift in federal energy policy. It reflects a calculated decision by the current administration to redirect capital and incentives away from offshore wind.

This decision could affect investor confidence, supply chains, and future project pipelines. Offshore wind developers have warned that a lack of federal support and policy uncertainty may hinder industry growth.

Elizabeth Klein, former director of the Department of the Interior’s Bureau of Ocean Energy Management under the Biden administration, remarked in a CNN interview that the move:

“…will actually cause a further energy deficit in our country and increase the cost of energy certainly along the East Coast… For the current administration to be cutting that off makes no sense at all.”

For states with clean energy goals, reliance on offshore wind as part of a diversified renewable portfolio may now require adjustments.

The broader climate context remains focused on reducing emissions from the power sector. Renewable energy deployment, grid modernization, and clean energy innovation continue to be key strategies for long-term decarbonization.

As the energy landscape evolves, market participants and policymakers are watching closely. What unfolds next will shape not only the offshore wind sector but the broader clean energy transition in the United States.

From Air to Ale: Introducing the First-of-its-Kind Beer Made with Captured Carbon

A new beer is turning carbon removal into a real-world product. U.S.-based Aircapture and Almanac Beer have launched what they call the world’s first commercial beer carbonated using (carbon dioxide) CO₂ captured directly from the atmosphere.

The system uses direct air capture (DAC) technology. It pulls carbon dioxide from ambient air and delivers it on-site for use in brewing. The captured CO₂ replaces conventional industrial CO₂, which is usually sourced from fossil fuel processes.

The DAC unit is installed at Almanac’s brewery in California. It captures CO₂ from the air and feeds it directly into the beer carbonation process. This removes the need to transport CO₂ from external suppliers and reduces the carbon footprint of production.

While the volume of CO₂ used in beer is small, the concept is significant. It shows how captured carbon can move beyond storage and into everyday consumer products.

How Direct Air Capture Works in Practice

Direct air capture is a technology that removes CO₂ directly from the atmosphere. Unlike traditional carbon capture, which targets emissions at industrial sources, DAC works anywhere.

The process uses chemical materials to bind CO₂ from the air. The captured gas is then purified and either stored or reused. In this case, it is reused in beverage production.

Globally, DAC is still at an early stage. According to the International Energy Agency, only 27 DAC plants are operating worldwide, capturing about 0.01 million tonnes of CO₂ per year.

CO2 capture by direct air capture, planned projects and in the Net Zero Emissions by 2050 Scenario, 2020-2030
Source: IEA

However, the pipeline is growing. More than 130 DAC facilities are in development, including large-scale plants that could capture over 1,000 tonnes of CO₂ per year each.

Aircapture’s model is different from many large DAC projects. Instead of building centralized plants, it installs modular units directly at industrial sites. This allows companies to use captured CO₂ on-site, reducing transport costs and emissions.

This approach fits well with industries like food and beverage, where CO₂ is already used as an input.

Why CO₂ Matters in Beer Production

Carbon dioxide plays a key role in brewing. It creates the bubbles in beer and affects taste, texture, and shelf life. Most breweries rely on industrial CO₂ supplies, often sourced from fossil fuel processes or as a byproduct of fertilizer production.

This supply chain has faced disruptions in recent years. CO₂ shortages have affected breweries across the U.S. and Europe, highlighting the risks of relying on centralized supply.

Using DAC changes this model. Breweries can produce CO₂ on-site, reducing supply risks and emissions. It also provides a way to use carbon that would otherwise remain in the atmosphere.

Damian Fagan, CEO of Almanac Beer Co., stated:

“Brewing is both science and craft. By integrating direct air capture into our production floor, we’re rethinking one of our essential ingredients and contributing to carbon-removal efforts. Instead of relying on distant industrial supply, we’re sourcing CO₂ from the air right here in Alameda. It’s local, circular, and a glimpse of what the future will look like.”

This does not make beer carbon-negative on its own. But it reduces reliance on fossil-derived CO₂ and shows how carbon can be reused in circular systems.

Almanac’s DAC unit captures 50-100 tCO₂/year, small volume, massive market signal. On-site generation cuts fossil CO₂ emissions from trucking by 20-30% in the supply chain. It also creates premium utilization credits for beverage Scope 3 or supply chain emissions.


DAC Market Set for Explosive Growth

The launch comes as interest in carbon removal technologies is rising. Governments and companies are investing in solutions that remove CO₂ from the atmosphere, not just reduce emissions.

The DAC market is still small but growing fast. One estimate values the market at about $160 million in 2025, with projections reaching nearly $18.7 billion by 2035, growing at a 61% annual rate.

direct air capture dac market size
Source: Precedence Research

Other forecasts show similar trends. The market could reach over $9 billion by 2033, driven by corporate climate targets and government incentives.

This growth is supported by key factors, including:

North America currently leads the DAC market, accounting for a large share of global deployment. However, scaling remains a challenge. DAC systems require energy and infrastructure, and costs are still high compared to other climate solutions.

DAC Projects in US, prosed DAC hubs
Source: Reuters

From Storage to Utilization: A New Carbon Economy

Most DAC projects focus on storing CO₂ underground. This is known as carbon dioxide removal (CDR). It is essential for reaching global climate targets, especially for hard-to-abate sectors.

But there is growing interest in carbon utilization. This means using captured CO₂ as a resource rather than storing it. Common applications include:

  • Synthetic fuels
  • Building materials
  • Chemicals
  • Food and beverages

The beer project shows a simple but visible example of this shift. It turns captured carbon into a product that consumers can see and use.

While the scale is small, it helps build awareness and demand for carbon removal technologies. It also shows that DAC can integrate into existing industries without major changes to production systems.

Corporate Climate Strategies Drive Innovation

Projects like this are also linked to corporate climate goals. Many companies are looking for ways to reduce emissions across their operations and supply chains. Carbon removal is becoming part of these strategies.

Using captured CO₂ in products supports these goals. It reduces reliance on fossil inputs and creates new pathways for decarbonization.

More notably, in sectors like food and beverage, where emissions are harder to eliminate completely, these solutions can play a supporting role.

Carbon Markets Expand Beyond Offsets

The launch of a DAC-based beer highlights a broader shift in carbon markets. The focus is expanding from reducing emissions to actively removing and reusing carbon.

Carbon markets are expected to grow as demand for high-quality carbon credits increases. Many experts see carbon removal as essential for meeting global climate targets.

At the same time, new use cases for CO₂ could create additional value streams. Instead of treating carbon only as a cost, companies can use it as an input for products.

However, scale remains the key challenge. Current DAC capacity is far below what is needed. The IEA notes that global DAC deployment must reach around 65 million tonnes of CO₂ per year by 2030 to align with net-zero pathways. This will require major investment, policy support, and technological progress.

A Small Beer with a Big Climate Message

The beer itself is a niche product, but the idea behind it is larger. It shows how carbon removal can move into everyday life and consumer markets.

By turning captured CO₂ into a usable product, companies can demonstrate the value of climate technologies in simple terms. This can help build public support and encourage further investment.

The project also highlights a key trend. Climate solutions are becoming more integrated into business operations, not just separate offset programs.

For now, a single beer will not change global emissions. But it offers a glimpse of how carbon could be managed differently in the future, not just emitted or stored, but reused in practical ways.

IEA Sounds Alarm as War Disrupts Energy Markets, Boosting Australia’s Uranium Demand

The global energy system is under pressure again. This time, the shock is not just about oil and gas. It is also about minerals that power clean energy and nuclear technologies. Media reports revealed that, according to International Energy Agency chief Fatih Birol, the current crisis could soon look small compared to what lies ahead in critical minerals.

Speaking at a major industry event in Canberra, Birol warned that supply risks in minerals like uranium, copper, and battery metals could reshape global energy security. His message was clear: countries must diversify supply chains now or face deeper disruptions later.

A New Energy Shock Unfolds 

The world is already dealing with a massive energy disruption. The ongoing conflict involving the United States, Israel, and Iran has removed the equivalent of around 10 million barrels of oil per day from global markets, according to the IEA. This supply gap has pushed countries to rethink energy security. Oil prices remain volatile, and supply routes are under strain. However, Birol stressed that the bigger challenge may not be oil at all.

Instead, the future risk lies in critical minerals. These materials are essential for clean energy systems, electric vehicles (EVs), and nuclear power. Without stable access to them, the global energy transition could slow down sharply.

The problem is concentration. Today, one country dominates the refining and processing of many key minerals. China controls more than 80% of global refining capacity for several critical materials, according to IEA estimates. This creates a major bottleneck in supply chains.

To sum up, without urgent diversification, countries could face even greater risks than today’s energy shock.

IEA Highlights Australia as a Reliable Supplier of Uranium and Critical Minerals

Amid these concerns, Australia is emerging as a key player. The country holds vast reserves of critical minerals and energy resources. This includes uranium, lithium, copper, and natural gas.

Australia has the world’s largest uranium reserves. It accounts for roughly one-third of the known global resources, according to data from the Minerals Council of Australia. At the same time, it ranks among the top global uranium producers, alongside Kazakhstan, Canada, and Namibia.

australia uranium
Source: World Population Review

This puts the nation in a strong position as nuclear energy gains traction again worldwide. IEA highlighted that Australia is a reliable supplier that does not use energy exports as a geopolitical tool. This reliability is becoming more valuable as global tensions rise.

At the same time, Australia is also rich in battery minerals. It is the world’s largest producer of lithium and a major supplier of nickel and cobalt. These materials are critical for EV batteries and renewable energy storage.

SMRs Open Lucrative Uranium Export Path for Australia

One of the biggest shifts expected from this crisis is the revival of nuclear energy. Governments are now looking for stable, low-carbon energy sources that can reduce reliance on volatile fossil fuel markets.

A key driver of this nuclear growth will be Small Modular Reactors (SMRs). They are smaller, faster to build, and more flexible than traditional nuclear plants. Countries like the United States, the United Kingdom, France, and South Korea are leading their development.

The IEA expects global nuclear capacity to grow strongly through 2035. In its latest outlook, nuclear generation could rise by nearly 50% by 2040 under net-zero scenarios. This shift will significantly increase demand for uranium. According to the World Nuclear Association, uranium demand could double by 2040 if new reactors and SMRs scale up as expected.

For Australia, this presents a major export opportunity. Even though the country does not use nuclear power domestically, it plays a crucial role in supplying fuel to the global market.

One of the biggest shifts expected from this crisis is the revival of nuclear energy. Governments are now looking for stable, low-carbon energy sources that can reduce reliance on volatile fossil fuel markets.

As per WNA, in 2022, Australia produced 4087 tU of uranium, 8% of global production. Uranium comprises about 17% of the country’s energy exports in thermal terms.

Contracted Imports of Australian Uranium Oxide Concentrate – U3O8

australia uranium
Source: WNA

LNG Demand Set to Rise

The current crisis is also boosting demand for liquefied natural gas (LNG). Damage to energy infrastructure in the Middle East has disrupted supply flows, forcing countries to seek alternatives.

Australia is already one of the world’s largest LNG exporters. Projects in Western Australia and Queensland supply key markets across Asia, including Japan, South Korea, and China.

Birol said demand for Australian LNG is expected to grow further as countries look for stable suppliers. This could strengthen Australia’s role in global gas markets in the short to medium term. Similarly, Wood Mac had also projected earlier that the nation’s exports would remain steady throughout this year,

australia LNG
Source: Wood Mackenzie

According to the International Energy Agency, global LNG demand is projected to rise by around 3–4% annually through 2030, driven by Asia’s energy needs and coal-to-gas switching.

EV Growth Drives Copper and Battery Metals

Beyond nuclear and gas, electrification is another major trend shaping demand. The global shift to EVs and renewable energy systems is accelerating the need for metals like copper, lithium, and nickel.

Copper is especially important. It is used in power grids, EV motors, and renewable energy systems. Birol emphasized that expanding electricity grids worldwide will require massive amounts of copper.

The IEA estimates that clean energy technologies could double global copper demand by 2040. Similarly, lithium demand could grow more than 40 times under aggressive climate scenarios.

As said before, Australia is well-positioned here too. It leads global lithium production and has large untapped reserves of other key minerals. This gives it a strategic advantage as countries race to secure supply chains.

Investment Trends Show Growing Interest

Recent data shows rising investment in Australia’s resource sector. Uranium exploration spending has picked up after years of decline. According to the Australian Bureau of Statistics, uranium exploration spending reached about $55 million in 2023. This marked the highest level in over a decade.

This increase reflects renewed interest in nuclear energy and long-term expectations of higher uranium demand. At the same time, mining companies are investing more in critical minerals projects. Governments are also stepping in with policies to support domestic processing and reduce reliance on foreign supply chains.

australia battery markets

Minerals, Not Oil, Are the New Battleground for Energy Security

While the current energy crisis is serious, Birol’s warning points to a deeper challenge. The world is entering a new phase where minerals, not just fuels, will define energy security. If supply chains remain concentrated, disruptions could become more frequent and more severe. This could slow down clean energy deployment and push up costs.

Diversification is key. Countries need to invest in new mining projects, expand refining capacity, and build resilient supply networks. And Australia is likely to play a central role in this shift. Its vast resources, stable political environment, and strong export infrastructure make it a critical partner for many nations.

The global energy landscape is changing fast. Oil shocks are no longer the only concern. Critical minerals are becoming the new backbone of energy systems. As nuclear power returns, EV adoption rises, and clean energy expands, demand for these materials will surge. This creates both risks and opportunities.

The challenge now is to scale supply, diversify processing, and ensure these materials remain accessible. If not, today’s energy crisis could soon be overshadowed by a much larger minerals crunch.

Microsoft Inks Biggest-Ever U.S. Biochar Deal with Liferaft

Updated: corrected biochar chart citation.

A new agreement between Microsoft and Liferaft highlights the rapid growth of carbon removal markets. The deal covers 1 million carbon removal units or credits over 10 years, making it one of the latest long-term offtake agreements in the sector.

These agreements are important. They give developers guaranteed future demand while helping them raise capital, build projects, and scale operations. For buyers like Microsoft, they secure access to high-quality carbon removal credits in a tight market.

Phillip Goodman, Director, Carbon Removal at Microsoft, commented:

“At Microsoft, we’re pleased about the Liferaft project’s potential to pair high-quality, durable carbon removal with meaningful local benefits. Liferaft has strong plans for putting locally available biomass waste to productive use, generating local jobs, and supporting farmers and land managers. This demonstrates how carbon removal can strengthen agricultural communities, improve land outcomes, and deliver durable climate impact.”

The deal also reflects a broader shift. Companies are moving from short-term carbon offsets to long-term carbon removal contracts. These focus on physically removing carbon dioxide from the atmosphere and storing it for long periods.

Microsoft Expands Its Carbon Removal Playbook

Microsoft is the largest corporate buyer of carbon removal credits today. The company has rapidly scaled its purchases in recent years.

Microsoft carbon removals by the numbers 2025
Source: Microsoft

In 2025 alone, Microsoft signed agreements covering about 45 million tonnes of carbon removal. This was more than double its 2024 volume and a major jump from about 5 million tonnes in 2023.

  • The company also dominates the broader market. In 2024, Microsoft accounted for about 63% of all durable carbon removal purchases, securing over 5.1 million tonnes.

Recent deals show how fast this is growing:

  • 2.85 million tonnes of soil carbon removal credits with Indigo Ag over 12 years
  • 2 million tonnes from afforestation projects in Africa
  • 1.24 million biochar credits in one of the largest deals of its kind
  • 3.6 million tonnes from a bioenergy carbon capture project in the U.S.

These numbers show a clear trend. Microsoft is using long-term contracts to build supply across multiple carbon removal pathways.

The company’s goal is ambitious. It aims to become carbon-negative by 2030 and to remove all its historical emissions by 2050. Carbon removal plays a key role in achieving this target.

Microsoft emissions
Source: Microsoft

Why Biochar Is Dominating Early Carbon Markets

Liferaft is a U.S.-based carbon removal developer focused on biochar-based solutions. The company converts agricultural and forestry residues into stable biochar, which locks carbon in soil for hundreds of years.

Liferaft then sells these durable carbon removal credits to corporate buyers. Its approach combines carbon storage with soil health benefits, improving nutrient retention and reducing methane and nitrous oxide emissions from land.

The Microsoft offtake deal marks one of its largest long-term agreements, helping Liferaft scale operations and expand biochar deployment. It is important because it highlights the growing role of biochar carbon removal.

Biochar is produced by heating organic materials like agricultural waste in low-oxygen conditions. This process locks carbon into a stable solid form that can be stored in soil for hundreds to thousands of years.

It is considered one of the most practical carbon removal methods available today. Moreover, it is relatively low-cost compared to technologies like direct air capture. It can also scale faster because it uses existing biomass waste.

Biochar already plays a major role in the market. In 2024–2025, it accounted for about 86% of global carbon removal purchases and deliveries.

biochar purchased and delivered 2024
Source: Supercritical

Demand is strong, but supply is limited. In 2024, biochar made up a large share of purchases, but actual issued credits remained below demand levels.

The long-term potential is also huge. Estimates suggest biochar could remove between 0.3 and 4.9 billion tonnes of CO₂ per year globally, with some studies pointing to around 3 billion tonnes annually using available biomass waste.

This makes biochar one of the most scalable carbon removal options available today.

How Offtake Deals Help Scale Carbon Removal

The Liferaft–Microsoft agreement follows a model that is becoming standard in carbon removal markets: long-term offtake contracts.

These deals serve several purposes:

  • They provide price certainty for developers.
  • They reduce investment risk for new projects.
  • They help scale technologies that are still early-stage.

Microsoft has emphasized that early demand is critical. By committing to future purchases, companies help suppliers secure financing and expand capacity. This model is similar to how renewable energy markets grew. Long-term power purchase agreements helped scale solar and wind by guaranteeing revenue.

Now, the same model is being applied to carbon removal.

From Offsets to Permanent Carbon Removal

The carbon removal market is still small but growing fast. Demand is driven by corporate climate targets and stricter net-zero standards. Global purchases of carbon removal credits reached about 8 million tonnes in 2024, up nearly 78% from 2023.

By 2025, demand had already surged further, with tens of millions of tonnes under contract. Looking ahead, forecasts show strong growth:

  • The market could reach $40 billion to $80 billion per year by 2030.
  • By 2050, it could expand from $300 billion to $1.2 trillion annually.

microsoft biochar million ton deal liferaft

However, supply remains a key constraint. Less than 1 million tonnes of durable carbon removal credits have been issued globally, far below demand.

This gap is pushing companies to secure long-term contracts early. It also supports higher prices for high-quality credits, especially those with long-term storage like biochar.

Carbon Removal Becomes Essential for Net Zero

Carbon removal is now seen as essential for climate goals. Reducing emissions alone is not enough. Some emissions are hard to eliminate, especially in sectors like agriculture, aviation, and heavy industry.

Carbon removal helps address these residual emissions. It removes CO₂ directly from the atmosphere and stores it in a durable way.

Experts note that carbon removal is what makes “net-zero” possible. Without it, many climate targets would be difficult to achieve at scale. This is why companies like Microsoft are investing heavily in the sector. They are building portfolios that include:

  • Nature-based solutions like forests and soil,
  • Engineered solutions like DAC and BECCS, and
  • Hybrid approaches like biochar.

This diversified strategy reduces risk and supports multiple technologies at once.

A New Phase for Carbon Markets Emerges

The Liferaft agreement may seem small compared to Microsoft’s larger deals. But it reflects an important shift in the market.

First, it shows that demand is spreading across more suppliers. This helps build a broader and more competitive market.

Second, it highlights the growing role of biochar. As one of the most mature carbon removal methods, it is likely to remain a key part of early market growth.

Third, it reinforces the importance of long-term contracts. These agreements are becoming the main way to scale carbon removal globally.

With all these, the broader trend is clear. Carbon removal is moving from pilot projects to large-scale deployment. Companies are no longer testing the market. They are actively building it.

For now, Microsoft remains the dominant buyer. But its strategy is also creating space for others to follow. By securing supply early, the tech giant is helping to unlock a new phase of growth in climate technology.

Nickel Demand for EVs Could Flip the 2030 Market Balance

Disseminated on behalf of Alaska Energy Metals Corporation.

On the surface, the global nickel market looks comfortable. Supply appears ample. Prices remain under pressure. Inventories continue to climb. However, this apparent balance hides a deeper problem. The world’s nickel supply has become heavily concentrated in one country, creating long-term risks that today’s surplus does not fully reflect.

The S&P Global Nickel CBS January 2026 report makes this point clear. While Indonesia continues to push large volumes of nickel into the market, warning signs are emerging. Policy uncertainty, slowing demand, and swelling inventories now shape the near-term outlook. At the same time, today’s oversupply is quietly setting the stage for future instability.

The Nickel Market is in Surplus, But Not in Balance

At first glance, the nickel market seems well supplied. S&P Global projects a 156,000-tonne surplus in 2026, even after Indonesia announced sharp cuts to its nickel ore quotas. This surplus explains why prices struggle to move higher, despite occasional rallies.

However, the quota cuts have not reduced output as much as expected. Indonesian smelters continue to run at high utilization rates. They rely on existing ore stockpiles and imports from the Philippines to keep production steady. As a result, global supply still runs ahead of demand.

This imbalance shows up clearly in inventories. LME nickel stocks climbed to 275,634 tonnes in January 2026, marking the largest inflows since 2019. Rising inventories signal that excess nickel has nowhere to go. Even Class 1 nickel remains widely available, keeping prices capped.

Weak Nickel Demand Keeps the Surplus Alive

Strong supply alone does not explain the surplus. Weak demand plays an equally important role.

S&P Global further analysed that in late 2025, manufacturing activity slowed across key regions. U.S. and Eurozone PMIs fell into contraction, weighed down by trade tariffs introduced under President Trump. These tariffs raised costs and disrupted supply chains, hurting industrial activity. At the same time, consumer confidence weakened, reducing demand for stainless steel and other nickel-intensive products.

China offered some support, but not enough to change the overall picture. Its PMI showed mild expansion, backed by measures in the 2026–2030 Five-Year Plan aimed at stabilizing the property sector. Even so, stainless steel production remains oversupplied, and EV battery makers continue to adjust designs to use less nickel.

As a result, near-term nickel demand growth stays muted. Despite this, speculative investors remain optimistic. Net long positions have stayed elevated for seven months, reflecting bets that supply disruptions will eventually outweigh weak fundamentals.

Is Oversupply More Than a Price Problem?

Oversupply does more than suppress prices. It distorts market balance.

When supply consistently exceeds demand, prices lose their ability to send clear signals. Even meaningful policy actions, such as Indonesia’s quota cuts, fail to trigger lasting price increases. The market simply absorbs the news and moves on.

At the same time, oversupply discourages investment outside low-cost regions. Higher-cost producers struggle to survive. In Australia, several operations have already cut output due to poor margins. These curtailments reduce supply diversity without tightening the market.

As a result, the world becomes more dependent on Indonesian nickel. While this keeps prices low today, it increases vulnerability tomorrow.

Nickel supply nickel price
Data source: S&P Global

2030s Set to Flip the Nickel Market Balance

According to S&P Global, today’s surplus will not last forever.

The report projects that global nickel stocks will peak around 2028. After that, inventories begin to fall as demand improves and supply growth slows. By the early 2030s, the market balance flips.

By 2031, S&P Global expects the primary nickel balance to turn negative. EV battery demand accelerates as electrification expands. Stainless steel consumption recovers alongside global manufacturing. Meanwhile, Indonesian supply growth slows as easy expansions run out and regulatory risks increase.

Once inventories drop below comfortable weeks-of-consumption levels, prices respond quickly. S&P Global points to nickel prices rising toward $25,000 per tonne or higher, especially for Class 1 material.

Non-Indonesian Projects Hold the Key to Future Balance

As we understand now, oversupply is reshaping how the market thinks about security. During surplus periods, buyers focus on price. Origin matters less. Reliability takes a back seat. However, as balance tightens, priorities shift. A stable, politically secure supply becomes critical.

This is when non-Indonesian projects regain importance. Oversupply may delay their development, but it also ensures that fewer alternatives exist when demand rebounds. As a result, high-quality projects outside Indonesia gain strategic value.

Nickel demand supply
Source: IEA

Nickel prices remained flat today (May 25, 2026), with global benchmarks holding at $18,859.97 per ton and Chinese markets at ¥127,951 per ton. This 0.00% change reflects a market tug-of-war. While tight Indonesian mining quotas and dropping LME inventories provide a strong price floor, an elevated global visible surplus and weak Chinese stainless steel demand cap upward momentum. These structural supply constraints are perfectly balanced by sluggish consumption, resulting in stagnant sideways trading.

AEMC’s Nikolai Project Stands Apart

This shifting market context brings Alaska Energy Metals Corp. (AEMC) into focus.

AEMC’s Eureka deposit, part of the Nikolai Nickel Project in Alaska, is now the largest known nickel resource in the United States. Importantly, the project is polymetallic. Alongside nickel, it hosts copper, cobalt, chromium, platinum, and palladium—materials critical to clean energy, infrastructure, and defense.

In March 2025, AEMC released an updated NI 43-101 compliant mineral resource estimate, prepared by Stantec Consulting Services. The update significantly expanded the project’s scale.

The estimate includes:

  • 1.19 billion tonnes of Indicated resources, up 46%
  • 2.09 billion tonnes of Inferred resources, up 133%
  • 61 billion pounds of contained nickel in the Indicated category
  • 9.38 billion pounds of nickel in the Inferred category

On a nickel-equivalent basis, the resource exceeds 29 billion pounds, placing it among the world’s largest undeveloped nickel assets.

Long-Life Supply with Strong Economics

Beyond size, the project’s quality strengthens its case.

The Eureka deposit features a low strip ratio of about 1.6:1, which supports lower operating costs. A higher-grade core sits near the surface, reducing early capital requirements. Mineralization remains consistent and continuous, extending in multiple directions with room for expansion.

Early metallurgical work suggests the ore should respond well to conventional processing, avoiding complex or risky technologies. Together, these factors support a long-life, stable supply source—something the U.S. currently lacks.

aemc nikolai nickel
Source: AEMC

Why AEMC Fits the U.S. Strategy

The United States faces a widening gap between critical mineral demand and domestic supply. Nickel ranks near the top of that list, driven by EVs, grid infrastructure, and defense needs.

AEMC aligns closely with this strategy. The company is advancing permitting under the FAST-41 framework, plans to deliver a Preliminary Economic Assessment in Q1 2026, and continues hydrometallurgical testing to support future U.S.-based refining.

In a market dominated by Indonesian supply, AEMC offers diversification, security, and scale.

Today’s nickel surplus keeps prices low and inventories high. However, it also hides growing structural risks.

As oversupply fades and demand accelerates, the market will need new, reliable sources of nickel. Projects like AEMC’s Nikolai are not competing with today’s surplus—they are preparing for tomorrow’s shortage.

And when balance finally tightens, supply security may matter just as much as price.


Live Nickel Spot Price

Unit: USD/Tonne
---
---
Loading Chart...
  • MUST READ: AEMC’s Nikolai: America’s Answer to Indonesia’s Nickel Crunch


    DISCLAIMER 

    New Era Publishing Inc. and/or CarbonCredits.com (“We” or “Us”) are not securities dealers or brokers, investment advisers, or financial advisers, and you should not rely on the information herein as investment advice. Alaska Energy Metals. (“Company”) made a one-time payment of $90,000 to provide marketing services for a term of three months. None of the owners, members, directors, or employees of New Era Publishing Inc. and/or CarbonCredits.com currently hold, or have any beneficial ownership in, any shares, stocks, or options of the companies mentioned.

    This article is informational only and is solely for use by prospective investors in determining whether to seek additional information. It does not constitute an offer to sell or a solicitation of an offer to buy any securities. Examples that we provide of share price increases pertaining to a particular issuer from one referenced date to another represent arbitrarily chosen time periods and are no indication whatsoever of future stock prices for that issuer and are of no predictive value.
    Our stock profiles are intended to highlight certain companies for your further investigation; they are not stock recommendations or an offer or sale of the referenced securities. The securities issued by the companies we profile should be considered high-risk; if you do invest despite these warnings, you may lose your entire investment. Please do your own research before investing, including reviewing the companies’ SEDAR+ and SEC filings, press releases, and risk disclosures.
    It is our policy that information contained in this profile was provided by the company, extracted from SEDAR+ and SEC filings, company websites, and other publicly available sources. We believe the sources and information are accurate and reliable but we cannot guarantee them.
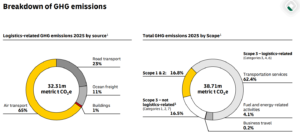
    CAUTIONARY STATEMENT AND FORWARD-LOOKING INFORMATION

    Certain statements contained in this news release may constitute “forward-looking information” within the meaning of applicable securities laws. Forward-looking information generally can be identified by words such as “anticipate,” “expect,” “estimate,” “forecast,” “plan,” and similar expressions suggesting future outcomes or events. Forward-looking information is based on current expectations of management; however, it is subject to known and unknown risks, uncertainties, and other factors that may cause actual results to differ materially from those anticipated.

    These factors include, without limitation, statements relating to the Company’s exploration and development plans, the potential of its mineral projects, financing activities, regulatory approvals, market conditions, and future objectives. Forward-looking information involves numerous risks and uncertainties and actual results might differ materially from results suggested in any forward-looking information. These risks and uncertainties include, among other things, market volatility, the state of financial markets for the Company’s securities, fluctuations in commodity prices, operational challenges, and changes in business plans.

    Forward-looking information is based on several key expectations and assumptions, including, without limitation, that the Company will continue with its stated business objectives and will be able to raise additional capital as required. Although management of the Company has attempted to identify important factors that could cause actual results to differ materially, there may be other factors that cause results not to be as anticipated, estimated, or intended.

    There can be no assurance that such forward-looking information will prove to be accurate, as actual results and future events could differ materially. Accordingly, readers should not place undue reliance on forward-looking information. Additional information about risks and uncertainties is contained in the Company’s management’s discussion and analysis and annual information form for the year ended December 31, 2025, copies of which are available on SEDAR+ at www.sedarplus.ca.

    The forward-looking information contained herein is expressly qualified in its entirety by this cautionary statement. Forward-looking information reflects management’s current beliefs and is based on information currently available to the Company. The forward-looking information is made as of the date of this news release, and the Company assumes no obligation to update or revise such information to reflect new events or circumstances except as may be required by applicable law.


Disclosure: Owners, members, directors, and employees of carboncredits.com have/may have stock or option positions in any of the companies mentioned: .

Carboncredits.com receives compensation for this publication and has a business relationship with any company whose stock(s) is/are mentioned in this article.

Additional disclosure: This communication serves the sole purpose of adding value to the research process and is for information only. Please do your own due diligence. Every investment in securities mentioned in publications of carboncredits.com involves risks that could lead to a total loss of the invested capital.

Please read our Full RISKS and DISCLOSURE here.