Walmart (NYSE: WMT) has taken a major step toward cleaner energy by signing its first-ever nuclear power purchase agreement (PPA) with Constellation Energy. The long-term deal will provide emissions-free electricity from Constellation’s Dresden Clean Energy Center in Illinois and help support Walmart’s climate goals while strengthening local energy infrastructure.
The agreement covers about 176 megawatts (MW) of wholesale electricity supply, including 30 MW of additional generation capacity from planned efficiency upgrades at the nuclear facility.
Under the agreement, the retail giant will purchase electricity, environmental attributes, and capacity through two separate 15-year contracts starting in 2029 and 2030.
Walmart stock (WMT stock) moved slightly higher after the company announced its first nuclear energy deal with Constellation Energy. The stock rose about 1.9%, trading near $120, as investors reacted positively to Walmart’s plan to secure reliable, carbon-free electricity for its future operations.
Dresden Plant Expansion Supports Walmart Growth in Illinois
The agreement will help fund power uprates at the Dresden Clean Energy Center. These upgrades improve the efficiency of existing nuclear reactors and increase electricity output without building a new facility.
The additional power generated through these improvements will support Walmart’s new high-tech perishable distribution center currently under development in Belvidere, Illinois.
Together, the nuclear energy agreement and the distribution center investment are expected to create jobs, strengthen local communities, and support Walmart’s growing supply chain operations across the region.
Constellation announced in late 2025 that Dresden received renewed operating licenses, allowing the facility to continue operating through 2049 and 2051. The plant currently supports more than 1,100 jobs and provides reliable carbon-free electricity across Illinois.
Walmart Faces Challenges on Its Road to Net Zero
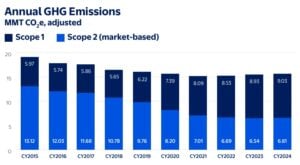
Walmart has set ambitious climate goals. The company aims to reduce its Scope 1 and Scope 2 greenhouse gas emissions by 65% by 2030 compared to 2015 levels. It also plans to achieve net-zero operational emissions by 2040.
However, it acknowledged in 2024 that reaching its interim climate targets may be difficult. The company cited challenges such as limited availability of low-carbon refrigeration technologies, transportation solutions, and clean energy infrastructure.
Scope 1 emissions come from sources Walmart directly controls, including transportation fleets, refrigeration systems, and fuel use in facilities. Scope 2 emissions result from purchased electricity used to power stores, distribution centers, and offices.
Despite these challenges, the company continues to make progress.
In 2024, the company reduced its emissions intensity by 3.7% compared to the previous year.
Since 2015, Walmart’s total Scope 1 and Scope 2 emissions have fallen by 18.1%, while emissions intensity has dropped by 47.4%.
Source: Walmart
The company noted that emissions increased slightly in some areas because of business growth. Higher transportation activity in the U.S. and expansion across Mexico and Central America contributed to increased emissions. Renewable energy production in some regions also declined because of drought and extreme heat conditions.
Building a More Resilient Power Mix
Alongside nuclear energy, Walmart continues to invest heavily in renewable power.
It aims to source 50% of its electricity from renewable energy by 2025 and reach 100% renewable electricity across its operations by 2035.
In 2024, renewable sources supplied 48.5% of Walmart’s global electricity needs. About 30.6% of its electricity came through renewable energy contracts, including long-term agreements tied to wind and solar projects.
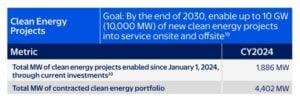
It has also announced plans to help enable up to 10 gigawatts (GW) of new clean energy projects between 2024 and 2030.
Source: Walmart
These investments are expected to support grid reliability while helping the company secure affordable, low-carbon power.
The new nuclear agreement complements Walmart’s broader clean energy strategy by adding a dependable source of emissions-free electricity to its growing energy portfolio.
Constellation Bolsters Its Position as America’s Nuclear Leader
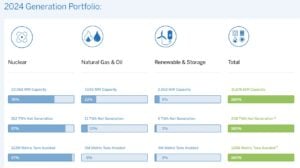
Constellation Energy is the largest nuclear power operator in the United States. It operates about 55 gigawatts (GW) of generating capacity across nuclear, natural gas, hydro, wind, solar, and geothermal facilities.
Its fleet produces enough electricity to power roughly 27 million homes and delivers nearly 10% of the nation’s clean energy. The company also serves around 2.5 million customer accounts, including about 80% of Fortune 100 companies.
Source: Constellation
As companies work to reduce emissions and meet climate targets, nuclear energy is becoming an increasingly attractive option. Unlike wind and solar power, nuclear plants provide around-the-clock electricity, making them a reliable source of carbon-free energy.
US Nuclear Generating Capacity
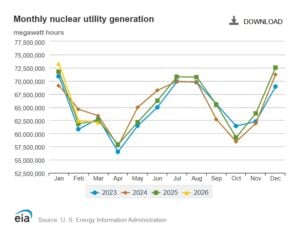
The United States remains the world’s largest producer of nuclear energy. EIA data shows that, in 2025, the country had about 97 GW of operating nuclear capacity, generating roughly 785 terawatt-hours (TWh) of electricity annually.
Nuclear power supplies around 18% of U.S. electricity and nearly half of the nation’s carbon-free power, making it a critical part of the country’s clean energy transition.
The deal also reflects a broader shift in the U.S. energy market. Rising electricity demand from data centers, advanced manufacturing, and electrification is increasing the need for stable, low-carbon power sources.
Illinois is an important market for both companies. Constellation’s generating assets play a key role in the state’s electricity supply, while Walmart operates approximately 175 stores and clubs and employs more than 55,000 associates across Illinois.
As demand for reliable clean power rises, Walmart’s partnership with Constellation could serve as a model for other large corporations seeking to balance growth, energy security, and emissions reductions.
Amazon is opening its carbon credit agreements to Climate Pledge signatories and chosen suppliers. This change allows more companies to access high-quality carbon credits, which are often hard to get.
The program allows participating companies to purchase carbon credits from three projects that Amazon has already helped finance, which include:
a direct air capture (DAC) facility in Texas developed by 1PointFive,
a methane reduction project for rice farming in India, and
a landscape restoration initiative in South Africa.
Companies that signed Amazon’s Climate Pledge can join the program. Amazon suppliers and other partners in the value chain are also included.
The tech giant says that buyers can purchase as few as 100 carbon credits, and there’s no need for long-term contracts. This makes it easier for organizations to access high-quality carbon credits.
The Carbon Gold Rush: Why Future Credits Are Being Claimed Today
The move comes at a time when demand for premium carbon credits is rising rapidly. Many companies have set net-zero targets, but the supply of high-quality carbon removals remains limited. By sharing access to its long-term carbon deals, Amazon hopes to help partners reduce emissions while supporting the growth of new climate projects.
The initiative also marks a new phase in corporate climate action. Large companies are no longer just buying carbon credits. They are helping build the markets needed to scale carbon removal technologies.
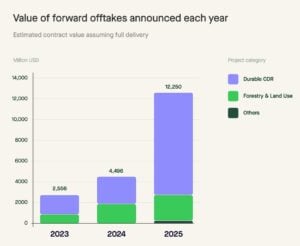
Unlike traditional carbon credit purchases, offtake agreements allow companies to commit to buying future credits before they are issued. These early commitments help project developers secure funding and expand operations.
This model has become increasingly popular as competition for carbon removals grows. Major buyers such as Microsoft, Google, Stripe, Shopify, and Amazon have all signed long-term agreements to secure future carbon credit supplies.
Source: Sylvera
The need is growing quickly. According toCDR.fyi, buyers contracted more than 29.6 million metric tons of carbon dioxide removal credits in 2025. However, only a small share of those removals have actually been delivered so far. This gap between demand and supply is pushing companies to lock in future credits years in advance.
Amazon’s new program gives smaller companies access to opportunities that would otherwise be difficult to negotiate on their own.
Too Many Buyers, Not Enough Credits
Amazon’s announcement points out a key challenge in the voluntary carbon market (VCM): there aren’t enough high-quality credits to meet future demand.
Many companies have pledged to reach net-zero emissions between 2040 and 2050. As those deadlines approach, demand for carbon removals is expected to increase sharply.
McKinsey estimates global demand for carbon credits could reach between 1.5 billion and 2 billion metric tons annually by 2030. By 2050, demand could exceed 7 billion metric tons per year.
Source: McKinsey & Company
At the same time, analysts expect the voluntary carbon market to grow significantly. Some forecasts project that the market could be worth more than $50 billion by 2030 if corporate climate commitments continue to grow.
However, buyers are becoming more selective. Many now favor projects that remove carbon from the atmosphere or deliver measurable emissions reductions. This has increased interest in technologies such as direct air capture, biochar, and methane reduction.
As a result, future supplies of high-integrity credits are becoming increasingly valuable.
How the Program Fits Amazon’s Climate Goals
The new initiative supports Amazon’s broader climate strategy. Per Amazon’s Jamey Mulligan,
“Most of what will be left in our footprint in 2040 will be in our Scope 3. And so we need our suppliers to be participating.”
In 2019, Amazon co-founded The Climate Pledge, which commits companies to reach net-zero carbon emissions by 2040. The pledge now includes more than 550 signatories across 46 countries and over 60 industries.
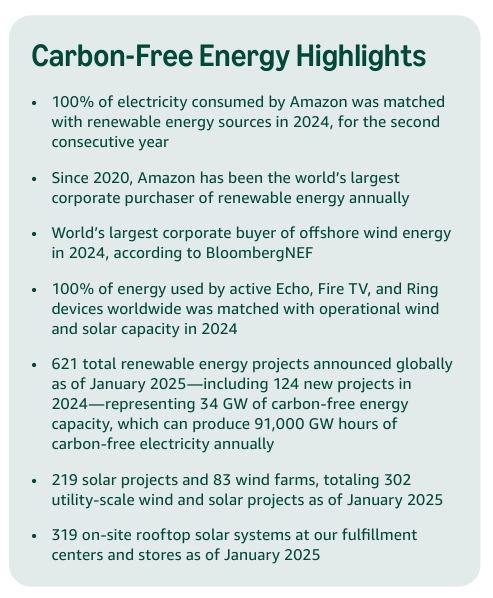
Amazon has also invested heavily in renewable energy and low-carbon technologies. The company’s latest sustainability report shows it matched 100% of its global electricity use with renewable energy for the second year in a row.
The tech firm now supports more than 500 solar and wind projects worldwide. Together, these projects generate enough carbon-free electricity to power millions of homes each year.
The company has rolled out over 31,000 electric delivery vans worldwide. It is also investing in sustainable aviation fuel, carbon removal tech, and supply chain decarbonization.
Amazon reported that its carbon footprint has fallen from its 2021 peak, showing progress toward its long-term climate goals.
While carbon credits play an important role in many net-zero plans, they remain controversial.
Critics argue that companies should focus first on reducing emissions directly rather than relying on offsets. Concerns about project quality and verification have also led to greater scrutiny across the carbon market.
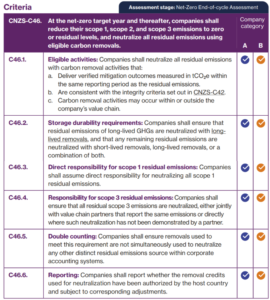
As a result, many climate standards now emphasize that carbon credits should be used only after companies make deep emissions cuts. The Science-Based Targets initiative requires companies to cut at least 90% of their emissions. They can then neutralize the rest with carbon removals.
Source: SBTi
This has increased demand for higher-quality credits that can demonstrate measurable climate benefits.
Amazon’s push for projects like direct air capture and methane reduction shows a shift toward stronger carbon market standards.
Big Tech’s New Arms Race: Locking Up Carbon Removal Supply
Amazon is part of a growing group of technology companies investing heavily in carbon removals.
Microsoft is now the largest corporate buyer of carbon removal credits. They have contracted tens of millions of metric tons in recent years. Frontier, a coalition supported by Stripe, Shopify, Google, Meta, and McKinsey, has pledged almost $1 billion. This funding aims to boost new carbon removal technologies.
The competition is being driven by climate science. The Intergovernmental Panel on Climate Change (IPCC) and other researchers say the world has to remove billions of tons of carbon dioxide from the atmosphere each year by mid-century. This is key to meeting global climate goals.
Yet, many removal technologies are still in the early stages of development. Long-term purchase agreements provide the financial certainty needed to build new facilities and expand capacity. By opening its carbon credit pipeline to partners, Amazon is helping more companies to join this fast-growing market.
From Carbon Buyer to Carbon Market Builder
Amazon’s latest move is about more than carbon credits. The company is using its scale to help create demand for climate projects that may otherwise struggle to attract financing.
The giant e-commerce helps spread the risks and opportunities of carbon market participation by giving suppliers and Climate Pledge members access to its offtake agreements.
The strategy could speed up investments in projects that cut methane emissions, restore ecosystems, and directly remove carbon from the air.
Amazon’s new program shows how large companies are evolving from carbon credit buyers into carbon market builders. If more companies adopt this model, it could unlock the funds needed to grow the next generation of climate solutions.
Google and Energy Dome have taken a major step in long-duration energy storage (LDES) with a new 23 MW / 200 MWh CO₂ battery project in County Offaly, Ireland. The project is the first commercial deal between the two companies. It also boosts their rollout strategy across Europe and North America.
The system is designed to store surplus renewable electricity and dispatch it when demand rises. This helps stabilize grids that are increasingly powered by wind and solar energy.
The Ireland project follows a similar 19 MW / 200 MWh project announced in Arizona in the United States. Together, these deployments signal a coordinated global expansion strategy rather than isolated pilot projects.
The timing is important. Electricity demand from electrification and data centers is rising quickly. Grid operators are under pressure to integrate more renewables without compromising reliability.
Inside Ireland’s Landmark CO₂ Battery Project
The Irish project will be located in County Offaly near the town of Rhode. It will be developed, owned, and operated by Energy Dome. Key technical specifications include:
Capacity: 23MW
Storage: 200MWh
Duration: roughly 8–12 hours of dispatchable power (typical for Energy Dome systems)
Expected operation: 2028
Contract: 10-year capacity agreement with EirGrid
The site sits on a former peat-fired power station. This allows the reuse of industrial land while supporting Ireland’s transition away from fossil fuel generation.
Ireland as a Strategic Grid Test Case
Source: Sustainable Energy Authority of Ireland
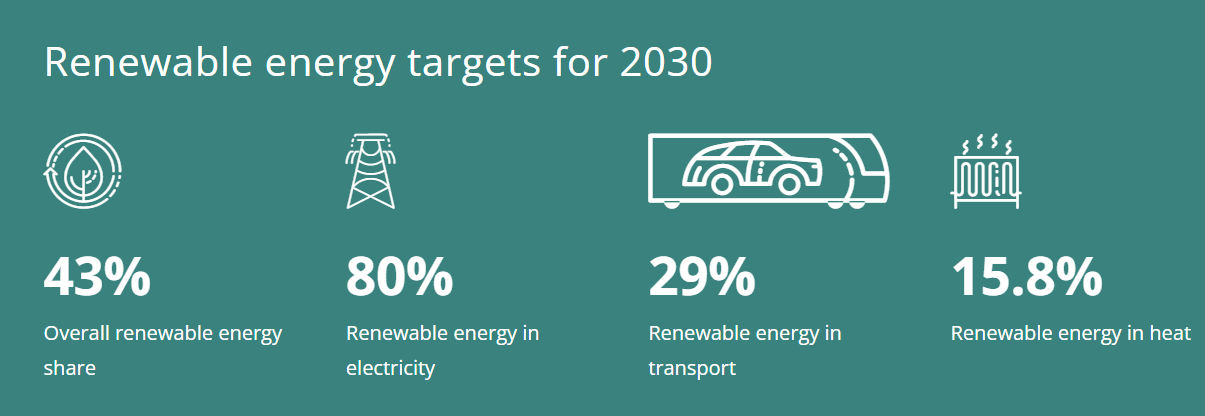
Ireland is becoming an important market for advanced energy storage. The country aims to generate 80% of its electricity from renewable sources by 2030, with wind power expected to play a major role. This creates a structural need for long-duration storage, especially during periods when wind output is high but demand is low.
The country faces three structural challenges:
High wind penetration,
Grid congestion in key regions, and
Rapid growth in electricity demand, including data centers.
The Offaly project is designed to help address these issues. Built on the site of a former peat-fired power station, it repurposes existing energy infrastructure while supporting Ireland’s clean energy transition. Its location near key transmission lines serving the Greater Dublin area could also help improve grid flexibility.
EirGrid’s 10-year capacity contract shows strong support for long-duration storage. This approach helps keep energy reliable as renewable sources grow.
Why Google Sees Storage as the Missing Piece of Clean Power
Google’s participation is part of its broader effort to reach 24/7 carbon-free energy by 2030. The company has already invested in multiple clean energy technologies, including geothermal and advanced nuclear.
The Energy Dome partnership adds a critical missing layer: long-duration storage that can bridge multi-hour renewable gaps.
Google’s challenge is not just annual carbon matching. It is hourly matching. Wind and solar can fluctuate within minutes or hours. Lithium-ion batteries help, but they are typically optimized for short durations of around 1–4 hours.
Energy Dome’s CO₂ Battery system extends that window significantly. The company claims its system can deliver 8 to 24 hours of firm, dispatchable capacity depending on configuration. This makes it suitable for:
Evening peak demand after solar drops,
Multi-day weather variability, and
Grid congestion management in high-renewable regions.
For Google, this supports its data center expansion strategy, where continuous clean electricity is becoming a core infrastructure requirement. Vanessa Hartley, Head of Google Ireland, commented:
“At Google, we are committed to catalyzing next-generation energy technologies to bolster grid resilience and introduce critical storage capacity to the system. This milestone is a next step in our long-term partnership with Energy Dome, and will help scale their promising long-duration energy storage technology, charging ahead to an affordable, secure and clean energy future.”
Energy Dome’s system uses carbon dioxide in a closed-loop thermodynamic cycle. The process has two main phases:
Charging phase
Excess renewable electricity powers compressors
CO₂ is compressed into liquid form
Heat generated during compression is captured and stored
Discharging phase
Stored heat is reused
Liquid CO₂ expands into gas
Gas drives a turbine to generate electricity
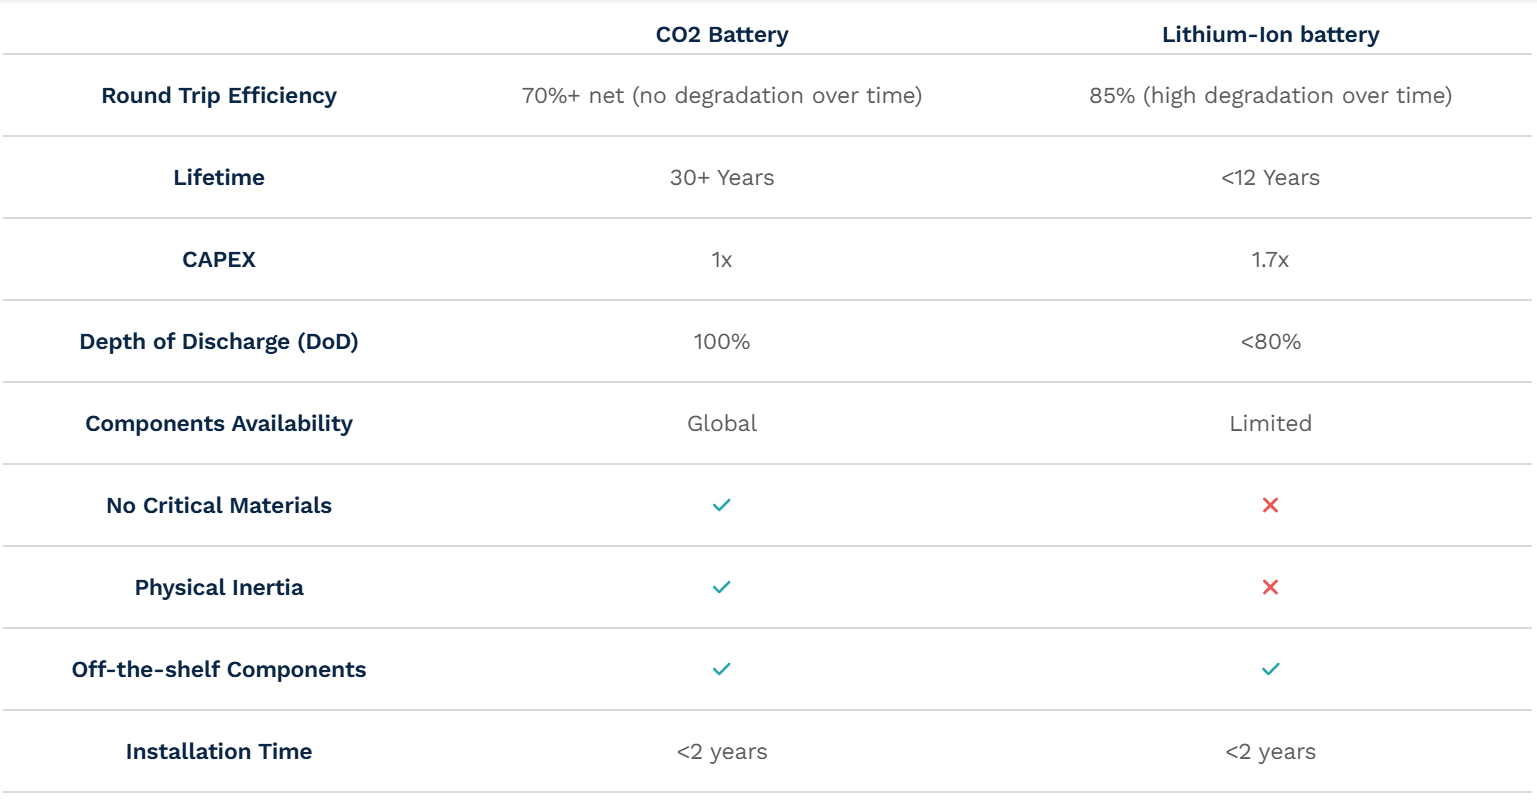
The CO₂ is not consumed; it cycles repeatedly inside the system. The company highlights several design advantages as shown below.
Source: Energy Dome
This positions the technology between lithium-ion batteries and mechanical storage systems like pumped hydro. Unlike lithium-ion, which is constrained by mineral supply chains, CO₂ storage relies mainly on steel, tanks, and compression systems.
The Global Storage Boom Is Just Getting Started
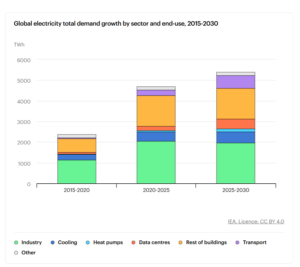
The global energy storage market is entering a new growth phase as countries add more renewable energy to their power systems. The International Energy Agency (IEA) says electricity demand will keep rising until 2030.
Source: IEA
This increase is due to several factors: more electric transport and heating, larger data centers, higher power use from AI, and growing renewable energy production.
As wind and solar become a larger share of the energy mix, grid operators need more ways to balance supply and demand. Short-duration lithium-ion batteries are popular, but many power systems need storage that provides electricity for longer periods.
Interest in long-duration energy storage technologies has grown. This includes CO₂ batteries, pumped hydro, compressed-air storage, and thermal energy systems.
Energy Dome markets its CO₂ Battery as a grid-scale solution. It stores renewable energy and sends it out when needed. The technology aligns with a broader industry trend toward firm renewable power and more resilient electricity networks.
From Arizona to Ireland: A Multi-Continent Expansion
The Ireland facility is part of a broader strategy by Google and Energy Dome to deploy long-duration storage across multiple regions. Along with the Arizona project, this shows a move from demo projects to commercial-scale deployment.
The companies plan to keep expanding their technology in markets. This is where renewable energy growth is driving demand for flexible storage solutions. Energy Dome is also considering a second 200 MWh unit at the Irish site, which could turn the location into a larger storage hub.
Successful CO₂ battery systems could cut renewable energy waste, boost grid reliability, and reduce reliance on gas-fired peaker plants. Countries are aiming for net-zero targets, and electricity demand is growing. So long-duration storage will be crucial for modern power systems.
A Small Project With Big Implications
While the 23 MW Irish project is relatively modest in size, it represents an important milestone for long-duration energy storage. The project shows how advanced storage technology can boost renewable-heavy grids. It also helps companies like Google meet their carbon-free energy goals.
As the energy transition accelerates, projects like this could play a growing role in creating more reliable, flexible, and low-carbon electricity systems worldwide.
The European Central Bank (ECB) is working hard to cut the carbon footprint of its investment portfolios. It aims to support Europe’s green transition. Recent climate disclosures show that by 2025, the ECB and Eurosystem reduced portfolio emissions and increased green bond investments. They also introduced new reporting methods for clearer decarbonization insights.
While emissions are decreasing, future progress depends more on companies reducing their greenhouse gas emissions than on central bank strategies. The ECB is also focusing on nature-related risks alongside climate change.
ECB Portfolio Emissions Continue to Fall
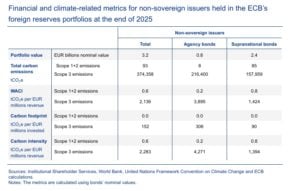
The ECB released its fourth annual climate disclosures, covering various portfolios, including monetary policy and foreign reserves.
It revealed that emissions from these portfolios fell again in 2025. This decline is partly due to a 13% reduction in the portfolios as bonds matured without full replacements.
A smaller investment portfolio leads to lower financed emissions. However, the ECB stressed that reducing the portfolio is just one part of the story. The central bank will continue pursuing climate-related investment goals where possible.
The Eurosystem is on track to meet its interim emissions reduction targets for corporate bond holdings. These targets use relative carbon intensity, comparing emissions to company revenue, aligning with the Paris Agreement and the EU’s climate neutrality goals.
New Inflation-Adjusted Metrics Show Real Climate Progress
A key change this year is the introduction of inflation-adjusted emissions metrics.
Previously, carbon intensity calculations used nominal revenues. High inflation could make carbon intensity look better, even if emissions stayed the same.
Now, the ECB adjusts revenues for inflation before calculating carbon intensity. This gives a clearer view of decarbonization, showing real emissions declines from operational changes and cleaner practices.
The bank believes these new indicators enhance transparency and help investors understand long-term climate performance.
Scope 3 Emissions Included for the First Time
Another major improvement is the inclusion of Scope 3 emissions for non-sovereign holdings.
Scope 3 emissions are indirect greenhouse gas emissions from a company’s value chain, including those from suppliers and transportation. For many sectors, these emissions account for the largest share of total carbon output.
The ECB noted that improvements in emissions reporting now allow it to share these figures, though some limitations remain due to incomplete company reporting. Adding Scope 3 data gives investors a fuller picture of portfolio impacts and aligns with growing international reporting standards.
In addition to lowering emissions, the ECB is boosting investments that support climate solutions.
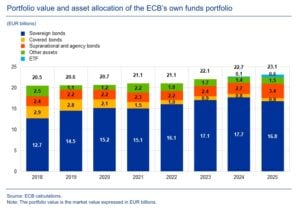
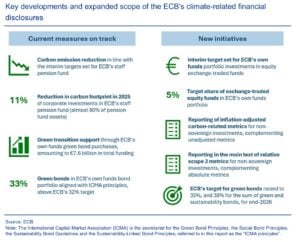
By the end of 2025, the ECB’s own funds portfolio increased its green bond share to 33%, amounting to about €7.6 billion in projects supporting the green transition.
These investments fund renewable energy, energy efficiency, sustainable infrastructure, and clean transportation across Europe.
The ECB aims to raise the green bond allocation to 35% in 2026, showing its commitment to sustainable finance.
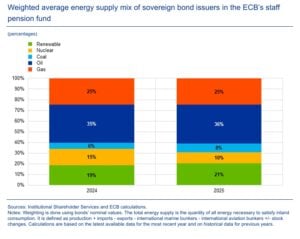
Additionally, the ECB’s staff pension fund also made progress, with its corporate investments’ carbon footprint declining again in 2025, keeping it on track for climate goals.
ECB Puts Nature and Biodiversity Higher on Its Green Agenda
Climate change is no longer the ECB’s only environmental focus. The bank is expanding its assessment of nature-related risks, recognizing links between biodiversity loss, ecosystem degradation, and climate change.
Following last year’s disclosures, the bank again reported on portfolio exposure to industries that significantly impact nature, in line with the Taskforce on Nature-related Financial Disclosures (TNFD).
Nature-related reporting is growing. The ECB expects better data, and global standards will improve disclosure quality. The bank plans to gradually enhance these disclosures in future reports.
More Transparency, Stronger Climate Action
The ECB emphasizes that publishing detailed climate disclosures is key to improving transparency in financial markets.
National central banks in the Eurosystem, such as the Bundesbank, shared their climate reports with the ECB. This shows a united push to improve climate reporting in Europe.
The ECB will continue to include climate change and nature loss in its policies. While portfolio emissions are improving, future progress will depend more on companies, banks, and the broader economy taking faster action to reduce real-world emissions. They can’t just depend on financial portfolio changes.
Banks’ Critical Role in Financing Emissions
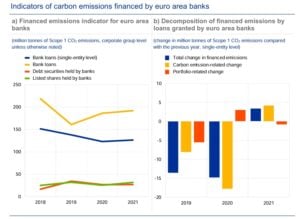
The report also emphasizes the crucial role banks have in financing corporate carbon emissions. Banks support businesses mainly through loans and, to a lesser extent, corporate bond investments. Thus, their lending choices heavily impact the financial system’s emissions.
It emphasized that financed emissions linked to euro area banks have generally decreased since 2018. However, progress has been uneven. After a significant drop during the COVID-19 pandemic, financed emissions rose slightly in 2021 as economic activity picked up.
Source: ECB
But Future Emissions Cuts Will Become More Difficult
Despite ongoing reductions, the ECB recognizes that cutting emissions will become harder in the coming years.
Previously, the central bank favored reinvesting in companies with strong climate performance when bonds matured. But as monetary policy portfolios shrink, there are fewer opportunities to adjust for lower-emission companies.
Future reductions in financed emissions will rely more on businesses actively lowering their greenhouse gas emissions. Passive portfolio reduction alone won’t drive significant climate gains. Companies need to accelerate decarbonization through cleaner technologies and renewable energy.
Notably, the ECB found that banks have made limited changes to their lending portfolios. Most of the decline in financed emissions came from shifts in corporate emissions, not from banks moving loans to lower-carbon firms.
These findings indicate that European banks have not yet significantly reduced lending to high-emission businesses. Stronger financial sector action is essential for Europe to transition to a low-carbon economy.
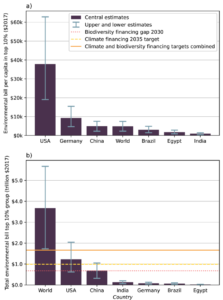
A new study has put a price tag on one of the biggest drivers of environmental damage: consumption by the world’s wealthiest households. Researchers from Leiden University and the University of Oxford found that the top 10% of global consumers cause $1.7 trillion to $5.7 trillion in environmental cost each year.
The study, published in Nature Communications Sustainability, offers one of the clearest estimates yet of how spending patterns translate into environmental costs.
The numbers are striking. At the high end, the annual damage exceeds the combined funding needed to meet major global climate and biodiversity goals. Scientists warn that humanity has crossed seven of the nine planetary boundaries. These boundaries define a safe space for human societies, and so the findings come at a critical moment.
The message of the study is this: a relatively small share of the world’s population is placing a disproportionate burden on the planet.
Climate Change and Nature Loss Drive Most of the Costs
Researchers looked at how consumption impacts various environmental systems. They also estimated the financial cost of that damage. Their analysis covered climate change, biodiversity loss, freshwater use, land-use change, and nutrient pollution.
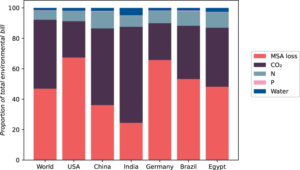
The highest costs came from biodiversity loss, which accounted for 47% to 56% of total environmental damage. Climate change followed closely, contributing 36% to 45% of the total. Together, these two issues made up more than 90% of the estimated costs.
Notes: MSA loss (biodiversity loss) is displayed in red, CO2 (climate change) in purple, N (nitrogen biogeochemical cycle) in light blue, P (phosphorus biogeochemical cycle) in pink, and freshwater use in dark blue. Source: Schrijver, I., Hoekstra, R. & Behrens, P. (2026). https://doi.org/10.1038/s44458-026-00079-x.
Even the study’s lowest estimate of $1.7 trillion per year is enormous. It exceeds the financing gaps that governments are trying to close through global climate and biodiversity agreements.
The findings show that environmental damage is not only a problem for ecosystems. It is also becoming a major economic challenge.
The More We Consume, the More the Planet Pays
The study found a strong link between wealth and environmental impact. Across the world, the average person in the top 10% of consumers causes between $2,300 and $7,500 in environmental damage every year.
In the United States, where consumption levels are among the highest globally, the damage rises to between $19,000 and $63,000 per person annually. According to the researchers, that equals roughly 6% to 20% of annual income or 0.8% to 3% of personal wealth.
Source: Schrijver, I., Hoekstra, R. & Behrens, P. (2026). https://doi.org/10.1038/s44458-026-00079-x.
The findings support previous research on emissions inequality.
Oxfam and the Stockholm Environment Institute say that the richest 10% of people worldwide account for almost half of carbon emissions from consumption. By contrast, the poorest half of humanity contributes only a small share despite representing billions of people.
The evidence points to a clear pattern: environmental impacts rise sharply as consumption increases.
One of the study’s most important findings is that biodiversity loss now rivals climate change as a global economic risk.
Climate change often dominates environmental discussions, but biodiversity loss actually has the highest cost in the analysis. That matters because modern economies depend heavily on healthy ecosystems.
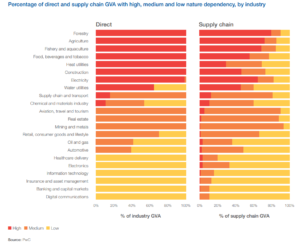
The World Economic Forum reports that over half of global GDP, about $58 trillion, relies significantly on nature and ecosystem services. Agriculture, food production, water supplies, forestry, fisheries, and many industrial sectors rely on functioning ecosystems.
Source: World Economic Forum
Yet, biodiversity continues to decline rapidly.
The Intergovernmental Science-Policy Platform on Biodiversity and Ecosystem Services (IPBES) estimates that about one million species are at risk of extinction. Many of these could disappear in the next few decades.
Biodiversity loss is speeding up. Because of this, businesses and investors are focusing more on nature-related risks. These risks could disrupt supply chains, food systems, and economic growth.
Nature Still Loses the Funding Battle
Despite growing awareness, funding for nature protection remains far below what experts say is needed.
Earlier this year, the United Nations Environment Programme reported that for every dollar spent on nature protection, about $30 goes into activities that harm ecosystems. At the same time, governments continue to face large funding gaps.
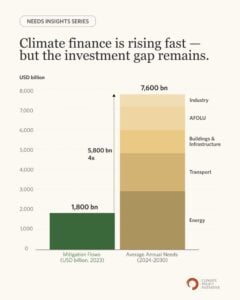
The Kunming-Montreal Global Biodiversity Framework aims to close a biodiversity finance gap estimated at roughly $700 billion per year. Climate finance needs are even larger. Countries recently agreed on goals that could require close to $1 trillion annually for climate action by 2035.
The environmental costs identified in the study are comparable to these funding needs. This comparison shows a big problem: the world spends much more on harmful activities than on those that help nature.
Climate Policy Is Starting to Focus on Consumption
For decades, environmental policies mainly targeted production. Governments regulate power plants, factories, vehicles, and industrial facilities. While those efforts remain important, researchers increasingly argue that consumption patterns also deserve attention.
High-income households often travel more. They buy more goods, live in bigger homes, and use more energy-intensive products and services.
As a result, their environmental footprint is often much larger than the global average. This debate is gaining momentum as countries work toward net-zero goals.
The International Energy Agency reports that global carbon dioxide emissions from energy hit a record 37.8 billion metric tons in 2025. This rise happened even with ongoing growth in renewable energy and clean technologies.
Many experts now believe that cleaner technologies alone may not be enough. Resource efficiency, circular economy strategies, and sustainable consumption are key topics in climate policy talks.
The Bill for Environmental Damage Keeps Growing
The study does not argue against economic growth or rising living standards. Instead, it shows that a small number of high-consuming households cause a great deal of environmental damage.
By putting a dollar value on those impacts, the researchers offer a new way to understand the true cost of crossing planetary boundaries. Their findings arrive at a critical moment. Climate risks are growing, biodiversity continues to decline, and pressure on natural resources is increasing.
At the same time, governments, investors, and businesses are searching for ways to finance climate action and nature restoration.
The study suggests that part of the solution may involve more than raising new funding. It may also need to lower the environmental costs from the world’s biggest households.
Research shows that solving environmental issues might rely on two things: how much money is spent on solutions and how our consumption habits create the problems. This is significant as policymakers are getting ready for future climate and biodiversity talks, especially the upcoming 2026 United Nations Climate Change Conference, COP31, in November.
Europe’s battery storage market is rapidly expanding, and Tesla (TSLA stock) has secured a major energy storage deal. The electric vehicle maker signed a multi-year agreement with NatPower to supply over 25 GWh of Battery Energy Storage Systems (BESS) in Italy and the UK.
This partnership merges technology, engineering, financing, grid integration, and energy trading into one model. With an initial portfolio of five projects, they aim to exceed 100 GWh over time.
The collaboration could generate over $15 billion in revenue over 20 years while strengthening Europe’s power grid.
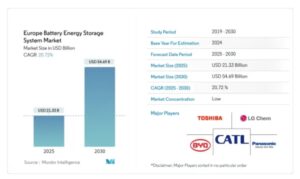
Reports indicate that the European Battery Energy Storage System (BESS) could reach $54.7 billion by 2030, at an average rate of 20.7% per year between 2025 and 2030.
Source: Modor Intelligence
Mike Snyder, VP Tesla Energy & Charging, said:
“Tesla is excited to partner with NatPower on this long-term agreement. They have a strong vision for scaling battery deployments quickly and efficiently across Europe. Our team of experts are helping accelerate these deployments through our vertically integrated offering, providing hardware, software, construction, trading optimization and service to bring projects online faster and ensure they operate smoothly throughout the lifetime of the product.”
Tesla Brings More Than Batteries to the Deal
The press release revealed that NatPower will own and operate the battery projects, while Tesla will supply its Megapack systems. However, Tesla’s role goes further. The company will provide engineering, procurement, and construction (EPC) services, along with energy trading solutions through its Autobidder platform.
This integrated approach gives NatPower confidence in project execution. Instead of juggling multiple contractors, it can rely on one framework for battery manufacturing, project delivery, and long-term energy operations.
The agreement also allows NatPower to use Tesla’s latest technology while enhancing financial security for large-scale projects.
Fabrizio Zago, CEO of NatPower, noted:
“The significance of this agreement lies in its ability to turn project development into concrete execution. The sector has access to technology and capital but still struggles to deliver infrastructure consistently and within the required timelines. What we have built with Tesla is an ecosystem that enables alignment between capital and execution, and that can be replicated across multiple markets.
Today, with this strategic agreement, we are launching the delivery of the first five major projects developed over recent years in Italy and the United Kingdom. This is a historic moment for our companies, not only because of the scale of the agreement, but also because of the impact it will have on the energy infrastructures.”
A New Model for Delivering Battery Storage
The first phase includes five utility-scale battery projects in Italy and the UK. These mark the start of a much larger program targeting over 100 GWh of storage capacity.
The total construction value is estimated at $4 billion to $5 billion, with projected revenues exceeding $15 billion over 20 years.
Unlike traditional projects that often progress through separate stages, this agreement coordinates all major steps within a single framework.
The partnership addresses five key challenges that often delay energy infrastructure projects:
Reserving manufacturing capacity
Securing grid connections
Managing permits and regulatory approvals
Structuring project financing
Coordinating construction schedules
By linking battery production directly to project delivery, Tesla and NatPower aim to reduce delays as demand for energy storage surges.
While Tesla’s automotive growth has slowed, its energy division is expanding quickly. The company deployed a record 46.7 GWh of energy storage in 2025, showing 48% year-over-year growth. Analysts expect strong deployments in 2026, with first-quarter installations around 8.8 GWh.
Tesla has also sped up product development. Last year, it introduced Megapack 3 and Megablock, pre-integrated systems that reduce installation time and simplify deployment. These innovations help developers build storage facilities faster, addressing a major industry challenge.
Source: Tesla
The NatPower agreement boosts Tesla’s position in Europe’s utility-scale storage market and highlights energy storage as a key growth area.
Why Europe Needs More Battery Storage
The agreement comes as Europe’s electricity system faces increasing pressure. Countries are adding wind and solar generation rapidly, but renewable electricity relies on weather, not demand. Battery storage helps by storing excess power and delivering it when needed.
The planned systems will provide crucial services, including:
Stabilizing electricity grids
Supporting renewable energy integration
Supplying dispatchable electricity during high demand
Providing backup power for industrial facilities and large data centers
Demand for these services is rising as electrification accelerates in transportation, manufacturing, and heating. Additionally, artificial intelligence drives unprecedented electricity consumption from data centers, making reliable infrastructure essential.
This agreement emphasizes fast project delivery, a vital advantage as Europe modernizes its electricity network.
2030 Forecast: Europe’s Battery Storage Market to Grow 4X
The timing of the agreement aligns with a booming European battery storage market. According to SolarPower Europe’s European Battery Market Outlook 2026-2030, Europe installed 36 GWh of new battery storage in 2025, marking the twelfth year of growth.
These additions pushed the continent’s total operational capacity above 100 GWh for the first time. After a slow 2024, the market surged, growing 48% year over year. Much of this growth came from utility-scale projects, which now account for over half of all new installations.
The trend reflects rising demand for grid flexibility and strong project economics.
Germany, the UK, and Italy remained the largest markets, while countries like Ukraine and Bulgaria entered the top five, showing that battery deployment is spreading.
The growth outlook remains strong. Projections include:
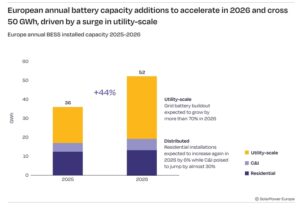
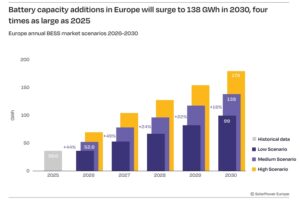
Annual installations are expected to exceed 50 GWh in 2026, reaching around 138 GWh by 2030—nearly four times the 2025 level.
Installed capacity could reach about 470 GWh by the decade’s end.
Utility-scale storage is likely to dominate, making up around 75% of Europe’s total capacity by 2030.
Execution May Be the Industry’s Biggest Competitive Advantage
The Tesla-NatPower agreement signals a shift in the battery storage industry. Building battery projects now involves securing equipment, manufacturing capacity, financing, approvals, grid access, and construction expertise.
By combining these elements into one framework, the partnership offers a model for future large-scale energy projects.
As electricity demand grows faster than new power infrastructure, delivering projects on time has become just as important as the technology itself.
Through this partnership, Tesla (TSLA) expands its role in the energy storage market while NatPower bolsters its position in Europe. Together, they will help build a more reliable power grid that supports renewable energy, rising AI-driven electricity demand, and long-term energy security.
Sweden has taken a major step toward expanding nuclear energy for the first time in more than four decades. The country chose Rolls-Royce SMR to provide three small modular reactors (SMRs). These will support a new nuclear project on the Värö Peninsula, close to the Ringhals nuclear power station.
The decision follows a three-year review process in which project developer Videberg Kraft evaluated 75 reactor options before choosing Rolls-Royce’s technology. Tufan Erginbilgic, CEO, Rolls-Royce plc. remarked:
“Rolls-Royce SMR has now been successful in every competitively tendered SMR selection process in Europe, and it is now very well placed to become a market leader globally.”
Why Sweden Needs Twice as Much Electricity by 2045
The project could add about 1.41 gigawatts (GW) of new electricity capacity to Sweden’s grid. Each reactor is designed to generate 470 megawatts (MW) of power, with the first unit expected to enter operation in the mid-2030s.
The announcement marks a significant milestone for both Sweden and the global SMR industry. Sweden’s first big nuclear project since the 1980s is here. It’s also one of the largest investments in small modular reactor technology in Europe.
Sweden’s nuclear expansion comes as electricity demand could grow sharply over the coming decades. The Swedish Energy Agency predicts that electricity use could grow from about 135 terawatt-hours (TWh) now to over 300 TWh by 2045.
Most of that growth will likely come from:
Industrial electrification,
Electric vehicles,
Hydrogen production, and
Data centers.
Source: IEA
At the same time, Sweden has committed to reaching net-zero greenhouse gas emissions by 2045. Meeting both goals will require a substantial increase in clean electricity generation.
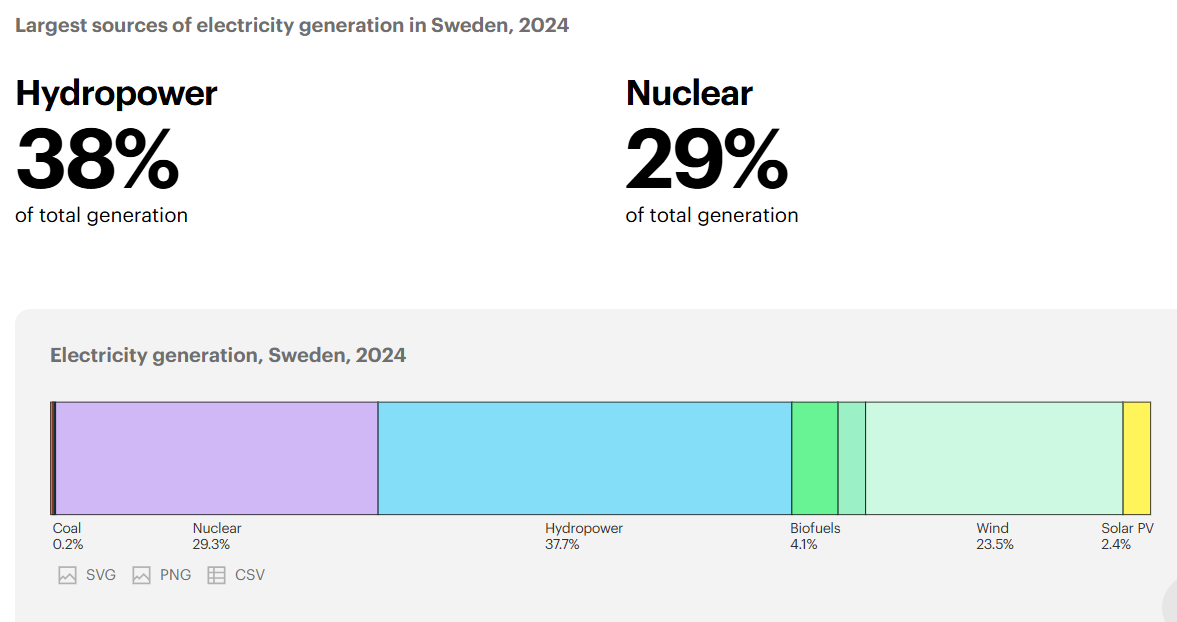
Today, Sweden already has one of Europe’s cleanest power systems. The International Energy Agency (IEA) reports that about 98% of Sweden’s electricity is from fossil-free sources. This mainly includes hydropower, nuclear energy, and wind power.
Source: IEA
However, policymakers believe additional generation will be needed to maintain energy security while supporting industrial growth.
Sweden’s government has proposed support measures to tackle that challenge. These measures are worth up to 440 billion Swedish kronor, which is about €40 billion or US$47 billion. The package includes state-backed loans, long-term price guarantees, and support for nuclear waste management.
The goal is to build at least 5 GW of new nuclear capacity, equivalent to several large reactors, by the middle of the century.
Unlike traditional nuclear plants, which often exceed 1 GW per reactor, SMRs are smaller and designed for factory-based manufacturing. Developers argue that standardized designs can reduce construction costs, shorten build times, and lower project risks.
Rolls-Royce’s reactor design produces 470 MW. This makes it one of the larger SMR concepts in development today. The company estimates that one unit can supply electricity to about one million homes. Plus, it produces no direct carbon emissions when in operation.
Interest in the technology is accelerating worldwide.
According to the International Atomic Energy Agency (IAEA), more than 80 SMR designs are currently being developed globally. Governments and utilities in Europe, North America, and Asia are looking at SMRs. They see them as a way to decarbonize power systems while also keeping the electricity supply reliable.
Sweden now joins a growing list of countries supporting the technology. The deal makes Sweden the third European country to select Rolls-Royce SMR technology after the United Kingdom and the Czech Republic.
Sweden’s decision reflects a broader global nuclear resurgence. According to the IEA, nuclear power generated around 2,900 TWh of electricity worldwide in 2024, close to a record high. Moreover, over 70 GW of new nuclear capacity is currently under construction globally.
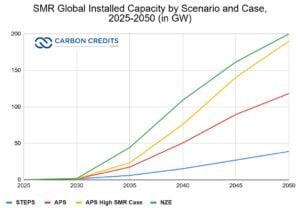
SMRs are also expected to grow massively by 2050. Under the Net Zero scenario, it can reach 200 GW of installed capacity.
Investment is also increasing. The IEA estimates annual global investment in nuclear power has risen by nearly 50% since 2020, reaching around US$75 billion per year.
Several factors are driving renewed interest.
First, governments need reliable low-carbon electricity to support net-zero goals.
Second, growing renewable energy deployment increases demand for stable power sources that can operate regardless of weather conditions.
Third, rapidly expanding data center infrastructure is creating new electricity demand.
The IEA projects global data center electricity demand could more than double by 2030. Some forecasts suggest AI-driven data centers may consume as much electricity as major industrialized countries within the next decade.
As a result, policymakers are now viewing nuclear energy as a complement to renewable energy rather than a competitor.
Rolls-Royce is Expanding Beyond Aerospace
The project also represents an important milestone for Rolls-Royce. The company is best known for aircraft engines. Recently, it has focused on developing its SMR business. This effort is part of a larger plan to move into clean energy technologies.
Rolls-Royce received final approval for its SMR design from UK regulators earlier this year, a key step toward commercial deployment.
The company claims that using a fleet-based approach can cut costs. This is possible by making standard reactor parts and using them in different projects.
The Swedish selection provides another major vote of confidence. For Rolls-Royce, this project boosts its stance in the tough global SMR market. Key competitors include GE Hitachi, Westinghouse, Holtec, X-energy, NuScale, and TerraPower.
The global opportunity could be significant. Industry analysts estimate the SMR market could be worth hundreds of billions of dollars over the coming decades as countries seek low-carbon electricity solutions.
Rolls-Royce Shares Rally on Nuclear Boom
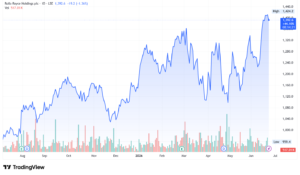
Investors reacted positively to the Swedish contract announcement. On the day the deal was announced, U.S.-listed shares of Rolls-Royce (RYCEY) jumped almost 4%. This was their highest level since March 2026. Markets saw this as a strong endorsement of the company’s SMR strategy.
This boosts Rolls-Royce’s status as a top nuclear technology provider in Europe. The RYCEY stock has risen over 16% this year and about 45% in the last 12 months and has outperformed the wider equity markets. Investors are excited about growth in nuclear energy, defense, and power systems.
Could This Project Redefine Europe’s Energy Future?
The selection of Rolls-Royce SMR is more than a single infrastructure project. It signals Sweden’s long-term commitment to nuclear energy as part of its climate and energy strategy.
The project will still face regulatory reviews, financing decisions, and construction challenges before power begins flowing in the mid-2030s. Yet, the direction is becoming clear.
For Rolls-Royce, the contract represents one of the most important SMR wins to date. For Sweden, it marks the start of a new chapter in nuclear development after more than 40 years.
For the broader energy sector, it offers another sign that nuclear power is once again becoming a central part of the global clean energy transition.
Amazon has signed Germany’s biggest-ever corporate clean energy deal, marking another major step in Europe’s renewable energy transition. The tech giant has entered into a 600-MW power purchase agreement (PPA) with offshore wind developer Skyborn Renewables for electricity from the Gennaker offshore wind farm in the German Baltic Sea.
The agreement is not only the largest single PPA ever signed in Germany but also ranks among the biggest corporate renewable energy contracts in Europe, according to BloombergNEF. The deal covers about 61% of Gennaker’s planned 976.5 MW capacity, providing the financial certainty Skyborn needs to begin construction.
The project also strengthens Amazon’s position as Europe’s largest corporate buyer of carbon-free electricity while supporting Germany’s ambitious renewable energy and climate targets.
Large renewable energy projects often depend on long-term electricity buyers before investors and lenders are willing to commit billions of dollars in financing. Amazon’s agreement provides that certainty.
Backed by the PPA, Skyborn plans to move ahead with financial close during the summer of 2026, with construction beginning shortly afterward. Commercial operations are expected by the end of 2028.
Once completed, Gennaker will become the largest offshore wind farm in Germany’s Baltic Sea. Located around 15 kilometers north of the Fischland-Darß-Zingst peninsula in Mecklenburg-Western Pomerania, the project will feature 63 next-generation offshore wind turbines, each rated at 15 MW.
Together, the turbines will generate enough carbon-free electricity to supply the equivalent of more than one million German households every year.
The project also supports Germany’s goal of installing 30 gigawatts (GW) of offshore wind capacity by 2030, while improving the country’s energy security through greater domestic renewable power generation.
Skyborn Builds on Strong Offshore Wind Experience
Skyborn Renewables has developed Gennaker from its earliest planning stages and secured the project’s construction permit in December 2025.
The company specializes in developing, building, and operating offshore wind projects across the entire value chain. Its strategy focuses on mature markets and proven technologies while maintaining responsibility for project development through operation.
Skyborn has already arranged financing for nearly 2 GW of offshore wind capacity and has worked with international banks, development finance institutions, and export credit agencies.
Its portfolio includes several major European and Asian offshore wind projects:
Butendiek (288 MW)
Nordergründe (111 MW)
Yunlin (640 MW)
Fécamp (500 MW)
Calvados (450 MW)
As part of Global Infrastructure Partners (GIP), Skyborn combines technical offshore wind expertise with access to large-scale infrastructure investment.
Adam Thomsen, Chief Development Officer of Skyborn Renewables, said:
“This agreement with Amazon marks a defining milestone for Gennaker and Skyborn. As our blueprint project, Gennaker demonstrates how large-scale offshore wind can be delivered in a reliable, scalable way. It also reflects the growing need to connect renewable electricity generation with robust and forward-looking infrastructure that enables a resilient energy system. I am extremely proud of our teams to make this happen.”
€3 Billion Investment Supports Local Jobs and Industry
Beyond clean electricity, Gennaker represents one of the largest industrial investments ever made in Mecklenburg-Western Pomerania.
The project will inject around €3 billion into the regional economy while supporting German manufacturing and skilled employment.
The press release further highlights that a key contract has already been awarded to EEW Special Pipe Constructions GmbH (EEW SPC) in Rostock. The company will manufacture the monopile foundations used to support the offshore turbines.
Since EEW SPC employs roughly 1,000 workers, the contract helps secure existing jobs while strengthening Germany’s offshore wind supply chain close to the project site.
Amazon Continues Expanding Its Renewable Energy Portfolio
Globally, Amazon has built one of the world’s largest corporate renewable energy portfolios. And the Gennaker agreement becomes the biggest contract in Germany.
The company now supports 12 renewable energy projects across Germany with a combined capacity exceeding 1.3 GW.
Once all projects become operational, they are expected to produce enough carbon-free electricity to supply the equivalent of more than 1.8 million German homes each year.
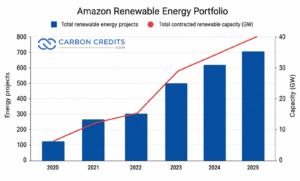
Globally, it has invested in more than 700 carbon-free energy projects, representing over 40 GW of generating capacity. That amount of electricity could power approximately 12.1 million U.S. homes annually.
Source: Amazon
Commitment to The Climate Pledge
These investments form part of Amazon’s commitment under The Climate Pledge, which the company co-founded in 2019. The initiative targets net-zero carbon emissions across Amazon’s operations by 2040, ten years ahead of the Paris Agreement timeline.
Amazon has also pioneered corporate renewable energy procurement in countries including India, Ireland, South Africa, Japan, and Indonesia, helping developers finance utility-scale clean energy projects.
Offshore Wind Becomes a Strategic Priority
Amazon has emerged as the world’s leading corporate purchaser of offshore wind power.
Across Europe, the company now supports nearly 1.7 GW of offshore wind capacity through six projects. Once fully operational, these wind farms are expected to generate enough electricity to power about 1.8 million European homes.
One milestone came last year when the Amazon-Shell HKN Offshore Wind Project off the Dutch coast entered commercial operation. The project delivers more than 750 MW of renewable electricity.
Amazon is also working with developers to improve turbine technology, helping increase electricity generation and improve project efficiency.
According to the United Nations, offshore wind has the technical potential to provide more than one-third of global electricity demand, making it a critical technology for long-term decarbonization.
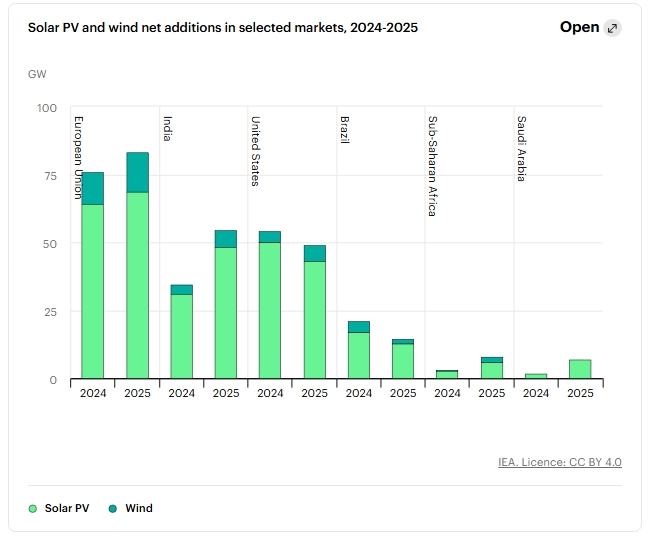
IEA revealed that in 2025, the European Union added nearly 85 GW of new renewable capacity, of which ~ 15 GW was wind energy.
Source: IEA
Germany Faces a Challenging Path to Offshore Wind Targets
Although Germany continues expanding renewable electricity, offshore wind deployment still lags behind official goals.
As per reports, the country aims to increase renewable energy’s share of electricity generation from just over 57% in 2025 to 80% by 2030, with a fully greenhouse gas-neutral electricity system targeted by 2045.
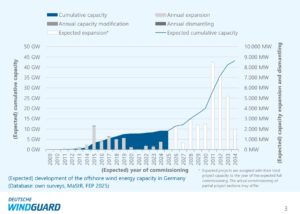
At the beginning of 2026, Germany had 1,680 offshore wind turbines operating in its territorial waters, providing around 9.7 GW of installed capacity.
Reaching the government’s 30 GW target by 2030 would require installed capacity to more than triple within five years.
Progress has remained slower than expected. During 2025, only 41 new offshore turbines, totaling 0.5 GW, were connected to the grid. Industry groups, therefore, estimate Germany may reach only around 20 GW of offshore wind capacity by the end of the decade unless project development accelerates significantly.
Still, offshore wind continues gaining importance. It supplied 6.2% of Germany’s electricity in 2025, a dramatic increase from only 0.1% in 2014, despite weaker wind conditions reducing generation during part of the year.
The government has maintained long-term expansion goals of 40 GW by 2035 and 70 GW by 2045, even as policymakers review near-term capacity plans in response to slower electricity demand growth.
Investor Confidence Depends on Policy Stability
Projects like Gennaker highlight how corporate power purchase agreements can unlock billions of euros in renewable energy investment. However, private financing alone will not determine Germany’s offshore wind future.
Investor confidence also depends heavily on consistent government policies, predictable permitting processes, and continued support for offshore wind deployment. Although the sector has achieved significant cost reductions over the past decade, developers still face high upfront investment costs, supply chain pressures, and lengthy approval timelines.
If Germany maintains a stable policy framework while attracting more long-term corporate buyers like Amazon, projects such as Gennaker could accelerate offshore wind deployment, strengthen domestic energy security, create thousands of skilled jobs, and move the country closer to its climate and net-zero goals.
Gold has long been seen as the top safe-haven investment. Platinum, however, is gaining attention for its growing role in the global energy transition. Once used mainly in catalytic converters and jewelry, platinum is now essential for hydrogen technologies, advanced manufacturing, and other clean-energy applications.
More industries now rely on platinum, supporting its long-term outlook despite price swings in 2026 and limited supply growth.
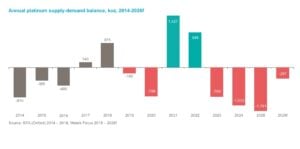
According to the World Platinum Investment Council (WPIC) report, the platinum market recorded its first quarterly surplus in six quarters during the first quarter of 2026. The surplus was mainly due to higher mine production and weaker investment demand.
But before we dive into the market dynamics, let’s understand what platinum is and why it is important for the energy transition.
What Is Platinum?
Platinum is a rare, naturally occurring precious metal known for its durability, corrosion resistance, and excellent catalytic properties. It belongs to the platinum group metals (PGMs), which also include palladium, rhodium, iridium, ruthenium, and osmium.
The metal is mined primarily in South Africa, which accounts for roughly 70% of global production, followed by Russia and Zimbabwe. Because platinum deposits are geographically concentrated, securing reliable supplies has become a growing concern as clean energy industries expand.
For decades, platinum’s biggest market was the automotive sector, where it is used in catalytic converters to reduce harmful emissions from gasoline, diesel, and hybrid vehicles. Today, its applications are expanding well beyond transportation
Why Platinum Is Becoming a Critical Energy Transition Metal
Few metals occupy as many strategic industries as platinum.
Unlike gold, whose value is driven primarily by investment demand, or copper, which is closely linked to construction and electrification, platinum supports a remarkably broad range of applications.
Although the automotive industry has historically been the largest consumer of platinum, the metal is now widely used in:
petroleum refining
chemical production
glass manufacturing
electronics and semiconductors
medical devices
low-carbon energy technologies
Its unique physical and chemical properties explain this versatility.
The metal resists corrosion and performs well even in extreme temperatures. It also acts as a highly effective catalyst, speeding up chemical reactions without being consumed. As a result, many industries rely on it for processes that require high performance, durability, and purity.
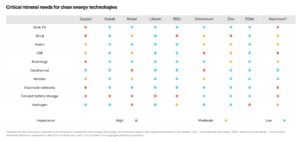
Today, its uses go beyond traditional industrial applications. As countries work toward net-zero emissions, demand for the metal is growing across clean energy technologies, especially hydrogen.
Because of its expanding role in the energy transition, many experts now view platinum as a strategic transition metal rather than just another precious metal.
Fueling the Hydrogen Economy
One key opportunity for platinum is in the growing hydrogen economy. Hydrogen will help cut emissions in steelmaking, chemicals, shipping, and heavy transport.
PEM Electrolyzers
Platinum acts as a catalyst in proton exchange membrane (PEM) electrolyzers. These devices use renewable energy to split water into hydrogen and oxygen. The IEA reports that current PEM systems need about 0.3 kilograms of platinum for each megawatt (MW) of capacity.
Source: IEA
Green hydrogen produced with platinum-enabled electrolyzers can replace fossil fuels in steelmaking, fertilizer production, chemical manufacturing, and oil refining. These industries account for a significant share of global carbon emissions and are among the hardest to decarbonize.
Hydrogen Fuel Cells
Platinum is also essential for hydrogen fuel cells, which produce electricity by combining hydrogen and oxygen. While battery-powered cars are becoming more common, hydrogen fuel cells are better suited for heavy vehicles such as trucks, buses, trains, ships, and mining equipment. They offer longer driving ranges and faster refueling, making platinum an important metal for cleaner transportation with zero tailpipe emissions.
Countries like China, Japan, South Korea, Germany, and the U.S. are investing in hydrogen infrastructure. So, platinum is likely to benefit from this trend.
The platinum market entered 2026 on the back of one of its strongest rallies in decades. A combination of persistent supply deficits, recovering industrial demand, and growing optimism surrounding hydrogen technologies had pushed prices sharply higher throughout 2025.
A Temporary Surplus Masks a Tight Physical Market
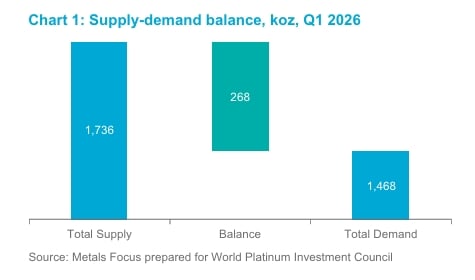
According to WPIC, total platinum supply increased 18% year over year to 1.736 million ounces (1,736 koz). The improvement was largely driven by a recovery in South African mining operations after severe flooding disrupted production during 2025.
Refined mine output increased 20% to 1.320 million ounces, while overall mine production rose 22% compared with the same period a year earlier.
Recycling also contributed to a higher supply. Elevated platinum prices encouraged greater recovery of spent automotive catalytic converters, lifting recycled supply 7% to 416,000 ounces.
Source: WPIC report
Demand Shifts in the First Quarter
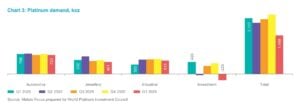
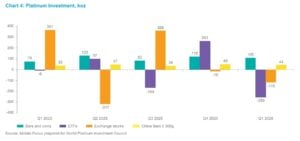
Total platinum demand reached 1.468 million ounces in the first quarter of 2026. Industrial demand remained strong, but investment demand fell sharply. Investors withdrew about 225,000 ounces from platinum investment products, reversing much of the heavy buying seen in 2025.
As a result, the market recorded a 268,000-ounce surplus, compared with a 658,000-ounce deficit in the first quarter of 2025. This was the first quarterly surplus in six quarters.
However, this does not mean the market has too much platinum. The surplus was mainly caused by two temporary factors: higher mine production after earlier disruptions and heavy selling by investors. These are not expected to permanently increase platinum supply.
By the end of the quarter, investor sentiment had weakened. Many investors reduced their holdings, platinum prices fell from their record highs, and the market moved into a temporary surplus.
Annual Supply Growth Remains Constrained
Platinum production bounced back in the first quarter, but its long-term supply outlook is still troubled.
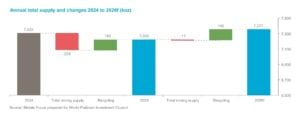
WPIC predicts a modest 2% increase in total platinum supply by 2026, reaching 7.377 million ounces. Mine production, the main source, is expected to stay nearly the same at 5.551 million ounces.
The report notes a 297,000-ounce deficit for 2026, marking the fourth straight year where demand outstrips supply.
Additionally, above-ground inventories are set to drop below three months of annual demand, making the market more sensitive to future supply issues.
Platinum production is different from many industrial metals. About 70% of the world’s supply comes from South Africa. This focus on one area makes the market weak. It can face issues like electricity shortages, labor strikes, aging infrastructure, declining ore grades, and operational delays.
The first quarter showed both the strength and weakness of this supply chain.
Industrial Demand Continues to Diversify
Although investment demand is expected to slow in 2026, platinum’s industrial demand continues to grow, making the market less dependent on investors.
WPIC forecasts total platinum demand of 7.674 million ounces in 2026, down 9% from 2025. However, this decline is mainly due to a 54% fall in investment demand following last year’s unusually strong buying.
Key Drivers
Industrial Demand: In contrast, industrial demand is expected to increase by 9%, highlighting platinum’s expanding role in the global economy.
Artificial Intelligence: The rapid expansion of AI is also creating new demand. As companies invest in semiconductor factories and precision manufacturing, platinum-group metals are becoming increasingly important in chip production.
Traditional Demand Remains Resilient
Automotive: Automotive demand is expected to fall by only 2%. Demand remains strong because hybrid and petrol/diesel vehicles are still being produced. Car makers are also replacing more expensive palladium with platinum in catalytic converters.
Jewellery: Jewellery demand is expected to decline by 12% because consumers are spending less. However, jewellery now makes up a smaller share of platinum demand as more industries are using the metal.
Regional Production Trends Highlight Supply Risks
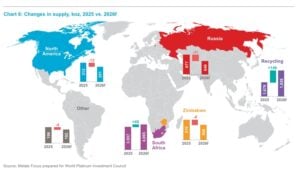
South Africa: Following widespread flooding during early 2025, South African operations recovered strongly. Refined production increased 41% year over year to 1.002 million ounces, supported by improved output from major producers.
Elsewhere, however, production remained under pressure.
Zimbabwe: It produced only 84,000 ounces, representing a 26% decline and the country’s weakest quarterly production in a decade due to scheduled furnace maintenance.
Russia: Production also declined 24% to 136,000 ounces, reflecting production scheduling rather than permanent mine closures.
These contrasting regional trends demonstrate how quickly gains in one jurisdiction can be offset by disruptions elsewhere. Because relatively few countries produce meaningful quantities of platinum, the global market has limited flexibility when operational problems occur.
Recycling is therefore becoming increasingly important.
Higher platinum prices encouraged additional recovery of automotive catalytic converters during the first quarter, increasing recycled supply to 416,000 ounces. WPIC expects recycling to rise 9% during 2026, reaching approximately 1.826 million ounces.
Even so, recycling alone cannot eliminate the supply deficit. Developing new platinum mines requires years of exploration, permitting, and infrastructure investment, making it impossible for supply to respond quickly to rising demand.
Platinum Prices React to the Iran Conflict
The biggest factor affecting platinum prices in early 2026 was investor sentiment, not industrial demand.
After rising 127% in 2025, platinum prices reached a record US$2,000 per ounce in January 2026.
Investors were optimistic because of supply shortages and growing demand from hydrogen technologies.
However, sentiment changed when tensions between Iran and Israel increased in late February.
Instead of buying precious metals, investors focused on rising oil prices and inflation. Brent crude oil prices rose 55%, increasing expectations that interest rates would stay higher for longer. Higher interest rates make non-yielding assets like platinum less attractive because investors can earn better returns from bonds.
As a result, platinum prices fell 16%, while gold dropped 13%. Many investors also sold platinum to lock in profits after its strong rally in 2025.
Currently, platinum is priced at USD 1,685.00 per ounce.
Despite the price decline, industrial demand remained strong. The sell-off was mainly driven by investor behaviour, while the physical platinum market continued to face tight supply.
Platinum investment varied across major markets in 2026, showing that demand is becoming more diversified around the world.
China: Remained the strongest physical investment market. Bar and coin investment rose 42%, supported by growing interest in hydrogen technologies and advanced manufacturing. The launch of platinum futures on the Guangzhou Futures Exchange in late 2025 also improved trading and price discovery.
Japan: Continued to see steady investment. ETF holdings increased by around 31,000 ounces, while net investment reached 21,000 ounces, reflecting strong long-term investor confidence.
India: Recorded the fastest growth, with bar and coin investment surging 226% as investors looked beyond gold and became more aware of platinum’s industrial uses.
United States: Followed a different trend. Many investors took profits after platinum’s record rally, while higher interest rates encouraged investment in assets that generate regular income.
These regional differences show that platinum investment is becoming more global, with growing demand from Asia helping reduce reliance on Western markets.
A Strategic Metal for Net Zero
As governments invest in hydrogen infrastructure and cleaner industrial technologies, platinum is evolving from a precious metal into a strategic material for the energy transition. However, supply remains concentrated in a few countries, mining faces operational challenges, and platinum is relatively expensive. Expanding recycling and developing more efficient catalysts will therefore be important to meeting future demand.
While batteries will drive much of the clean energy transition, platinum will remain essential for hydrogen production, fuel cells, industrial decarbonization, and emissions control. As the hydrogen economy expands, the metal is expected to play an increasingly important role in building a low-carbon future.
The global carbon market is entering a new era. Investors, corporations, and regulators are no longer satisfied with projects built mainly around future credit issuance and long validation timelines.
Concerns over verification, permanence, transparency, and financing gaps are reshaping expectations across the voluntary carbon market toward a broader question:
What does a more durable and financeable natural capital model look like?
That shift is driving a new generation of land-based climate projects that combine reforestation, biomass, biochar, sustainable land management, and long-term land care into diversified operating businesses.
KARBNZ Global is positioning itself at the center of this transition.
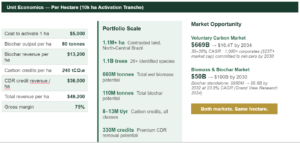
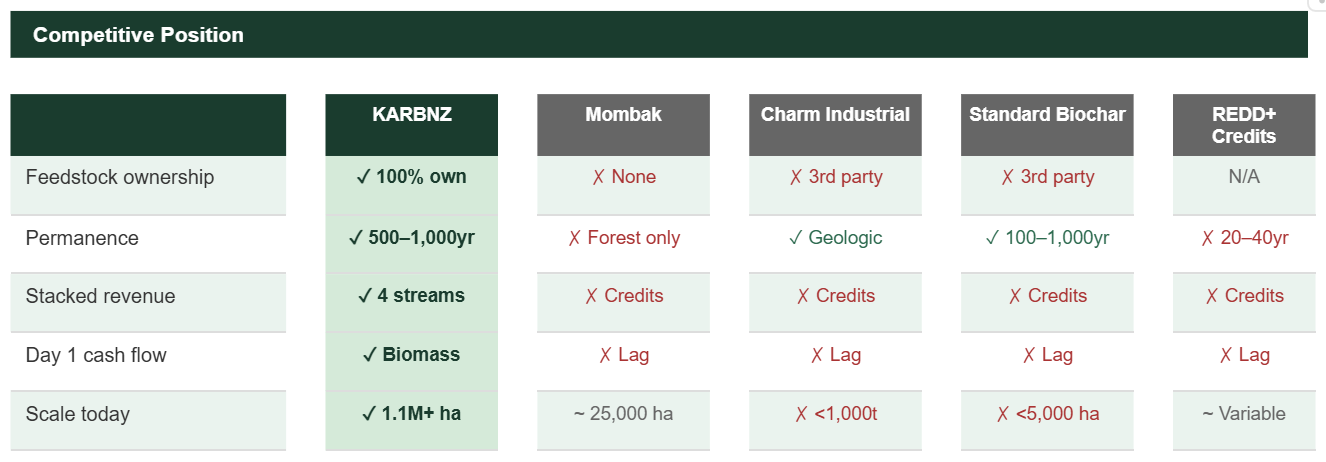
According to the company, KARBNZ’s platform currently spans more than 1.1 million hectares in Brazil, creating the scale necessary to integrate reforestation, biomass production, biochar carbon removal, and ARR (Afforestation, Reforestation, and Revegetation) carbon credits into a single natural capital platform.
Rather than relying solely on future carbon credits, KARBNZ is building multiple pathways to generate value from restored and sustainably managed forests.
Why Carbon Markets Are Evolving
Traditional carbon projects often require years before generating revenue. Developers must secure land rights, complete environmental studies, establish carbon baselines, and navigate complex verification requirements before credits may be issued.
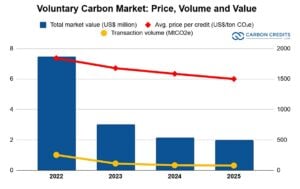
At the same time, increased scrutiny around older offset projects, particularly avoidance-based methodologies, has made carbon credit buyers more selective. According to Ecosystem Marketplace, the voluntary carbon market declined from around $1.9 billion in 2022 to about $535 million in 2024, and even further down in 2025, as demand shifted to higher-quality projects.
The challenge is no longer simply creating carbon credits. It is building climate businesses that can thrive long before credits are issued.
Biochar Is Emerging as a Major Growth Market
A central component of the KARBNZ strategy is biochar.
Biochar is produced by heating biomass such as forestry residues or agricultural waste in a low-oxygen process called pyrolysis. The process makes a stable, carbon-rich material. This material can store carbon for hundreds to thousands of years. It also boosts soil quality and helps with water retention.
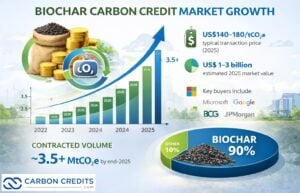
The market for biochar is expanding quickly. According to Carbonfuture and CDR.fyi, biochar represented 86% of all durable carbon dioxide removal deliveries in 2024, making it the largest durable carbon removal solution today.
Corporate demand is also accelerating. Reuters reported that durable carbon removal purchases rose from about 8 million metric tons in 2024 to around 25 million metric tons in 2025. However, issued supply remains below 1 million tons, highlighting a major supply gap for high-quality removals.
KARBNZ says it plans to integrate biochar production directly into its forestry and land management, converting biomass that would otherwise be treated as waste into a high-value climate asset.
The company estimates its biochar operations could ultimately remove about 2.57 million tons of CO₂e annually, positioning KARBNZ among the larger emerging biochar developers globally if those targets are achieved.
Source: KARBNZ Global
Creating Revenue Before Carbon Credits
Another distinguishing feature of the KARBNZ model is its focus on generating earlier revenue streams.
Activities such as forest thinning, biomass collection, firebreak creation, and forest health management not only strengthen ecosystems but also produce commercially valuable biomass feedstock.
Source: KARBZN Global
Global demand for biomass energy continues to grow as countries look for alternatives to coal and other fossil fuels. According to the International Energy Agency (IEA), modern bioenergy currently provides about 55% of global renewable energy consumption.
Wood pellets are now a key global commodity, especially in Europe and Asia. Utilities are moving to lower-carbon fuel sources. The global wood pellet market was valued at more than $14 billion in 2024 and is projected to continue growing through the decade.
Brazil plays a major role in this sector. The Brazilian Tree Industry (Ibá) reports that Brazil has over 10 million hectares of planted forests and is one of the top exporters of forest products globally.
KARBNZ says biomass generated through sustainable land management may support biomass energy, wood pellets, and biochar production. This provides the company with several possible revenue streams as carbon projects move through development.
KARBNZ believes this diversified approach provides investors with something increasingly valuable: tangible operating assets rather than a business model dependent solely on future carbon credit issuance.
The company also emphasizes local economic development through job creation, infrastructure investment, energy access, and long-term regional partnerships.
Natural Capital Is Becoming an Institutional Asset Class
Climate finance is becoming more disciplined. Investors increasingly expect stronger governance, transparent reporting, and robust monitoring systems before committing capital.
KARBNZ says its platform is being built with institutional standards in mind, including project-level SPVs, Verra-aligned ARR methodologies, and advanced MRV (Monitoring, Reporting, and Verification) systems.
According to the company, its MRV architecture will incorporate satellite monitoring, AI-driven analytics and blockchain tracking to enhance transparency and auditability.
This reflects a broader industry trend. McKinsey has noted that scaling voluntary carbon markets will require stronger verification systems, higher integrity standards, and greater transparency.
Carbon credits alone are no longer enough. Investors increasingly want long-term businesses built around measurable environmental assets.
That institutional focus is also reflected in the company’s leadership structure. Managing Partner Pascal van Knijff leads land origination, local partnerships, and platform development, while Managing Partners Rich Neal and David Place focus on capital strategy, commercialization, investor readiness, and institutional execution.
What’s Next for KARBNZ
KARBNZ’s next phase is focused on execution. Near-term priorities include:
Advance carbon validation work,
Expand MRV partnerships,
Develop biomass and biochar agreements, and
Prepare projects for larger financing rounds.
The company is also developing project-level SPV structures designed to support long-term financing and operational scaling.
More broadly, KARBNZ represents a larger trend reshaping climate finance: the evolution from standalone carbon projects to diversified natural capital platforms.
The future of climate investing may not be built on carbon credits alone. It may be built on integrated systems that combine forests, biomass, biochar, technology, and long-term land stewardship into durable, investable assets.
For KARBNZ Global, the opportunity is larger than issuing credits. It is demonstrating that large-scale ecological restoration can become an institutional asset class—one capable of delivering environmental impact, diversified revenues, and long-term value creation.
As demand for durable carbon removal and nature-based solutions continues to grow, companies that successfully combine restoration with financeable business models may define the next chapter of the natural capital economy. Organizations, investors, and strategic partners seeking exposure to this emerging asset class will be watching closely.
To provide the best experiences, we use technologies like cookies to store and/or access device information. Consenting to these technologies will allow us to process data such as browsing behavior or unique IDs on this site. Not consenting or withdrawing consent, may adversely affect certain features and functions.
Functional
Always active
The technical storage or access is strictly necessary for the legitimate purpose of enabling the use of a specific service explicitly requested by the subscriber or user, or for the sole purpose of carrying out the transmission of a communication over an electronic communications network.
Preferences
The technical storage or access is necessary for the legitimate purpose of storing preferences that are not requested by the subscriber or user.
Statistics
The technical storage or access that is used exclusively for statistical purposes.The technical storage or access that is used exclusively for anonymous statistical purposes. Without a subpoena, voluntary compliance on the part of your Internet Service Provider, or additional records from a third party, information stored or retrieved for this purpose alone cannot usually be used to identify you.
Marketing
The technical storage or access is required to create user profiles to send advertising, or to track the user on a website or across several websites for similar marketing purposes.