The International Organization for Standardization (ISO) has made a big move after years of debate on the meaning of “net zero.” They are working to create a single global net-zero framework.
This week, ISO launched a public consultation on ISO 14060, the world’s first international standard designed specifically for net-zero-aligned organizations. The standard aims to help companies create credible, verifiable, and science-based transition plans as they work toward net-zero emissions.
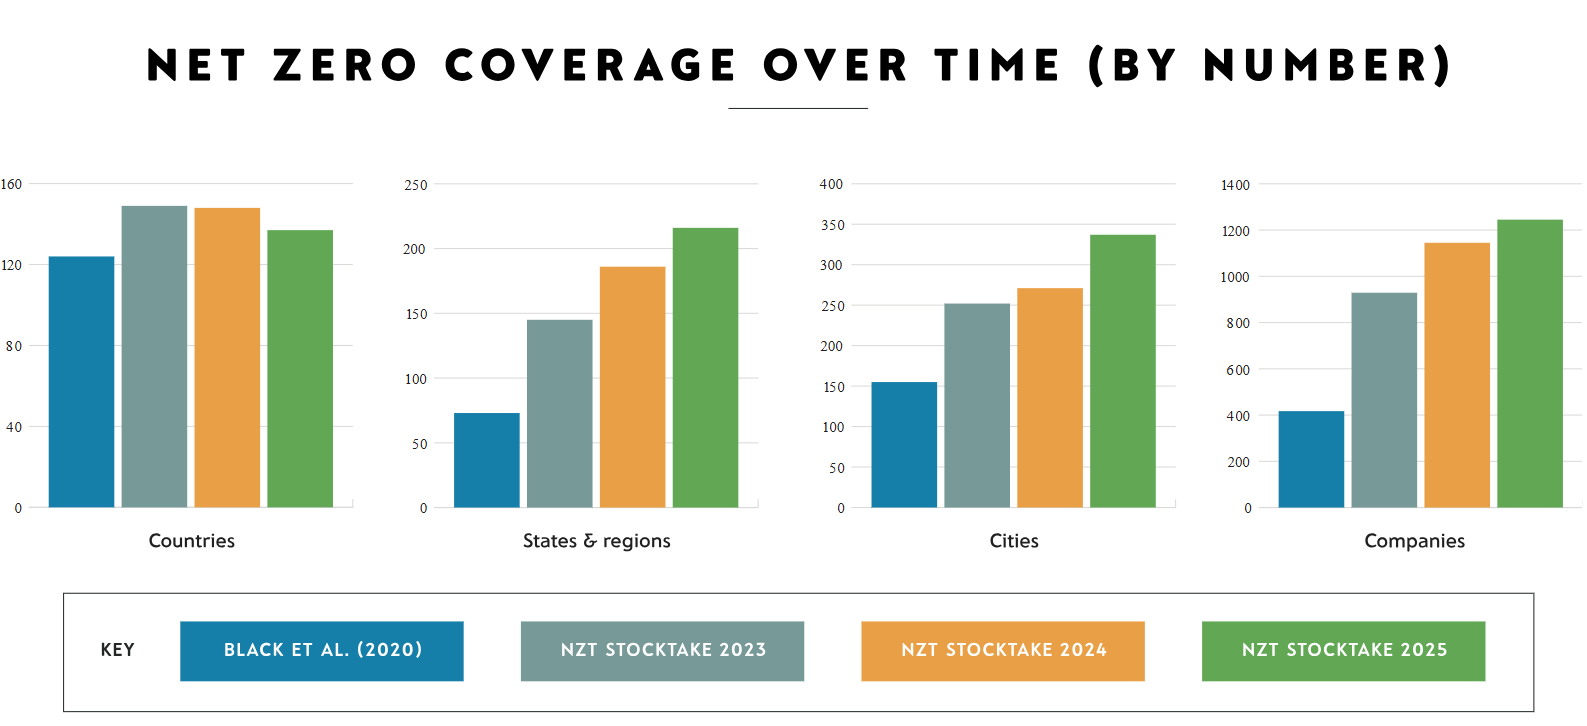
The move comes at a critical time. Net-zero commitments now cover 77% of global GDP, 74% of global emissions, and 79% of the world’s population, according to the Net Zero Tracker. Yet, many of these commitments vary widely in scope, reporting methods, and accountability mechanisms.
ISO hopes the new standard will help close that gap. The organization states that ISO 14060 will give a clear framework that will help all businesses align their strategies with net-zero goals. It will also boost transparency and accountability.
Noelia Garcia Nebra, Head of Sustainability and Partnerships at ISO, said:
“ISO 14060 has been developed to provide a globally agreed framework that helps organizations build credible transition plans while supporting resilience, innovation and long-term growth.”
The draft standard is now open for consultation across ISO’s network of more than 170 national standards bodies.
The Growing Demand for Credible Net Zero Claims
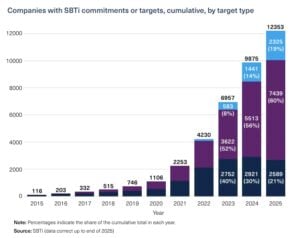
Net-zero commitments have expanded rapidly over the past decade. According to the Science-Based Targets initiative (SBTi), more than 12,000 companies worldwide have either set science-based emissions reduction targets or committed to doing so.
Source: SBTi
Together, these companies represent over $80 trillion in market capitalization. They also cover the vast majority of global GDP and greenhouse gas emissions.
However, climate experts have long warned that not all net-zero claims are equal. At the same time, concerns about greenwashing have increased.
A 2025 review by Net Zero Tracker found that while 63% of major firms have set net-zero targets, 31% lack public transition plans, interim targets, or clear disclosures on the use of carbon credits and offsets. And only 4% of those relying on nature-based removals have set transparent targets.
Source: Net Zero Tracker
Despite more companies having pledges, the findings highlight a persistent gap in minimum integrity standards and clear, actionable roadmaps.
ISO says one of the main goals of the new standard is to create a common understanding of what credible net-zero action looks like. The framework is expected to address emissions reductions, transition planning, reporting, governance, carbon removals, and verification.
The standard builds on ISO’s earlier Net Zero Guidelines (IWA 42). These guidelines were launched at COP27 in 2022. They were developed with input from over 1,200 experts in more than 100 countries.
The Shift From Climate Promises to Climate Plans
The timing of the new standard reflects a broader shift in the climate world. For years, organizations focused on announcing long-term targets.
Today, investors and regulators increasingly want evidence that those targets can actually be achieved. This has increased attention on transition plans.
A transition plan shows how a company will cut emissions, handle climate risks, invest money, and change its business model over time.
The new ISO standard helps organizations go beyond general climate promises. It guides them to create clear, structured plans that can be verified by others. The goal is to turn ambition into measurable action.
The pressure is growing. Companies face increasing disclosure requirements from regulators in Europe, North America, and Asia. Investors are also paying closer attention to climate-related risks and transition strategies.
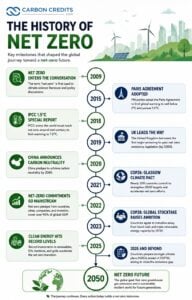
As a result, many organizations are looking for frameworks that provide consistency and credibility in setting and tracking net zero. Below is a quick historical illustration of how net zero came about.
Can ISO Bring Order to a Fragmented Climate Landscape?
One reason ISO 14060 is attracting attention is the growing complexity of the net-zero landscape. Today, organizations can follow guidance from:
These sources help shape their sustainability efforts. While these frameworks often share similar goals, differences in definitions and reporting requirements can create confusion.
The reporting burden continues to grow. The International Federation of Accountants (IFAC) says companies now deal with many climate-related disclosure rules. These rules vary by location, standards, and frameworks.
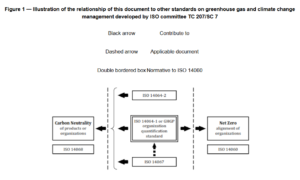
ISO developed its Net Zero Guidelines to help unify the fragmented landscape. They offer a common reference for organizations around the globe. The new standard is expected to build on that foundation and create a framework that can be independently verified.
Source: ISO
This is especially important for multinational companies. They operate in various countries and must follow different climate reporting rules.
A common global standard may help simplify compliance while improving confidence in corporate climate claims.
The new standard could also influence carbon markets. A major challenge for carbon credits and carbon removals is the uncertainty about their use in net-zero strategies.
Many organizations support the idea that emissions reductions should come first. However, there is ongoing debate about the role of carbon credits, removals, and offsets in reaching climate goals.
ISO’s earlier Net Zero Guidelines included guidance on emissions reductions, removals, offsets, credits, and claims. The new standard should clarify how these tools align with credible net-zero pathways. That could have important implications for VCMs.
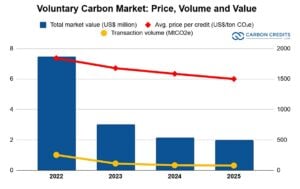
The voluntary carbon market has faced scrutiny in recent years over quality concerns and inconsistent standards. This led to a decreasing volume of transactions in the market, as seen below. Greater alignment around net-zero planning may help improve confidence among buyers and investors.
It can also meet the rising need for high-quality carbon removal projects as organizations search for ways to tackle emissions that are hard to cut.
The Hard Reality Behind Corporate Decarbonization
The need for credible climate action remains urgent. According to the International Energy Agency (IEA), global energy-related carbon dioxide emissions reached a record 37.4 billion metric tons in 2024 and rose to 38 billion metric tons in 2025.
At the same time, global temperatures continue to rise, and climate-related risks are increasing across many sectors.
Notably, many companies have already made progress. Major corporations such as Microsoft, Google, Apple, and Unilever have invested heavily in renewable energy, energy efficiency, supply chain decarbonization, and carbon removal initiatives. Yet, reducing emissions across complex global operations remains difficult.
For many organizations, Scope 3 emissions from suppliers, transportation, and product use account for the majority of their carbon footprints. This is why businesses are looking for clear and practical climate planning frameworks.
ISO believes the new standard helps organizations face those challenges. It also strengthens resilience, manages risks, and supports long-term growth.
A New Chapter for Global Net Zero Governance
The launch of ISO 14060 marks an important moment in the evolution of corporate climate action. It shows that climate conversation is shifting from ambition to execution. Investors, regulators, customers, and employees increasingly want proof that net-zero commitments can be achieved.
ISO’s new standard aims to provide a common language and a shared framework for organizations around the world. If widely adopted, it could help bring greater consistency, transparency, and credibility to climate action at a time when accountability matters more than ever.
The consultation process is expected to continue over the coming months before the standard moves toward final approval. Once completed, ISO 14060 could become one of the most influential climate standards ever developed.
BYD is making major moves across the global clean energy market. The Chinese company is speeding up its expansion into Europe and also helping to build the largest battery storage facility in the Americas.
These developments occur when BYD’s stock has faced pressure from slowing profit growth, intense competition in China’s electric vehicle (EV) market, and concerns about pricing. Yet the company’s latest projects suggest it is pursuing a much bigger strategy than vehicle sales alone.
Today, BYD is emerging as a global player across electric vehicles, battery manufacturing, renewable energy, and energy storage.
The company’s growing footprint reflects broader trends reshaping the energy transition. Demand for EVs continues to rise worldwide, while grid operators are investing heavily in battery storage to support growing amounts of solar and wind power.
Against this backdrop, BYD is positioning itself at the center of two of the fastest-growing clean energy markets.
Europe: BYD’s Most Important Battleground
Europe is becoming one of BYD’s most important international markets. The company plans to begin production at its first European passenger vehicle factory in Hungary during the fourth quarter of 2026. The facility could help BYD grow its local manufacturing. It will also lower tariffs on imports of Chinese-made EVs.
The move comes as BYD’s European sales continue to surge. It sold nearly 188,000 vehicles across Europe in 2025, a jump of about 270% from the previous year. Sales growth stayed strong in 2026. Registrations climbed about 144% year-over-year through May, surpassing 100,000 vehicles.
Source: Electric-Vehicles.com
The expansion reflects the growing importance of the European EV market. The International Energy Agency (IEA) reports that global electric car sales topped 17 million in 2024. This means over 20% of all new cars sold worldwide were electric. The agency expects EV adoption to continue growing as battery costs decline and governments strengthen emissions policies.
Europe remains one of the largest EV markets globally. However, competition is intensifying as Chinese manufacturers gain market share and challenge established automakers.
For BYD, local production could help strengthen its position in the region while supporting long-term growth.
A Record-Breaking Chile Project Showcases BYD’s Battery Power
While BYD is best known for electric vehicles, energy storage is becoming an increasingly important part of its business. That strategy received a major boost with the inauguration of the Elena battery storage project in Chile’s Atacama Desert.
The facility can store 3.5 gigawatt-hours (GWh) of energy. This makes it the largest battery energy storage system in the Americas.
Grenergy, a Spanish renewable energy company, developed the project. It uses 6,240 battery modules from BYD, all stored in 624 containers.
The scale is significant. This battery system can store enough electricity to power hundreds of thousands of homes during peak demand. It all depends on local consumption patterns.
The Elena project’s launch increases BYD’s total battery supply to the Oasis de Atacama development to 6.5 GWh. In March, Grenergy signed another agreement with BYD for 2.6 GWh of battery storage for the Central Oasis project in central Chile.
The $900 million development is expected to begin operations between 2026 and 2027. Together, the two projects give BYD more than 9 GWh of contracted battery storage capacity in Chile. This shows the company’s expanding role in one of the world’s fastest-growing energy storage markets.
Why Batteries Are Becoming the Backbone of the Energy Transition
The timing of BYD’s energy storage expansion aligns with powerful global trends. As renewable energy deployment accelerates, demand for battery storage is growing rapidly.
Solar and wind generation can fluctuate depending on weather conditions and time of day. Battery systems help solve that challenge by storing excess electricity and releasing it when needed.
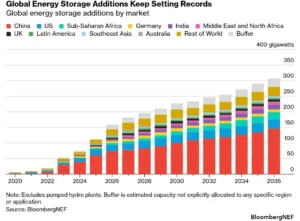
According to the International Energy Agency, global battery storage capacity surpassed 280 gigawatts (GW) in 2025. The IEA expects deployment to grow several times over by 2030 as countries invest in more flexible electricity grids. Bloomberg’s forecast also shows the same trend.
Energy storage is now considered a critical technology for achieving climate goals. The IEA estimates that global renewable energy capacity additions reached nearly 700 GW in 2024, the highest annual increase ever recorded. Much of that growth will require large-scale storage systems to maintain grid reliability.
Chile has become an important test case for this transition. The Atacama Desert receives some of the highest levels of solar radiation in the world. However, much of that solar power is generated during the day when electricity demand is lower.
Battery storage allows excess energy to be saved and delivered later, increasing the value of renewable generation. Projects like Elena show how batteries are becoming essential infrastructure for modern power systems.
From Electric Cars to Energy Systems: BYD’s Expanding Climate Vision
The company’s expansion also supports broader climate goals. BYD has become one of the world’s largest producers of electric and plug-in hybrid vehicles. The company sold approximately 4.6 million vehicles in 2025, making it one of the six largest automakers globally.
The EV giant stopped making regular gasoline-only cars in 2022 and is now focusing only on new energy vehicles. The company believes its vehicles have reduced carbon dioxide emissions by hundreds of millions of tons. This is a significant drop compared to traditional transportation.
At the same time, BYD continues to invest heavily in battery technology, manufacturing efficiency, and renewable energy integration.
Its battery business now serves both transportation and stationary energy storage markets. This dual strategy could become increasingly important as global electricity systems electrify and demand for clean energy infrastructure grows.
Investors’ Take: Why BYD’s Stock Trades Low
Despite these operational achievements, investor caution has intensified as BYD’s financial slowdown extends deep into 2026. The company faced its first annual profit decline in four years in 2025. Net profit dropped by 19% to 32.6 billion yuan (US$4.7 billion).
Automotive gross margins fell to 20.5%, and revenue growth slowed to a six-year low of 3.5%. This financial strain worsened significantly. BYD’s net profit fell by 55% year-on-year in the first quarter of 2026. A fierce price war drove this drop at home. It signals a harsh new “elimination phase” for the industry.
The results reflect the challenges facing China’s EV industry. Competition has intensified as manufacturers cut prices to defend market share. The resulting pressure has weighed on profitability across the sector.
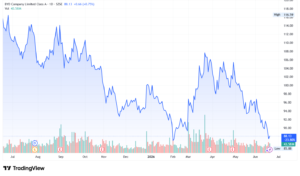
Investors are also watching how quickly BYD can translate strong international sales growth into sustainable earnings growth. As a result, the company’s shares have experienced periods of volatility and recently traded near their lowest levels in more than a year.
Analysts say BYD keeps investing heavily in manufacturing, exports, battery production, and energy infrastructure. This is despite short-term pressures.
A Broader Energy Company Is Taking Shape
BYD’s latest projects show how the company is evolving beyond electric vehicles. Its new factory in Hungary supports global EV growth, while the Chile battery project strengthens its position in energy storage.
The shift reflects a broader trend across the energy transition, where electric vehicles, batteries, renewable power, and electricity grids are becoming more connected.
BYD’s exports continue to grow, its European expansion is accelerating, and its battery storage business is reaching record scale. Despite investor concerns about short-term profitability, the company is increasingly positioning itself as a major clean energy player, not just an automaker.
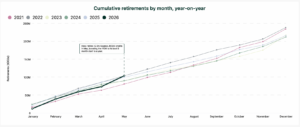
After several years of scrutiny, the voluntary carbon market (VCM) is showing signs of renewed strength. According to the latest H1 2026 report from AlliedOffsets, carbon credit retirements reached their strongest January-to-May performance on record.
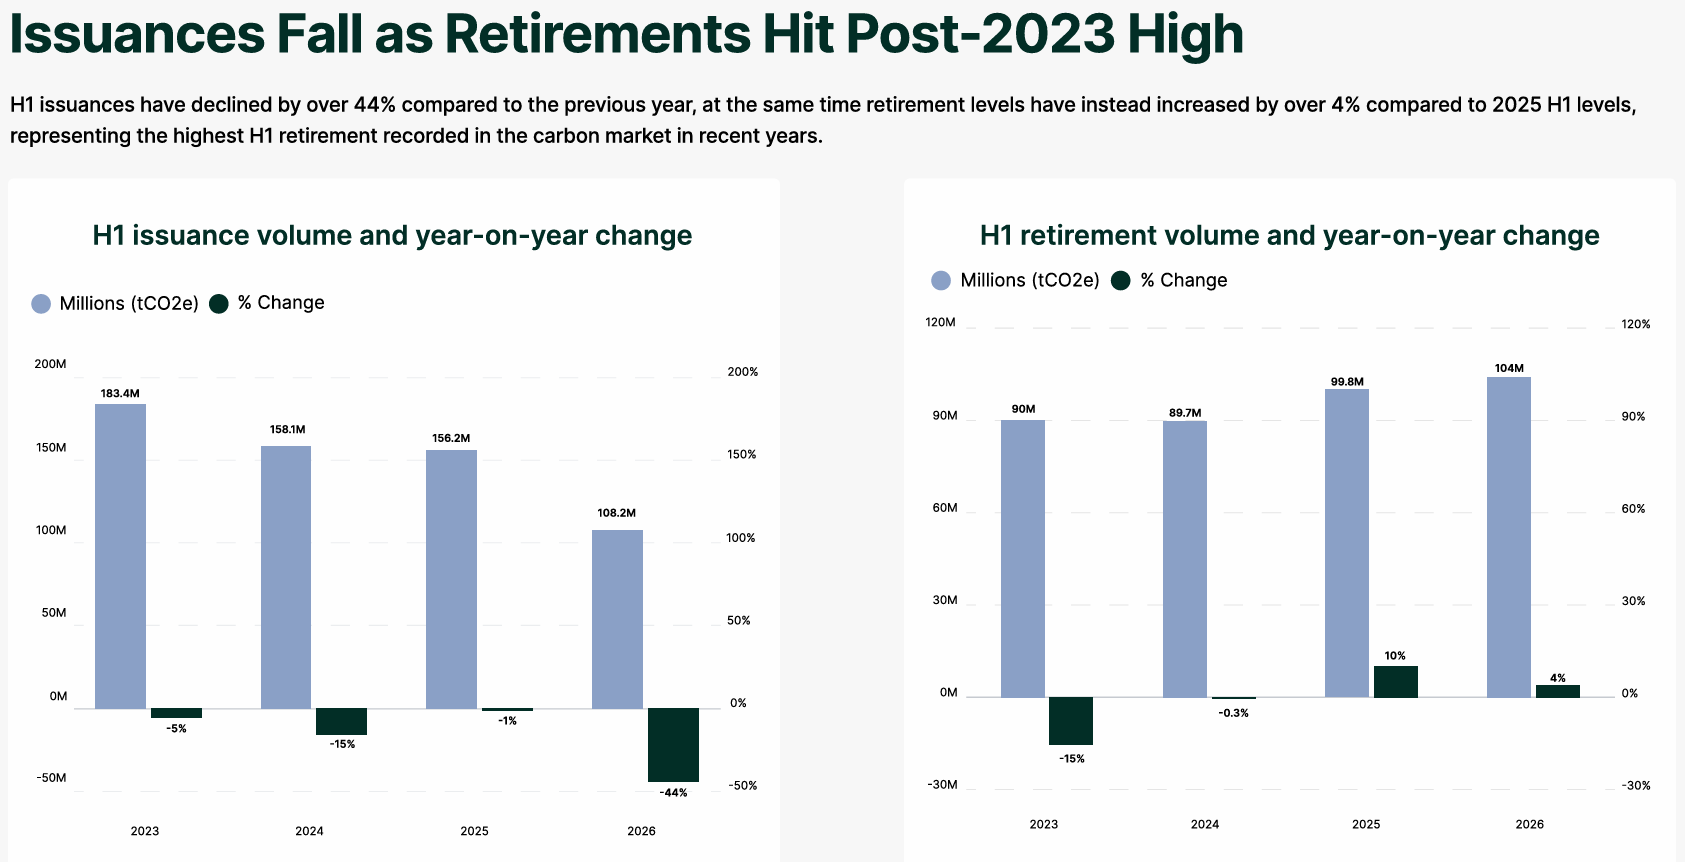
The numbers are notable because they come during a period of lower credit supply. In the first half of 2026, carbon credit issuances fell 44% year over year, but retirements went up 4%. This is the highest first-half retirement volume since AlliedOffsets started tracking the market.
A Rare Market Shift: Demand Is Rising While Supply Shrinks
The milestone shows the highest five-month start for the voluntary carbon market, which means buyers still use carbon credits. They do this even with ongoing debates about quality, regulation, and climate claims.
A major driver came in May, when Hess retired 12.5 million Guyana REDD+ credits. This helps push cumulative retirements to an all-time high for the January-May period.
Source: AlliedOffsets
The trend matters because retirements are widely viewed as one of the clearest indicators of real market demand. When companies retire credits, they permanently remove them from circulation and use them toward climate commitments. Unlike project announcements or future purchase agreements, retirements represent actual carbon market activity.
One of the most important findings from the report is that demand appears to be holding up despite a decline in new supply.
Global issuances dropped from 156.2 million credits in H1 2025 to 108.2 million in H1 2026. At the same time, retirements increased from 99.8 million to 104 million credits. This creates a very different market dynamic from previous years.
Source: AlliedOffsets
For much of the last decade, the carbon market struggled with excess supply. Large inventories often pushed prices lower and raised concerns about credit quality. Today, fewer new credits are entering the market while more credits are being retired.
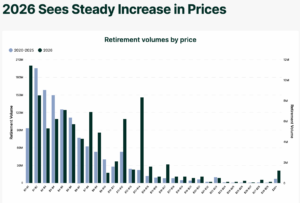
AlliedOffsets found that retirement volumes are increasingly occurring at higher price points. In 2026, buyers are more open to purchasing expensive credits. This is a change from past years when most retirements focused on cheaper credits.
That trend suggests a growing demand for higher-quality carbon projects rather than a race to secure the lowest-cost credits. Many companies now focus on stronger environmental integrity instead of just low-cost offsets. They want better verification and greater confidence in their climate impact.
Source: AlliedOffsets
This trend could help support pricing across the voluntary carbon market as demand increasingly favors quality over quantity.
New Buyers Are Entering the Market
The market is also becoming more diverse. Active buyer participation in 2026 has already exceeded previous years, says AlliedOffsets. However, overall transaction volumes are still below the record levels of 2025.
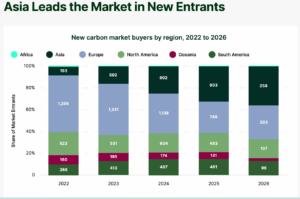
Asia has emerged as the fastest-growing source of new entrants.
The report shows that more companies entered the carbon market from Asia than from any other region in 2026. This growth has been supported by initiatives such as Singapore’s Action for a Resilient Climate (ARC) Coalition, which aims to procure at least 10 million tonnes of carbon credits by 2030.
Source: AlliedOffsets
The trend reflects broader changes in global climate policy.
Many Asian economies have strengthened emissions targets, launched carbon pricing systems, and increased participation in Article 6 carbon market mechanisms under the Paris Agreement. As a result, carbon market demand is becoming less concentrated in North America and Europe.
Carbon Removal Is Scaling—But Supply Still Can’t Keep Up
The carbon dioxide removal (CDR) market is also evolving, although growth remains uneven.
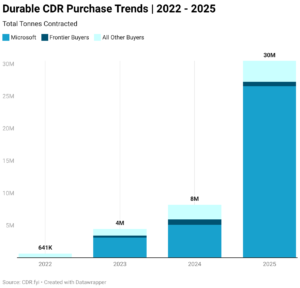
AlliedOffsets reports that cumulative CDR offtake agreements have reached approximately 48.5 million tonnes, compared with only about 2.65 million tonnes of issued credits since 2022. This means demand commitments remain roughly 18 times larger than actual delivered supply.
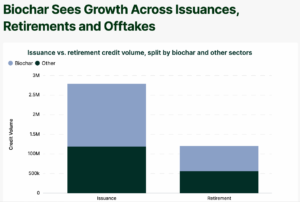
The pathway accounts for 57% of all-time CDR issuances and 53% of all retirements. Biochar has generated approximately 1.58 million credits out of 2.75 million total CDR issuances and remains the only removal technology delivering significant volumes across issuances, retirements, and offtake agreements.
Source: AlliedOffsets
Enhanced rock weathering is also gaining momentum. Offtake volumes increased from 10,000 tonnes in 2022 to 470,000 tonnes in 2025, while issuances continue to rise in 2026.
By contrast, direct air capture faces ongoing scale challenges. Although more than 2 million tonnes have been contracted, only about 0.1% has been issued to date. High costs, often ranging from $300 to $1,000 per tonne, remain a major obstacle.
Government policies are becoming increasingly important for market growth.
The Paris Agreement Crediting Mechanism (PACM), the successor to the Clean Development Mechanism, now has 22 registered projects and has issued its first credits in 2026.
The inaugural Myanmar cookstove project generated 58,428 credits, roughly 40% below previous CDM estimates. This highlights stricter accounting standards under the new framework.
At the same time, Article 6 markets continue to expand. Countries such as Singapore, South Korea, Vietnam, Chile, India, and Cambodia have strengthened their carbon market infrastructure and international trading frameworks.
The aviation sector is also preparing for greater carbon credit demand. AlliedOffsets estimates that only 37.9 million tonnes of CORSIA Phase 1-eligible supply currently exist. This is far below the projected airline demand of roughly 200 million tonnes.
If those demand projections materialize, high-quality credits could become increasingly valuable over the coming years.
The Market Is Moving From Quantity to Quality
One of the clearest themes emerging from 2026 is the shift toward quality. CCP-approved credit issuances increased 64% year over year in H1 2026, while issuances from rejected projects fell 67%. On the demand side, retirements of CCP-approved credits rose 18%. This suggests that buyers are becoming more selective.
Source: AlliedOffsets
The trend aligns with broader developments across the climate sector. Investors, regulators, and standard setters are placing greater emphasis on transparency, additionality, permanence, and verification.
Recent updates from the Science-Based Targets initiative (SBTi), the growing use of Article 6 mechanisms, and stronger integrity frameworks are all pushing the market toward higher standards.
A New Phase for Carbon Markets
The record retirement volumes seen in early 2026 suggest that the voluntary carbon market may be entering a new phase. Supply is tightening. Prices are rising.
More buyers are entering the market. Carbon removal technologies continue to mature. Governments are building new compliance frameworks. And companies pursuing net-zero goals are increasingly looking for higher-quality credits.
Challenges remain. Issuances have fallen sharply, removal supply remains limited, and policy uncertainty still affects some markets.
Yet, the latest data show that demand has not disappeared. In fact, buyers appear to be becoming more selective and more willing to pay for quality.
That shift could help shape the next chapter of global carbon markets as companies, investors, and governments work toward increasingly ambitious climate goals.
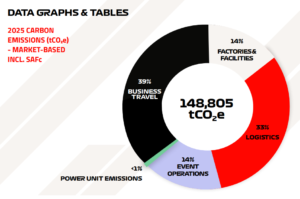
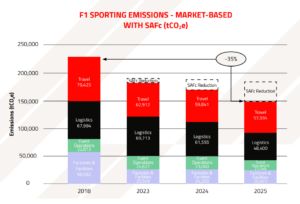
Formula 1 has reported a 35% reduction in its carbon footprint since 2018, putting the sport on track to achieve its Net Zero 2030 target. The latest figures show that emissions fell to around 148,800 tonnes of CO₂ equivalent (tCO₂e) in 2025, down from a 2018 baseline of 228,793 tCO₂e. The sport also reduced emissions by 12% compared with 2024 alone.
The update comes as the 2026 FIA Formula One World Championship is currently underway. Teams are competing across a 24-race global calendar that runs from March to December.
The season has already completed seven rounds and remains one of the most ambitious in the sport’s history. It features new regulations, expanded sustainability initiatives, and preparations for the introduction of 100% advanced sustainable fuels in 2026.
The achievement is notable because Formula 1 has continued to expand during the same period. Stefano Domenicali, President and CEO of F1, remarked:
“At Formula 1, we act and show our achievements through facts, not just words, and I am incredibly proud that we remain on track to achieve Net Zero by 2030, made possible by the collective effort across the sport to reduce our environmental impact.”
Since 2018, the race calendar has expanded from 21 to 24 events. Annual attendance jumped from 4 million to 6.5 million fans, and the sport’s global fan base now exceeds 826 million.
Despite that growth, F1 has removed nearly 80,000 tonnes of CO₂e from its operations. This suggests the sport is reducing emissions even as its global reach continues to grow.
Why Formula 1 Set a Net Zero Goal
Formula 1 launched its sustainability strategy in 2019 and committed to reaching net zero carbon emissions by 2030. The goal is not simply to offset emissions. F1’s strategy needs at least a 50% cut in emissions from its 2018 baseline. After that, any remaining emissions can be handled through credible carbon removal or offset programs.
The challenge is significant because racing itself contributes only a small share of Formula 1’s emissions.
According to the sport’s sustainability report, the largest sources come from logistics, travel, factories, facilities, and race operations. Moving cars, equipment, and people between continents each year leaves a big environmental mark.
Source: Formula 1
That challenge is becoming more important as global pressure grows for sports organizations to reduce emissions.
Sports-related emissions are drawing increasing attention from sponsors, investors, governments, and fans. Large international events like the ongoing 2026 FIFA World Cup often involve extensive travel, freight movement, energy use, and infrastructure requirements.
For Formula 1, reaching net zero has become both an environmental goal and a business priority.
Travel and Logistics Remain the Biggest Battleground
Travel has historically been one of Formula 1’s largest sources of emissions. The latest report shows that travel-related emissions have fallen by more than 21,000 tCO₂e since 2018, representing a 27% reduction. Several initiatives helped achieve this result.
One of the most important has been the increased use of sustainable aviation fuel (SAF). Formula 1 and its teams have doubled their SAF investments since 2024, says Ellen Jones, F1’s Head of ESG. This move has cut air charter emissions by about 40%, which is equal to 20,000 tCO₂e.
Source: Formula 1
SAF is becoming a key tool for industries that rely heavily on air travel. IATA says sustainable aviation fuel can cut lifecycle emissions by up to 80% compared to regular jet fuel. This reduction depends on the feedstock and how it’s made.
Formula 1 is also changing how it moves equipment around the world.
The sport is shifting more freight from air transport to sea and land transportation, which generally produce lower emissions. For the first time, lower-carbon solutions are now being used across all three major freight modes: air, sea, and land.
How Renewable Power Is Rewriting the Formula 1 Playbook
Another major source of emissions comes from factories, offices, and team facilities.
Formula 1 says emissions from these operations have fallen by more than 37,000 tCO₂e since 2018, representing a 64% reduction. Compared with 2024 alone, emissions dropped another 14%. Much of this progress comes from switching to renewable electricity.
Formula 1, its teams, and the FIA have expanded the use of renewable power across offices, technical centers, and manufacturing facilities. Several teams now source significant portions of their electricity from renewable energy.
This mirrors a broader trend across industries.
According to the International Energy Agency (IEA), renewable energy additions reached nearly 700 gigawatts globally in 2024, the largest annual increase ever recorded. Businesses are increasingly turning to renewable power as one of the fastest ways to reduce operational emissions.
For Formula 1, these changes have delivered some of the largest carbon reductions achieved so far.
Sustainable Fuels Could Become Formula 1’s Biggest Climate Legacy
One of Formula 1’s most ambitious projects will arrive in 2026. The sport plans to introduce 100% sustainable fuel for all next-generation hybrid race cars. The fuel is being developed with support from manufacturers, suppliers, the FIA, and energy partners.
The impact could extend far beyond racing.
The company says the fuel is designed as a “drop-in” solution that can work in many existing internal combustion engines. Supporters think this technology can cut emissions from almost 2 billion vehicles worldwide. It offers a way to improve the current fleet without needing immediate replacements.
Advanced sustainable fuels can reduce carbon emissions by approximately 85% to 96% compared with conventional fossil fuels, according to Formula 1.
Interestingly, race fuel itself accounts for less than 1% of Formula 1’s total emissions. The sport thinks the technology could impact the wider transportation sector. It may speed up the use of lower-carbon fuels. This aligns with a growing global market.
Industry forecasts predict that the sustainable aviation fuel market could grow from billions today to tens of billions annually in the next decade. Airlines are looking for alternatives to fossil fuels.
Sustainability Is Becoming a Competitive Advantage for Global Sports
Formula 1 is not alone in pursuing climate goals. Sports organizations worldwide are investing in sustainability programs as environmental performance becomes a bigger part of sponsorship, broadcasting, and brand value.
The global sports industry generates hundreds of billions of dollars annually and has a significant environmental footprint. Major leagues and event organizers increasingly face pressure to reduce emissions and improve sustainability reporting.
Formula 1’s latest results show that emissions reductions can occur alongside growth.
Since 2018, the sport has added more races, attracted more fans, and grown its audience. At the same time, it has cut emissions significantly. Formula 1’s analysis shows that without sustainability measures, its carbon footprint would have risen by about 10% during that time.
That makes the reported reductions particularly significant.
Four Years to Go: Is F1 Really on Track for Net Zero?
Formula 1 still has work to do before reaching its 2030 target. The sport must continue cutting emissions across travel, logistics, facilities, and race operations while managing future growth. It must also ensure that any remaining emissions are addressed through credible climate solutions.
However, the latest figures suggest that the strategy is working.
A 35% reduction since 2018, nearly 80,000 tonnes of emissions eliminated, a 64% cut in facility emissions, and a 27% drop in travel emissions all indicate measurable progress.
For Formula 1, the challenge has never been simply making race cars greener. The larger task has been reducing emissions across a global operation that moves people, equipment, and technology around the world every week.
With four years remaining until 2030, the sport appears closer than ever to proving that growth, performance, and emissions reductions can move forward together.
Artificial intelligence is causing a huge rise in computing demand. Today’s AI models already use a lot of electricity. The next generation of AI agents could need 10,000 to 40,000 times more computing power for each task than today’s chatbots, according to a new report from Wood Mackenzie.
This rapid growth is stressing power grids and data centers around the world. As electricity demand increases and suitable land becomes harder to find, some big tech companies are looking beyond Earth. They are exploring orbital data centers powered by constant solar energy in space.
The report explains why this futuristic idea is getting attention. It also points out a major challenge. Building an orbital data center is still much more expensive than one on Earth.
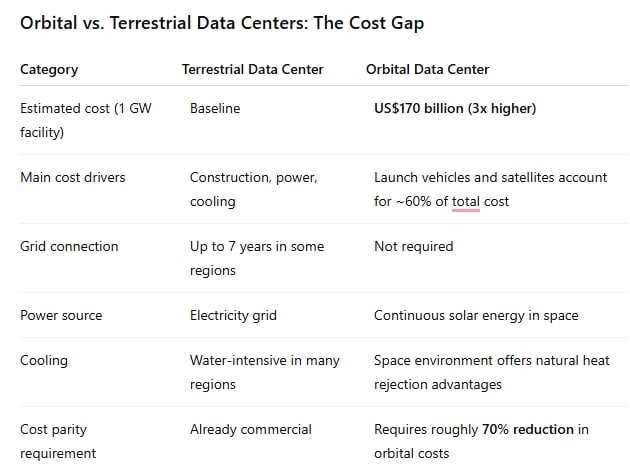
Currently, an orbital facility costs more than 3X as much as a similar data center on land, making it a long-term opportunity, not a short-term solution.
AI Is Pushing Data Center Power Demand to New Highs
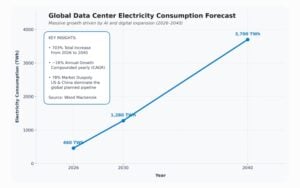
Wood Mackenzie estimates that global data centers will consume about 460 terawatt-hours (TWh) of electricity in 2026—roughly half of Japan’s annual electricity generation.
That figure is expected to rise dramatically:
2026: 460 TWh
2030: 1,280 TWh
2040: 3,700 TWh
That represents a 703% increase between 2026 and 2040, equal to an annual growth of around 16%. The United States and China dominate this expansion, accounting for nearly 78% of the world’s planned data center pipeline.
However, keeping all of those facilities on Earth is becoming increasingly difficult.
Source: Wood Mackenzie
Space Solves Many Problems—Except the Cost
Building large data centers has become far more complicated than it was just a few years ago.
Across the United States, developers often wait up to seven years to secure power grid connections. At the same time, gas turbines face delivery backlogs stretching through 2030, while many regions struggle with limited water supplies needed for cooling systems.
Additionally, construction costs are also higher because of higher labor and material prices. These challenges are encouraging companies to explore alternatives—including orbital data centers powered by uninterrupted solar energy in space.
Unlike terrestrial facilities, orbital data centers would avoid many of today’s infrastructure bottlenecks. They would not compete for land, freshwater, or overloaded electricity grids.
The challenge, however, is economics.
The Massive Price Tag of Orbital Data Centers
Wood Mackenzie estimates that building a hypothetical 1-gigawatt orbital data center would require around US$170 billion in investment.
More than 60% of that cost would come from launching equipment into orbit and building satellite infrastructure.
Source: Wood Mackenzie
According to Wood Mackenzie, orbital facilities would only become cost-competitive if launch costs continue falling at historical rates. The report estimates that total costs must decline by about 70% before space-based computing can compete with terrestrial infrastructure.
Jeff Bezos Says Cost Is the Only Real Barrier
The debate over orbital computing gained fresh attention after Jeff Bezos spoke at the VivaTech conference in Paris.
The Blue Origin founder argued that the science behind orbital data centers is largely solved. Instead, he believes economics remains the only major obstacle.
According to Bezos, future computing infrastructure could eventually be built using materials mined from asteroids, the Moon, and other space resources. Chips could even be manufactured in orbit using abundant solar energy before transmitting computing results back to Earth.
He has previously said two milestones are needed before orbital computing becomes practical:
Launch costs must fall by roughly tenfold.
Energy must become a much larger share of total data center operating costs.
Blue Origin is working toward both goals through its next-generation launch systems.
Bezos also emphasized a gradual approach to space development, arguing that building sustainable infrastructure around the Moon should come before more ambitious plans for Mars.
Market Potential
Despite today’s high costs, analysts believe orbital computing could become a major industry over the next decade.
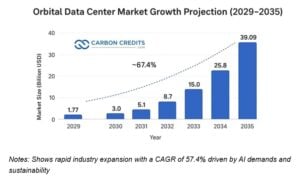
Analysts expect the orbital data center industry to grow from $1.77 billion in 2029 to $39.09 billion by 2035. This shows a remarkable compound annual growth rate (CAGR) of 67.4%.
Among companies pursuing orbital data centers, SpaceX appears to have the most ambitious plans.
Together with xAI, the company has announced a long-term goal of deploying 100 gigawatts of orbital computing capacity every year.
According to Wood Mackenzie, that target is roughly ten times larger than the combined announced pipeline of every other orbital data center developer worldwide.
Outside the United States, announced projects remain limited, totaling less than 0.5 GW of planned capacity. The report expects launch activity among leading developers to begin accelerating between 2027 and 2028, although commercial deployment remains several years away.
A Booming Space Economy Could Slash Orbital Computing Costs
Although orbital computing remains expensive, the broader space economy is advancing rapidly. Global orbital launch attempts climbed to 324 missions in 2025, up 25% from the previous year. Commercial companies carried out roughly 70% of those launches.
Meanwhile, reusable rockets have already reduced launch costs by approximately 90% compared with traditional expendable launch systems.
Satellite deployment is also accelerating. A record 4,517 satellites entered orbit during 2025, representing a 58% increase over the previous year. Nearly 87% were launched by private companies rather than governments.
These trends suggest that launch costs could continue falling over time, improving the economics of orbital infrastructure. And much of that growth depends on continued advances in reusable launch systems, satellite manufacturing, and lower transportation costs.
Despite the Hype, Orbital Data Centers Are Still a Long-Term Bet
Wood Mackenzie concludes that orbital computing remains a promising long-term technology rather than an immediate replacement for traditional data centers.
Space offers clear advantages, including abundant solar power, freedom from grid congestion, and reduced pressure on land and water resources. However, those benefits are currently outweighed by the enormous cost of getting computing infrastructure into orbit.
For now, the industry’s money is still flowing to Earth-based facilities.
The firm’s Research Director, Robert Liew, notes that the infrastructure challenges facing terrestrial data centers are real, but they are unlikely to shift investment away from the ground until launch costs fall dramatically.
Earth Remains the Main Investment Destination
While interest in orbital computing is growing, companies continue investing heavily in conventional data centers.
AI company Anthropic, for example, recently committed US$45 billion over three years to access SpaceX’s 300-megawatt Colossus 1 terrestrial data center, which will operate with 220,000 Nvidia GPUs.
Wood Mackenzie forecasts approximately US$9 trillion in cumulative investment between 2026 and 2040 to build nearly 395 GW of new terrestrial data center capacity.
That spending highlights where the industry still sees the strongest near-term opportunities.
Last but not least, in the coming decades, orbital data centers could become an important part of the AI ecosystem. Until then, they remain a bold vision whose success depends less on technology than on making space transportation dramatically cheaper.
Climate action starts with measurement. Before companies can reduce greenhouse gas emissions, achieve net-zero goals, or show sustainability progress to investors, they first need to understand where their emissions come from and how much they produce. This process is known as carbon accounting.
Once seen as a niche sustainability activity, carbon accounting has become a core business function.
The change has been significant. In 2024, more than 24,800 companies disclosed environmental data through CDP, representing over two-thirds of global market capitalization.
The number of reporting organizations has grown nearly fivefold over the past decade. This reflects the growing importance of climate transparency in business decisions.
Investors use emissions data to assess climate risks. Regulators increasingly require climate disclosures. Customers and stakeholders expect transparency. Companies also rely on carbon data to find opportunities to improve efficiency and reduce emissions.
In many ways, carbon accounting is becoming as important as financial accounting.
This guide explains what carbon accounting is, how it works, and why it matters. It also explores how new technologies like artificial intelligence (AI) are transforming how organizations track and manage their carbon footprints.
What Is Carbon Accounting?
Carbon accounting is the process of measuring, tracking, and reporting greenhouse gas (GHG) emissions produced by a company, product, service, or activity.
The goal is to create a complete emissions inventory and convert it into a common unit called carbon dioxide equivalent (CO2e). This standard measurement allows organizations to compare the climate impact of different greenhouse gases, including:
Carbon dioxide (CO2),
Methane (CH4),
Nitrous oxide (N2O),
Hydrofluorocarbons (HFCs),
Perfluorocarbons (PFCs), and
Sulfur hexafluoride (SF6).
By measuring emissions in CO2e, businesses can assess their environmental impact, set reduction targets, and track progress over time.
Think of carbon accounting as the environmental version of financial accounting. Just as companies track revenue, expenses, and assets, they now track emissions as an important business metric.
Source: Shutterstock
Why Carbon Accounting Has Become a Business Priority
Over the past decade, climate reporting has shifted from a voluntary sustainability effort to a business requirement. Several factors are driving this change.
Why Investors Are Following the Carbon Trail
Climate risk is increasingly viewed as financial risk.
Asset managers, pension funds, banks, and institutional investors rely on emissions data. They use it to evaluate companies’ risks from regulatory changes, carbon pricing, and supply chain issues. This data also helps them understand the challenges of transitioning to a low-carbon economy.
Environmental performance has also become an important part of Environmental, Social, and Governance (ESG) investing.
Investor interest in sustainability continues to grow. According to the Global Sustainable Investment Alliance, sustainable investment assets reached more than $30 trillion across major global markets in 2023. But under stricter tracking rules, that figure sits at $16.7 trillion in 2025.
Broader industry assessments by Fortune Business Insights valued the total global ESG investing market at $39.08 trillion in 2025. This makes climate performance an increasingly important factor in capital allocation decisions.
Organizations that provide transparent emissions data often gain greater credibility with investors and stakeholders.
Climate Disclosure Is Becoming the New Normal
Many governments worldwide are now enforcing climate disclosure regulations. These rules ask companies to report their greenhouse gas emissions and related climate risks.
The European Union’s Corporate Sustainability Reporting Directive (CSRD), the International Sustainability Standards Board (ISSB) framework, California’s climate disclosure laws, and similar initiatives across Asia-Pacific are boosting the need for reliable carbon accounting systems.
And so many companies, emissions reporting is no longer optional. This is especially true in the case of large corporations.
The Supply Chain Transparency Revolution
Large companies now require suppliers to disclose emissions data as part of their procurement and sustainability programs. For example, Marks & Spencer and Schneider Electric partner to enable suppliers to directly report and track emissions data through their initiative RE:Spark.
The platform combines digital reporting with actionable, aggregated renewable energy procurement to convert Scope 3 data into verifiable, actionable reductions.
As a result, even small and medium-sized businesses are finding carbon accounting to be a must-have to stay competitive.
You Can’t Cut What You Don’t Measure
Thousands of companies around the world have announced emissions reduction targets or net-zero goals. More than 12,000 companies have committed to science-based climate targets through the Science-Based Targets initiative (SBTi).
Source: SBTi
Thousands more have announced net-zero ambitions. However, organizations cannot manage what they do not measure.
Carbon accounting provides the baseline needed to identify opportunities for reduction and track progress toward climate targets.
The Three Emissions Categories Every Business Must Know
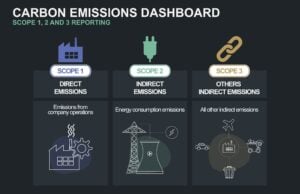
Most companies follow the Greenhouse Gas Protocol, the world’s most widely used emissions accounting framework. The protocol divides emissions into three categories. Here they are in detail.
Scope 1: Direct Emissions
Scope 1 emissions come directly from sources owned or controlled by a company. Examples include:
Fuel burned in company-owned vehicles,
Natural gas used in manufacturing facilities,
Industrial production processes, and
Company-operated equipment.
These emissions come directly from business operations.
Scope 2: Purchased Energy Emissions
Scope 2 emissions come from purchased electricity, steam, heating, or cooling. Although the emissions occur at the power plant, the organization using the energy is responsible for reporting them.
Examples of these emissions are:
Office electricity consumption,
Factory power use, and
Purchased district heating.
For many service-based businesses, electricity use is the largest source of Scope 2 emissions.
Source: Shutterstock
Scope 3: Value Chain Emissions
Scope 3 emissions occur throughout a company’s value chain and are often the hardest to measure. These emissions often come from two types of sources.
Upstream activities:
Purchased goods and services
Transportation and distribution
Employee commuting
Business travel
Waste generated by operations
Downstream activities:
Product transportation
Product use
Product disposal
Franchises
Investments
For many industries, Scope 3 emissions account for more than 70% of total emissions. In sectors such as retail, consumer goods, and financial services, they can even exceed 90%.
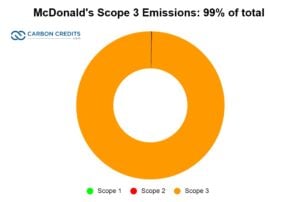
For the food chain giant, McDonald’s, this source accounts for a massive 99% of its total emissions.
According to CDP, Scope 3 emissions are, on average, more than 26 times greater than operational emissions (Scope 1 and Scope 2 combined). This shows why value-chain emissions have become a key focus of corporate climate strategies.
Because of their scale, Scope 3 emissions have become a major focus of corporate sustainability programs.
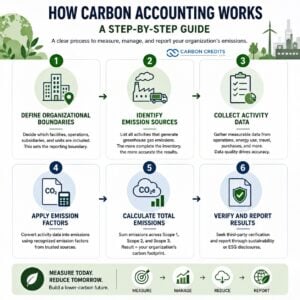
How Carbon Accounting Works: A Step-by-Step Guide
While approaches vary between organizations, most carbon accounting follows a similar process. Here are the ways you can use to compute your company’s emissions.
Step 1: Define Organizational Boundaries
The first step is deciding which facilities, operations, subsidiaries, and business units will be included in the emissions inventory.
This sets the reporting boundary.
Step 2: Identify Emission Sources
Next, organizations identify all activities that generate greenhouse gas emissions. Common sources include electricity consumption, fuel use, manufacturing processes, transportation, business travel, purchased goods, and waste management.
The more complete the inventory, the more accurate the final emissions calculations.
Step 3: Collect Activity Data
Companies gather measurable data linked to emission-generating activities. Examples include:
Kilowatt-hours (kWh) of electricity consumed,
Liters of diesel fuel purchased,
Miles traveled by aircraft,
Tons of raw materials purchased, and
Freight transportation distances.
This step is often the most time-consuming part of carbon accounting.
For large multinational companies, collecting emissions data can involve thousands of suppliers, facilities, and business processes across multiple countries. This makes data collection one of the biggest challenges in climate reporting.
Step 4: Apply Emission Factors
Emission factors convert activity data into greenhouse gas emissions.
For example, if a company uses 10,000 liters of diesel fuel each year, a recognized emission factor can be used to calculate the related CO2e emissions.
Government agencies, scientific institutions, and international organizations typically publish these emission factors.
Step 5: Calculate Total Emissions
All emissions are converted into CO2e and combined across Scope 1, Scope 2, and Scope 3 categories.
The result is the organization’s carbon footprint.
Step 6: Verify and Report Results
Many organizations seek third-party verification to improve transparency and credibility. Verified emissions data is often included in sustainability reports, ESG disclosures, and annual reports. They can also be part of regulatory filings and net-zero progress updates.
A Real-World Look at Carbon Accounting in Action
To see how carbon accounting works in practice, let’s walk through a simplified example for a manufacturing company. Assume the company reports the following annual activity data:
Electricity consumption: 500,000 kWh
Diesel fuel use: 100,000 liters
Employee air travel: 500,000 miles
To calculate emissions, the company multiplies each activity by the appropriate emissions factor. The basic formula is:
Activity Data × Emission Factor = CO2e Emissions
Step 1: Calculate Electricity Emissions (Scope 2)
The company purchased 500,000 kilowatt-hours (kWh) of electricity during the year. Electricity emissions depend on the local power grid. For this example, let’s use a commonly cited grid emissions factor of 0.4 kg CO2e per kWh.
The calculation for this is: 500,000 kWh × 0.4 kg CO2e/kWh = 200,000 kg CO2e.
Then convert kilograms to metric tons: 200,000 ÷ 1,000 = 200 tCO2e.
So, electricity emissions = 200 metric tons CO2e.
Step 2: Calculate Diesel Fuel Emissions (Scope 1)
The company consumed 100,000 liters of diesel fuel in company-owned vehicles and equipment. According to widely used emissions factors from government and GHG reporting programs, diesel combustion produces approximately 2.68 kg CO2e per liter.
The calculation is: 100,000 liters × 2.68 kg CO2e/liter = 268,000 kg CO2e.
Then convert to metric tons: 268,000 ÷ 1,000 = 268 tCO2e.
So, diesel emissions = 268 metric tons CO2e.
Step 3: Calculate Business Travel Emissions (Scope 3)
Employees traveled 500,000 miles by air during the reporting year. Air travel emissions vary depending on aircraft type, travel class, and flight distance. For this example, assume an average emissions factor of 0.24 kg CO2e per passenger mile.
The calculation is: 500,000 miles × 0.24 kg CO2e/mile = 120,000 kg CO2e.
Then convert to metric tons: 120,000 ÷ 1,000 = 120 tCO2e.
So, business travel emissions = 120 metric tons CO2e.
Step 4: Calculate Total Corporate Emissions
Now add all emissions sources together like this:
Emissions Source
Emissions (tCO2e)
Electricity (Scope 2)
200
Diesel Fuel (Scope 1)
268
Air Travel (Scope 3)
120
Total
588 tCO2e
The company’s annual carbon footprint is therefore 588 metric tons of CO2e.
What Do These Numbers Tell Us?
The emissions inventory reveals where the company’s biggest climate impacts occur:
Diesel fuel accounts for about 46% of total emissions.
Electricity represents roughly 34%.
Business travel contributes about 20%.
This information helps management identify the most effective opportunities for reduction. For example, the company could switch diesel vehicles to electric alternatives. They can also purchase renewable electricity, improve energy efficiency, reduce unnecessary air travel, and use virtual meetings when possible.
Establishing a Baseline for Future Reductions
The first year of carbon accounting serves as a baseline.
Suppose the company reduces diesel consumption by 25% and purchases renewable electricity the following year. It can then compare its new emissions inventory against the baseline of 588 tCO2e to measure progress.
This is why carbon accounting is so valuable. It transforms sustainability goals into measurable data that companies can track, report, and improve over time.
While actual corporate inventories often include hundreds or even thousands of emissions sources, the underlying process remains the same:
Measure activity → Apply emissions factors → Calculate emissions → Identify reduction opportunities → Track progress year after year.
How AI is Transforming Carbon Accounting
Carbon accounting has traditionally relied on spreadsheets, invoices, utility bills, and manual calculations. Today, artificial intelligence is changing that process.
AI-powered sustainability platforms help companies automate emissions measurement, improve reporting accuracy, and analyze large amounts of environmental data.
The opportunity is significant. Research from McKinsey estimates that AI could help speed up climate mitigation efforts by improving monitoring, forecasting, and resource optimization across high-emitting sectors.
Source: Stern, N. et al. (2025). https://doi.org/10.1038/s44168-025-00252-3
Here’s how AI can help in carbon accounting:
Automating Data Collection
One of the biggest challenges in carbon accounting is collecting information from multiple business systems. AI can automatically gather and organize data from:
Enterprise resource planning systems,
Procurement platforms,
Utility invoices,
Travel management systems,
Manufacturing equipment, and
Supply chain databases.
This reduces manual work and improves consistency.
Improving Scope 3 Reporting
Scope 3 emissions often involve thousands of suppliers across global supply chains. When supplier-specific emissions data is not available, AI can help estimate emissions using industry benchmarks, purchasing data, economic activity information, and supplier characteristics.
This helps companies build more complete emissions inventories while encouraging suppliers to improve reporting over time.
Identifying Emissions Hotspots
Machine learning algorithms can analyze large datasets and identify the activities that produce the most emissions.
For example, AI may show that a small group of suppliers is responsible for a large share of a company’s carbon footprint. Organizations can then focus their decarbonization efforts where they can have the greatest impact.
Supporting Climate Forecasting
Companies are increasingly using AI to model future emissions pathways and evaluate different climate strategies.
These tools can help them assess net-zero roadmaps, renewable energy investments, carbon reduction opportunities, supply chain risks, and future carbon costs
Major Companies Are Embracing AI
Technology leaders such as Microsoft, Google, IBM, SAP, Salesforce, and Oracle have added AI capabilities to their sustainability and ESG management platforms. These include:
Microsoft Sustainability Manager,
SAP Sustainability Control Tower,
IBM Envizi, and
Salesforce Net Zero Cloud.
These systems help organizations automate emissions calculations, improve reporting accuracy, and generate climate-related insights.
As climate disclosure requirements continue to expand, AI is expected to play an even bigger role in corporate carbon management.
The Carbon Data Investors Want to See
For investors, carbon accounting provides valuable insight into a company’s environmental performance and long-term resilience. Emissions data helps investors assess:
Climate-related risks,
Regulatory exposure,
Transition preparedness,
Operational efficiency, and
Long-term sustainability strategies.
Companies with transparent carbon accounting systems often give investors greater confidence in their climate commitments. This is one reason emissions disclosures have become an important part of ESG analysis.
Key Market Trends Shaping Carbon Accounting
Carbon accounting is no longer a niche market. It is becoming a major part of corporate reporting and sustainability management.
Climate Disclosure Is Going Mainstream
More than 24,800 companies disclosed environmental information through CDP in 2024. This reflects the growing importance of climate transparency across global markets.
Those disclosures were requested by more than 700 financial institutions representing over $140 trillion in assets. This highlights growing investor demand for climate-related information.
The number of reporting companies has increased sharply over the past decade and continues to rise as investor expectations evolve.
Scope 3 Emissions Are Taking Center Stage
Companies now see that much of their carbon footprint comes from activities beyond their direct operations. Thus, organizations are investing more in supplier engagement, collecting value-chain data, and improving Scope 3 reporting.
Carbon Management Software Is Growing Rapidly
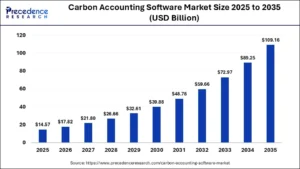
The market for carbon accounting and sustainability management software will grow significantly through the end of the decade.
The global carbon management software market is projected to expand strongly through 2035, reaching over $100 billion. This growth is being driven by organizations looking for automated solutions to simplify data collection, emissions calculations, compliance reporting, and climate disclosures.
Carbon Data Is Becoming a Strategic Asset
Executives increasingly see emissions data as a business metric, not just a sustainability metric. Carbon information now influences:
Capital allocation,
Procurement decisions,
Risk management,
Supply chain strategies, and
Corporate valuations.
Companies that manage carbon data effectively may gain a competitive advantage in a rapidly changing business environment.
Carbon data is no longer used only for sustainability reporting. It also affects procurement decisions, lending practices, supply-chain partnerships, and investment evaluations.
The Obstacles to Accurate Carbon Reporting
Despite significant progress, carbon accounting remains complex. Common challenges include:
Data quality issues,
Incomplete supplier information,
Scope 3 measurement difficulties,
Evolving reporting requirements, and
Resource constraints.
Many organizations are still developing the systems and expertise necessary for efficient emissions reporting. Fortunately, advances in technology, verification standards, and reporting frameworks are helping improve consistency and reliability.
Where Carbon Reporting Goes Next
The future of carbon accounting will likely follow a path similar to financial accounting.
Organizations will need to measure, disclose, and verify emissions data just like they do with financial information. This shift reflects a broader trend of bringing climate performance into mainstream business reporting and corporate governance.
Ultimately, carbon accounting is quickly becoming a core business capability rather than a standalone sustainability initiative. It is the starting point for effective climate action.
It helps organizations understand their environmental impact, identify emissions hotspots, develop reduction strategies, and communicate progress to investors and stakeholders.
In the years ahead, carbon data may become just as important to business decisions as financial data. So for organizations navigating the transition to a more sustainable future, carbon accounting is no longer optional. It is essential.
The U.S. energy landscape is shifting again. Invenergy, one of America’s largest private energy developers, has agreed to end four offshore wind lease projects worth about $765 million and redirect those investments toward natural gas and geothermal energy.
The move comes under a settlement agreement announced by the U.S. Department of the Interior. It aligns with President Donald Trump’s Energy Dominance Agenda, which focuses on expanding reliable domestic energy supplies while reducing dependence on government-supported renewable projects.
Instead of continuing offshore wind development, Invenergy will invest in new natural gas-fired power plants across several states and accelerate geothermal energy projects in the western United States.
Why Invenergy Is Walking Away from Offshore Wind
Under the agreement, Invenergy will voluntarily terminate four offshore wind leases located in the New York Bight, the Central Coast of California, and the Gulf of Maine.
The company will receive a partial reimbursement for the lease payments already made to the federal government. It will then reinvest those funds into energy projects that can begin producing electricity much sooner.
According to the Department of the Interior, the settlement is designed to lower costs, strengthen America’s energy security, and support projects that require less taxpayer assistance. Officials believe shifting investments toward proven technologies can deliver faster returns while improving grid reliability.
Rising Electricity Demand Is Driving Investment
The timing of Invenergy’s strategy reflects a major change in U.S. electricity consumption. Industry forecasts show U.S. electricity demand could increase by 20% to 40% over the next decade, marking the fastest growth in more than twenty years.
Several factors are fueling that increase, including artificial intelligence, cloud computing, advanced manufacturing, electric vehicles, and new industrial facilities.
These industries require large amounts of around-the-clock electricity. As a result, utilities are looking for power plants that can operate continuously and respond quickly when demand spikes.
Invenergy says its investment strategy is focused on projects that can be built on commercially reasonable timelines while delivering reliable and affordable electricity to customers.
The company has already developed more than 225 energy projects representing approximately 38 gigawatts (GW) of power infrastructure.
Today, it operates more than 25 GW across North America.
As electricity demand continues to rise, the government is increasingly prioritizing projects that can quickly supply dependable power.
Invenergy Builds on Its Natural Gas Experience
Natural gas already plays a major role in Invenergy’s business.
The company currently operates 14 natural gas facilities with a combined generating capacity of about 7 GW.
In 2024, those facilities produced roughly 21,000 gigawatt-hours (GWh) of electricity.
Its portfolio also includes liquefied natural gas (LNG)-powered facilities. One example is the Energía del Pacífico project in El Salvador, which supplies nearly 30% of the country’s total electricity demand.
Invenergy says it continues to develop advanced natural gas technologies, including combined-cycle plants, fast-start peaking units, and LNG-to-power systems that can improve grid flexibility and reliability.
Natural Gas Projects
Source: Invenergy
Projects in Pipeline
A large share of Invenergy’s new investment will go toward natural gas power generation. The company plans to develop or expand gas-fired power projects in:
Indiana
Wisconsin
Iowa
Kansas
Missouri
These facilities are expected to add significant generating capacity while creating hundreds of construction and long-term operating jobs.
One of the biggest projects is the Sycamore Riverside Energy Center in Sullivan County, Indiana. The planned facility will generate 918 megawatts (MW) using natural gas combustion turbines. It will become Invenergy’s third energy project in the county.
The company announced in April that Indiana Michigan Power (I&M) had already asked the Indiana Utility Regulatory Commission for approval to acquire the project through a Certificate of Public Convenience and Necessity.
Daniel Runyan, Senior Vice President of Development at Invenergy, said reliable and affordable electricity is becoming increasingly important as power demand grows across the country. He added that projects like Sycamore Riverside can help provide consistent electricity for customers while supporting economic growth.
Geothermal Becomes a Second Growth Opportunity
While natural gas will receive much of the new investment, geothermal energy is also becoming an important part of Invenergy’s long-term strategy.
Unlike solar and wind, geothermal plants generate electricity around the clock because they use heat from beneath the Earth’s surface.
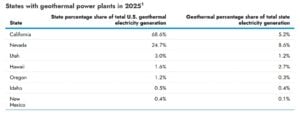
Although geothermal currently produces less than 1% of U.S. electricity, the industry is gaining momentum.
New drilling techniques and Enhanced Geothermal Systems (EGS) are enabling developers to access underground heat in areas previously unsuitable for geothermal power generation.
Invenergy has already secured 44 geothermal leases from the Bureau of Land Management covering approximately 139,000 acres across Nevada, Idaho, California, and Utah.
These projects could significantly expand geothermal generation throughout the western United States over the coming years.
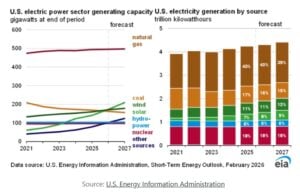
EIA data reveals that currently, geothermal power plants operate in seven U.S. states and generate roughly 16 billion kilowatt-hours (kWh) of electricity, or about 0.4% of total U.S. utility-scale electricity production.
Source: EIA
Natural Gas Still Dominates the U.S. Power System
EIA’s Short Term Energy Outlook shows that, despite rapid renewable energy growth, natural gas remains the backbone of the U.S. electricity grid. Today, it accounts for about 42% of America’s installed electricity generation capacity.
Developers plan to add approximately 6.3 GW of new natural gas-fired generating capacity during 2026.
About 3.3 GW will come from combined-cycle plants, while another 2.8 GW will use combustion turbines.
More than 80% of these new projects are scheduled for Texas, Oklahoma, Ohio, Tennessee, and Florida.
Two of the largest projects are the 1,158-MW Orange County Advanced Power Station in Texas and the 900-MW Trumbull Energy Center in Ohio.
Source: EIA
At the same time, natural gas production continues to reach record levels. The United States has become the world’s largest exporter of liquefied natural gas, helping strengthen global energy markets.
Growing LNG exports, increasing gas production from the Permian Basin, expanding manufacturing, and soaring electricity demand from AI data centers are all expected to support long-term natural gas consumption.
However, infrastructure challenges remain. During periods of extreme weather, pipeline constraints can limit supplies available to manufacturers because residential customers receive priority access to natural gas.
A Strategic Shift Toward Reliable Energy
Invenergy’s decision reflects a broader shift in U.S. energy investment priorities.
Rather than pursuing offshore wind projects with uncertain timelines, the company is focusing on energy sources that can deliver electricity sooner while strengthening grid reliability.
By combining expanded natural gas generation with growing geothermal investments, Invenergy aims to meet rising electricity demand while supporting domestic energy security.
As AI, data centers, manufacturing, and electrification continue driving power consumption higher, investments in dependable, large-scale generation are likely to play an increasingly important role in America’s evolving energy mix.
The aviation industry is making progress toward cutting carbon emissions, but the supply of sustainable aviation fuel (SAF) remains far below what airlines need. According to the International Air Transport Association (IATA), global SAF production is expected to reach only 2.4 million tonnes in 2026. While this marks an increase from previous years, it will cover just 0.8% of the aviation sector’s total fuel demand.
The industry has committed to achieving net-zero carbon emissions by 2050, but IATA believes current production levels are nowhere near sufficient to meet that target. At its 82nd Annual General Meeting in Rio de Janeiro, the airline group warned that slow investment, weak policy design, and high fuel costs are delaying the transition to cleaner aviation.
SAF Production Is Growing, But Too Slowly
IATA estimates that airlines will spend around $4.3 billion on SAF in 2026. However, despite this high cost, the fuel will replace less than 1% of the conventional jet fuel consumed globally.
Production has increased over the past three years, but the pace remains far below what the industry requires.
2024: about 1 million tonnes
2025: 1.9 million tonnes
2026 (forecast): 2.4 million tonnes
Although production continues to rise, growth has started to slow. Even more concerning, global SAF production has largely stagnated since December 2025, despite growing demand from airlines.
IATA Director General Willie Walsh expressed frustration over the industry’s slow progress.
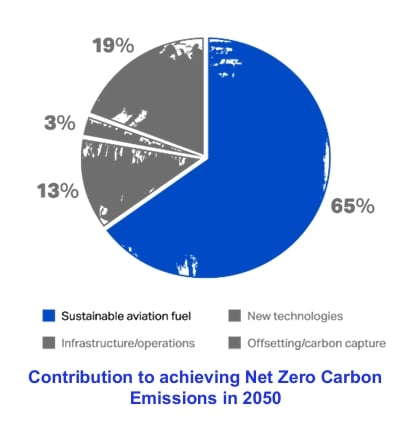
“Five years after committing to achieve net zero by 2050, SAF production will only account for 0.8% of airline fuel use this year,” Walsh said. “The path to meeting 65% of our needs in 2050 is growing more difficult with each year of ineffectively sequenced government policies and oil companies’ manifest lack of interest.”
The industry estimates that around 500 million tonnes of SAF will be needed annually by 2050. Current production remains only a tiny fraction of that requirement.
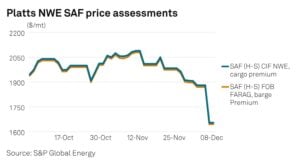
At the same time, SAF has become significantly more expensive. According to IATA, prices climbed from just over $2,000 per metric tonne in February 2026 to around $3,000 per tonne by May, following rising geopolitical tensions in the Middle East.
This sharp increase adds another financial burden for airlines that are already dealing with higher operating costs.
Earlier estimates by S&P Global showed airlines would face roughly $3.6 billion in SAF-related costs during 2025, largely because SAF sells for two to five times more than traditional jet fuel in markets where blending mandates apply.
These higher prices are making it more difficult for airlines to expand SAF use while remaining competitive.
Interestingly, the problem is not simply a lack of production facilities.
IATA estimates that global SAF production capacity has expanded to roughly 9 million tonnes in 2026. Yet actual production is expected to reach only 2.4 million tonnes, leaving much of that capacity unused.
According to Preeti Jain, Head of Net Zero Research and Programmes at IATA, current government policies are partly responsible. She explained that incentives often favor the production of renewable diesel for road transport instead of SAF. At the same time, feedstock availability remains uneven across North America, Europe, and Asia, slowing the expansion of aviation fuel production.
As a result, existing facilities are not operating at their full potential.
IATA Says E-SAF Targets Are Unrealistic
IATA also criticized European mandates requiring the use of electro-SAF (e-SAF), a synthetic aviation fuel made using renewable electricity through power-to-liquid technology.
The European Union and the United Kingdom have set combined targets requiring approximately 600,000 tonnes of e-SAF by 2030.
However, today’s global production capacity is only around 20,000 tonnes, and there is currently just one commercial production facility operating worldwide.
According to IATA, achieving the 2030 target would require roughly 20 large commercial e-SAF refineries. Yet no new final investment decisions have been announced over the past year.
Marie Owens Thomsen, IATA’s Senior Vice President for Sustainability and Chief Economist, believes policymakers have set targets without ensuring production can actually happen. She called the 2030 goals “beyond unrealistic” and said imposing mandates before enabling production capacity “will only drive up the price.”
IATA Wants Governments to Rethink Their Policies
Rather than introducing aggressive mandates first, IATA argues governments should focus on building the market. The association identified four priorities that could accelerate SAF production worldwide. They are:
Governments should expand renewable energy supplies needed for future fuel production.
Fuel producers should receive open access to infrastructure such as pipelines, storage systems, and airport fuel networks.
Production incentives should come before mandatory blending requirements so investors have confidence to build new plants.
IATA wants governments to support global book-and-claim systems and harmonized sustainability standards that would allow SAF certificates to be traded internationally.
Passengers Still Support Cleaner Flying
Despite higher ticket prices that may result from decarbonization efforts, passengers continue to back cleaner aviation.
An IATA survey conducted in April 2026 found that 89% of travelers believe the aviation industry should continue reducing emissions regardless of government action. This strong public support suggests demand for lower-carbon air travel remains high, even as airlines struggle with the cost of cleaner fuels.
Source: IATA
Can Brazil Become a Global SAF Leader?
While many regions face supply challenges, IATA believes Brazil could emerge as one of the world’s biggest SAF producers over the coming decades.
The country has several natural advantages, including abundant agricultural feedstocks, a clean electricity system, and decades of experience producing biofuels.
According to IATA:
Brazil could produce around 180 million tonnes of biomass feedstock by 2050.
That biomass could generate approximately 60 million tonnes of SAF.
By 2030 alone, sustainably sourced sugar-based ethanol, virgin oils, and waste oils could provide 18 million tonnes of feedstock, enough to produce about 12 million tonnes of SAF.
That potential is five times larger than projected global SAF production in 2026.
Brazil currently has 15 SAF projects under development. If all move forward, they could add roughly 2 million tonnes of annual SAF production.
Walsh further noted,
“Brazil has all the ingredients to be a global SAF powerhouse. It has one of the cleanest electricity mixes in the world as well as abundant feedstock. Moreover, as the second-largest producer of liquid biofuels in the world, the country benefits from deep expertise and developed infrastructure. Brazil has a real opportunity to be a global leader in aviation’s decarbonization. Embracing this opportunity will create jobs, reduce dependence on foreign fossil fuels, build new energy and agriculture industries, and grow the economy. With the right policies implemented in the right order, Brazil is ready to jump-start the market.”
Strong Economic Advantages
Brazil already has well-established ethanol production, existing refining infrastructure, and significant agricultural expertise. These strengths could support several SAF production pathways, including Hydroprocessed Esters and Fatty Acids (HEFA) and ethanol-to-jet technology.
So, if production expands as expected, Brazil could eventually become a net exporter of sustainable aviation fuel.
Beyond aviation, a larger SAF industry would create opportunities across agriculture, logistics, refining, infrastructure, and fuel exports. It could also strengthen energy security, support rural communities, improve soil management, and generate thousands of new jobs.
Building Brazil’s SAF Industry Will Take Time
Even with its strong advantages, Brazil’s SAF industry is still in its early stages. IATA says several challenges must be addressed before production can scale. The country will need greater investment in conversion technologies, transportation infrastructure, and supply chains connecting feedstock producers with refineries.
Furthermore, governments must also introduce stable production incentives, improve financing mechanisms, and align sustainability standards with international markets.
Finally, IATA supports Brazil’s proposed book-and-claim system under its Fuel of the Future (ProBioQAV) framework. Tradeable SAF certificates would help connect Brazilian producers with global airline demand while supporting international programs such as CORSIA.
However, IATA stresses that sequencing remains critical. Fuel production must increase before mandatory usage targets take effect. Otherwise, limited supply could push prices even higher and slow the industry’s progress toward net zero.
The race to scale carbon removal received another major boost. Artificial intelligence (AI) company Anthropic has joined Frontier, a carbon removal advanced market commitment (AMC) coalition that includes Google, Stripe, Shopify, H&M Group, and Salesforce. They announced a new commitment of $915 million for carbon removal credits.
The new funding comes on top of Frontier’s original $1 billion advance market commitment (AMC) launched in 2022, bringing total commitments to $1.8 billion. Frontier says the goal is to accelerate the development of technologies that permanently remove carbon dioxide from the atmosphere.
Why Carbon Removal Is Becoming a Climate Priority
The announcement shows rising corporate support for carbon removal. Governments and scientists now agree that just cutting emissions won’t meet global climate goals.
Most climate strategies focus on reducing emissions. However, many experts now believe that removing carbon dioxide already in the atmosphere will also be necessary.
The Intergovernmental Panel on Climate Change (IPCC) says the world must limit global warming to 1.5°C. This will likely need billions of tons of carbon removal every year by mid-century.
Today, the industry remains small. CDR.fyi reports that 30 million tons of durable carbon removal have been contracted worldwide so far. That is only a tiny fraction of the gigatons that scientists believe may eventually be needed.
This gap between current supply and future demand explains why Frontier was created. The coalition uses an advance market commitment model. Instead of waiting for technologies to mature, buyers commit money upfront. That demand signal helps startups attract investment, build facilities, and scale production.
The concept has worked before. Similar advance purchase agreements helped accelerate vaccine development and deployment in global health programs.
Inside Frontier’s Plan to Scale Carbon Removal Technologies
Since launching in 2022, Frontier has become one of the most influential buyers in the carbon removal market. Stripe, Alphabet, Shopify, Meta, and McKinsey Sustainability started the group. They committed about $925 million, which later grew to over $1 billion.
Randy Spock, Head of Carbon Credits and Removals at Google, remarked:
“At Google, we believe in the power of science and technology to mitigate planetary warming. Frontier’s mission is a cornerstone of this approach, and we’re excited to expand our support for these critical solutions alongside other leading companies.”
The organization focuses on technologies that can permanently store carbon for hundreds or thousands of years. Frontier has already facilitated agreements with more than 50 carbon removal startups. These projects cover a wide range of approaches, including:
Direct air capture (DAC),
Enhanced rock weathering,
Ocean alkalinity enhancement,
Bioenergy with carbon capture and storage (BECCS), and
Carbon mineralization.
The group has funded several record-breaking purchases and has the following progress so far:
Source: Frontier
One of the largest deals included 154,240 tons of carbon removal from Lithos Carbon. This was worth $57.1 million, making it one of the largest enhanced-weathering purchases ever. Frontier has also signed multimillion-dollar agreements with direct air capture companies such as Heirloom and CarbonCapture.
The new $915 million commitment will support the best projects as they scale. This comes at a time when venture capital funding for climate tech is becoming more selective.
The AI Boom Creates a New Climate Challenge
Anthropic’s decision to join Frontier comes as AI companies face growing scrutiny over their environmental footprint. AI systems require massive amounts of computing power, which is driving rapid growth in data centers and electricity demand worldwide.
A recent United Nations University (UNU) report found that global data centers used around 448 terawatt-hours (TWh) of electricity in 2025. They also generated about 189 million metric tons of CO₂ emissions. That’s similar to Argentina’s yearly emissions.
Source: UNU Report
The report predicts that data center electricity use may hit 945 TWh by 2030. This would make the sector one of the biggest power consumers in the world. AI is expected to account for an increasing share of that demand, rising from about 20% of data center energy use today to 40% by 2030.
Anthropic is among the companies expanding AI infrastructure. Earlier this year, it announced plans to secure multiple gigawatts of new computing capacity through partnerships with Google and Broadcom to support future Claude AI models.
As AI adoption accelerates, many technology companies are finding it harder to meet climate goals. This is one reason carbon removal is gaining attention.
Renewable energy cuts emissions, but carbon removal tackles the leftovers. This is important as AI infrastructure expands.
Corporate Buyers Are Fueling a Carbon Removal Surge
The broader carbon removal market is growing quickly. According to CDR.fdyi data, approximately 49 million carbon removal credits have been sold globally, representing around $12 billion in transactions. While much of that volume consists of early-stage agreements, it shows growing buyer interest in long-term carbon removal solutions.
Corporate demand remains the main driver. Microsoft has emerged as the largest buyer of carbon removal credits worldwide. The company has signed agreements covering millions of tons of future removals across direct air capture, enhanced rock weathering, biochar, forestry, and bioenergy projects.
Other major buyers include Google, Stripe, Shopify, JPMorgan Chase, H&M Group, and Airbus. At the same time, governments are beginning to show greater interest.
The European Union is creating a Carbon Removal Certification Framework. Meanwhile, some countries are looking into policies to support future carbon removal markets.
Industry leaders believe government participation will eventually be necessary to scale removals from today’s levels to billions of tons per year. Frontier executives have repeatedly stated that private-sector purchases alone will not be enough to build the market at the scale required for global climate goals.
Can Carbon Removal Scale Fast Enough?
Despite the momentum, carbon removal still faces major obstacles. Costs remain high for many technologies.
Direct air capture projects often cost hundreds of dollars per ton today, although developers expect costs to decline as facilities scale. Other approaches, such as enhanced weathering and ocean alkalinity enhancement, are still proving their performance at commercial scale.
Measurement and verification also remain important challenges. Buyers increasingly want strong evidence that carbon has been permanently removed and stored. This has led to greater focus on monitoring systems, scientific validation, and transparent reporting standards.
Despite these challenges, experts expect the carbon removal market to grow rapidly. The International Energy Agency says billions of tons of carbon removal may be needed each year by 2050 to help achieve global net-zero goals.
Source: McKinsey & Company
McKinsey estimates that annual demand for carbon removal credits could reach 100 million metric tons by 2030 and 1.5 billion to 2 billion metric tons by mid-century. This creates a market worth as much as $1.2 trillion. These forecasts show both the size of the opportunity and the scale of the challenge facing the industry.
What Anthropic’s Move Means for the Future of Climate Tech
Anthropic’s decision to join Frontier reflects a broader shift taking place across the technology sector. Companies that are helping drive the AI boom are also becoming important buyers of climate solutions.
The new $915 million commitment sends one of the strongest market signals yet that corporate demand for carbon removal continues to grow. It shows growing confidence that durable carbon removal technologies could be key in future climate strategies.
For the climate sector, one message is clear: cutting emissions is the top priority. However, removing carbon from the atmosphere will also likely be critical to achieving global net-zero goals.
The Group of Seven (G7) nations have launched a major effort to reduce their dependence on China for rare earth minerals. The move comes as Beijing tightens export controls on critical materials, raising concerns over global supply chains and national security.
At the G7 summit in France, the United States, Canada, France, Germany, Italy, Japan, and the United Kingdom pledged that no single country should account for more than 60% of their rare earth imports by 2030. The group also said it aims to lower that share to 50% as soon as possible.
The commitment reflects growing concerns that China’s dominance in the rare earth industry has become a major economic and geopolitical risk.
The Supply Chain Behind China’s Rare Earth Power
Rare earth elements are a group of 17 minerals that play a vital role in modern technologies. They are used to manufacture permanent magnets found in electric vehicles (EVs), wind turbines, semiconductors, smartphones, military aircraft, drones, and precision-guided weapons.
Although rare earths are mined in several countries, China dominates almost every stage of the supply chain—from mining and refining to magnet production.
According to the International Energy Agency (IEA), China currently produces around 60% of the world’s magnet rare earths. Its dominance becomes even stronger further down the value chain. The country controls more than 90% of global rare earth refining capacity and nearly 95% of permanent magnet production.
Two decades ago, China produced about half of the world’s permanent magnets. Since then, it has steadily expanded its control over the industry, making it extremely difficult for other countries to compete.
Export Controls Expose Global Vulnerabilities
China’s export controls introduced in 2025 exposed just how dependent global manufacturers remain on Chinese supplies.
Several companies outside China struggled to obtain essential rare earth materials. Some manufacturers even had to slow or reduce production because critical inputs became unavailable.
Although exports later recovered, the disruption served as a warning for governments and industries worldwide.
The IEA estimates that if China fully implements its export restrictions, as much as $6.5 trillion worth of economic activity outside China could be affected every year. Industries at the greatest risk include automotive manufacturing, electronics, clean energy, and transportation.
The pressure could increase further as China plans to reinstate export controls on several defense-related rare earth products in November after a temporary trade truce with the United States expires.
Exports Continue to Grow
Despite tighter regulations, China’s overall rare earth exports have continued to rise.
According to Statista, citing data from China’s General Administration of Customs and Reuters, Chinese rare earth exports reached 62,600 metric tons in 2025. It was up from 55,400 metric tons in 2024.
The figure represents the country’s highest annual export volume in more than a decade.
Strong global demand from electric vehicle manufacturers, renewable energy developers, and electronics companies helped keep exports high despite export restrictions.
Analysts note that Beijing’s controls mainly target specific rare earth elements and advanced processing technologies rather than all exports. Because China remains the world’s dominant supplier, many international buyers have few immediate alternatives.
As a result, companies have started building inventories and adjusting supply chains to prepare for future trade disruptions.
Although governments are investing in new mining projects, building an alternative supply chain will take years.
The IEA says current and announced projects outside China are far from enough to meet future demand.
By 2035:
Existing mining projects are expected to supply only about half of the rare earth demand outside China.
Planned refining capacity will cover only around one-quarter of future needs.
Magnet manufacturing capacity will meet less than one-fifth of the expected demand.
The report also highlights a major imbalance. While more countries are investing in mining, far fewer are developing refining facilities and magnet manufacturing plants. Yet these downstream industries remain the biggest bottlenecks.
Without significant investment across the entire value chain, reducing dependence on China will remain difficult.
Billions Needed to Build New Supply Chains
The IEA estimates that approximately $60 billion will be needed over the next decade to develop diversified rare earth supply chains outside China.
Although this investment is substantial, it is relatively small compared with the trillions of dollars at risk if future supply disruptions occur.
Governments are therefore increasingly supporting domestic mining, refining, recycling, and advanced manufacturing to strengthen supply security.
Meanwhile, the United Nations reports that China has introduced 16 trade restrictions on critical energy transition materials since 2020. Japan, the European Union, and the United States together account for more than half of global rare earth magnet imports, making supply diversification a strategic priority.
Rare-Earth Production by Country 2026
Source: World Population Review
Recycling Could Ease Future Supply Pressure
Mining alone will not solve the problem.
The IEA believes recycling could reduce demand for newly mined rare earth materials by up to 35% by 2050. At the same time, advances in alternative materials and more efficient manufacturing technologies could reduce dependence on the most constrained rare earth elements.
Source: IEA
These innovations are expected to become increasingly important as demand for EVs, renewable energy systems, artificial intelligence infrastructure, and defense technologies continues to grow.
The Bottom Line
The G7’s new pledge marks one of the strongest international efforts yet to reduce dependence on China’s rare earth supply chain. However, achieving that goal will require far more than opening new mines.
Countries must also invest in refining, magnet manufacturing, recycling, and advanced technologies to build resilient supply chains. Until then, China is likely to remain the dominant force in the global rare earth market, leaving industries ranging from clean energy to defense exposed to future supply disruptions.
To provide the best experiences, we use technologies like cookies to store and/or access device information. Consenting to these technologies will allow us to process data such as browsing behavior or unique IDs on this site. Not consenting or withdrawing consent, may adversely affect certain features and functions.
Functional
Always active
The technical storage or access is strictly necessary for the legitimate purpose of enabling the use of a specific service explicitly requested by the subscriber or user, or for the sole purpose of carrying out the transmission of a communication over an electronic communications network.
Preferences
The technical storage or access is necessary for the legitimate purpose of storing preferences that are not requested by the subscriber or user.
Statistics
The technical storage or access that is used exclusively for statistical purposes.The technical storage or access that is used exclusively for anonymous statistical purposes. Without a subpoena, voluntary compliance on the part of your Internet Service Provider, or additional records from a third party, information stored or retrieved for this purpose alone cannot usually be used to identify you.
Marketing
The technical storage or access is required to create user profiles to send advertising, or to track the user on a website or across several websites for similar marketing purposes.