USA Rare Earth is making a big move in the critical minerals space. The company plans to acquire Brazil’s Serra Verde for $2.8 billion. This deal includes $300 million in cash and 126.9 million new shares. This values Serra Verde at about $2.8 billion based on USA Rare Earth’s share price from April 17. The acquisition is expected to close in the third quarter of 2026.
This purchase connects one of the few heavy rare earth producers outside China with USA Rare Earth’s growing mine-to-magnet platform. It aims to create an integrated supply chain for mining, processing, and magnet manufacturing. This is key as governments and industries want to reduce their reliance on Chinese supplies.
Barbara Humpton, Chief Executive Officer of USA Rare Earth, stated:
“The acquisition of Serra Verde represents a transformational step in delivering on our ambition to build a global champion and the partner of choice in rare earth elements, oxides, metals and magnets. Serra Verde’s Pela Ema mine is a one-of-a-kind asset and the only producer outside Asia capable of supplying all four magnetic rare earths at scale, together with other vital REEs, such as Yttrium. Serra Verde’s global importance is evidenced by its 15-year offtake agreement with a special purpose vehicle capitalized by various U.S. Government entities, as well as private capital sources, for 100% of its Phase 1 Nd, Pr, Dy and Tb production.
By combining Serra Verde’s world-class operations and team with our processing, separation, metallization and magnet-making capabilities, we are advancing our goal of creating a fully integrated platform that will serve as a cornerstone of global rare earth supply security for decades to come.”
Serra Verde Adds Heavy Rare Earth Supply the West Has Been Missing
Serra Verde provides access to heavy rare earths like dysprosium, terbium, and yttrium. These materials are essential for permanent magnets in electric vehicles, wind turbines, robotics, and defense tech. Sourcing them outside China is challenging. Supply concerns are rising as demand grows.
Many Western projects focus on light rare earths, but Serra Verde offers valuable heavy elements. Its Pela Ema mine in Goiás began production in 2024 after over $1.1 billion in investments. It became the first operational ionic clay deposit in the West.
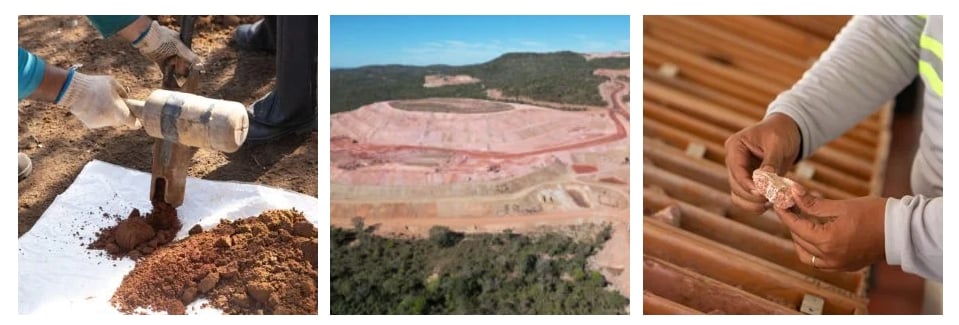
REEs from clay deposits at Pela Ema
Source: Serra Verde
By 2027, Phase 1 is projected to produce about 6,400 metric tons of total rare earth oxide annually. The mine aims to supply over 50% of non-China heavy rare earths by 2027. These figures boost the asset’s strategic value, with growth potential beyond current operations.
A Phase 2 expansion could double production.
This growth aligns with USA Rare Earth’s goal of building a complete rare earth supply chain. Serra Verde adds feedstock production, while Round Top in Texas offers another source of heavy rare earths. Together, these assets strengthen the upstream supply base. But the story goes beyond mining.
Building a Vertically Integrated Rare Earth Platform
USA Rare Earth has spent years creating a vertically integrated platform. They acquired Less Common Metals in the UK, adding rare earth metal, alloy, and strip-casting capabilities. An Oklahoma magnet plant, launching later this year, will enhance downstream manufacturing.
With Serra Verde, these assets connect Brazilian feedstock, U.S. project development, European metallization, and U.S. magnet production.
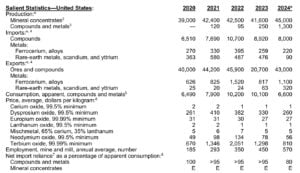
According to the U.S. Geological Survey’s Mineral Commodity Summaries 2025, rare earth supply remains highly concentrated, with China continuing to dominate both mining and, more importantly, processing and magnet production.
Source: USGS
Thus, this integration is crucial. Supply chain gaps have hindered Western rare earth ambitions. Mines without processing capacity face bottlenecks. Processing without secure feedstock risks supply. Magnet manufacturing without reliable materials can leave operations vulnerable.
This deal addresses these issues by combining multiple stages of the value chain. Strategic highlights from the acquisition show expansion opportunities across nearly every part of the platform.
Upstream Supply Base: Upstream, Serra Verde’s Phase 2 growth paves the way for larger production volumes, while Round Top adds long-term potential. On the processing side, USA Rare Earth gains separation expertise through its partnership with Carester and plans to develop a rare earth carbonate separation line.
Processing and Metallization Capacity: In metallization, the company aims to expand Less Common Metals’ reach in France, the U.S., and other markets to increase non-China metal, alloy, and strip-cast output.
Downstream Magnet Manufacturing: Downstream, management sees potential to grow magnet manufacturing capacity for industrial customers focused on supply security. Together, these initiatives create a strategy that scales the entire supply chain rather than adding isolated assets.
Financial Structure Designed to Reduce Risk and Support Growth
The deal includes financial features aimed at reducing risk while supporting growth. Serra Verde secured a $565 million financing package from the U.S. International Development Finance Corporation to fund expansion through positive cash flow.
This eases financing pressure and supports scaling. It also has a 15-year, 100% offtake agreement for neodymium, praseodymium, dysprosium, and terbium, with minimum price floors, improving revenue stability and limiting commodity price risk.
Serra Verde expects $550–650 million in annualized EBITDA by 2027, with the combined company targeting about $1.8 billion by 2030 and roughly 80% cash flow conversion. The projections underline the deal’s transformational nature, focused on earnings growth and supply chain resilience.
USA Rare Earth (USAR) Stock Jumps 15%
Meanwhile, USA Rare Earth secured a separate $1.6 billion funding package from the U.S. government earlier this year. The company expects more than $3.2 billion in pro forma liquidity, which includes around $1.2 billion in cash and $1.8 billion from milestone-based funding. This funding comes from DFC and the U.S. Department of Commerce loan facilities.
This government support shows that rare earth supply connects to industrial strategy and national security. Governments see critical mineral supply chains as essential for energy, advanced manufacturing, and defense. The deal’s financing reflects this change and improves the company’s financial outlook.
Significantly, USA Rare Earth (USAR stock) shares rose over 15% after the announcement, boosting the company’s market value to about $4.9 billion.
Source: USAR
Overall, this acquisition marked a shift in how the Western rare earth industry approached supply security. Instead of relying on isolated mining projects, USA Rare Earth moved toward a fully integrated platform that connected mining, processing, metallization, and magnet manufacturing across multiple regions.
The deal strengthened access to heavy rare earths, improved supply chain control, and aligned closely with government-backed industrial strategy. While execution risks remained, the overall direction pointed clearly toward building a more secure and independent rare earth supply chain outside China.
As FIFA prepares for its upcoming World Cup tournaments from June 11 to July 19, 2026, its climate strategy is facing closer attention, too. The organization has set a goal to reach net zero emissions by 2040. It also aims to cut emissions by 50% by 2030.
These targets are part of FIFA’s long-term sustainability plan, which aligns with the UN Sports for Climate Action Framework and the Paris Agreement. FIFA first announced its climate strategy in 2021 and has since applied it across major tournaments.
However, the challenge is not setting targets. The real challenge is reducing emissions in a global event that depends on international travel. The World Cup is one of the most complex events to decarbonize because most emissions come from sources outside direct control.
FIFA’s Climate Commitments and Official Emissions Targets
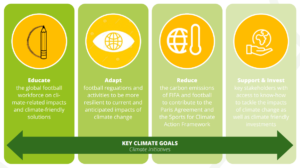
FIFA’s climate strategy follows a structured pathway based on global climate standards. It includes measuring emissions, reducing them where possible, and offsetting what remains.
The organization has committed to three main actions:
Reduce greenhouse gas emissions by 50% by 2030.
Achieve net zero emissions by 2040.
Align operations with international climate frameworks.
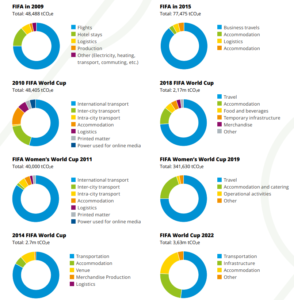
FIFA reports emissions using standard greenhouse gas accounting. This includes tracking emissions across tournaments, host cities, and operational activities.
Source: FIFA
In past tournaments, FIFA has introduced sustainability measures such as energy-efficient stadiums, waste reduction programs, and public transport planning. For example, several recent World Cup venues have used renewable electricity and modern cooling systems to reduce energy demand.
FIFA also works with host countries to improve infrastructure planning. This includes encouraging the use of existing stadiums and limiting new construction where possible. These steps aim to reduce emissions linked to building materials and long-term infrastructure.
Still, these efforts mainly affect operational emissions. The larger challenge lies beyond stadiums and facilities.
How Emissions Are Measured in the World Cup
FIFA measures emissions using the widely accepted Scope 1, Scope 2, and Scope 3 framework.
Scope 1 emissions come from direct sources such as fuel use in vehicles and on-site operations. Scope 2 emissions come from purchased electricity used in stadiums and facilities. These emissions can be reduced through renewable energy and efficiency improvements.
Scope 3 emissions include all indirect emissions linked to the event. These are the most complex and the largest category.
In the World Cup, Scope 3 emissions come from these sources:
International and domestic travel by fans,
Team and staff transportation,
Accommodation and hospitality services,
Supply chains and merchandise production, and
Broadcasting and logistics operations.
In large global events, Scope 3 emissions often account for more than half of total emissions. The share is even higher due to the scale of international travel in football tournaments.
This structure shows that most emissions do not come from FIFA’s direct operations. They come from the wider system that supports the event.
By the Numbers: Inside the 3.7M Ton Carbon Footprint of 2026 World Cup
The FIFA World Cup is one of the largest global sporting events. The 2022 tournament in Qatar drew over 3.4 million spectators, according to FIFA, and reached billions of viewers worldwide. This level of participation creates a large environmental footprint.
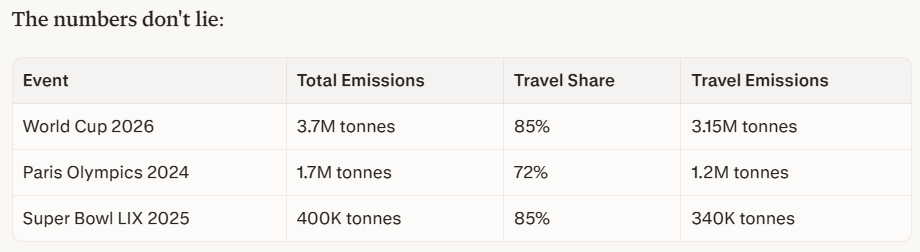
For the 2026 FIFA World Cup, hosted by the United States, Canada, and Mexico, total emissions are projected at around 3.7 million tonnes of CO₂ equivalent (CO₂e). This estimate comes from the United 2026 bid’s environmental impact assessment. It reflects the full lifecycle footprint of the event, including travel, operations, and infrastructure.
Transportation is the main driver of these emissions. About 85% of total emissions are linked to travel, especially air travel. This includes both international flights and travel between host cities.
The scale of the 2026 tournament adds to this challenge. It will feature 48 teams, up from 32 in previous editions, and will span multiple countries and cities. This increases travel demand, distances between matches, and overall logistics complexity.
The structure of emissions can be summarized as follows:
~85% from travel-related activities (~3.15 million tonnes CO₂e)
~15% from operations, energy use, and infrastructure (~0.55 million tonnes CO₂e)
Travel emissions alone include:
51% from international journeys
34% from travel between host cities
Compared with more compact tournaments, this format leads to higher emissions due to increased reliance on long-distance flights.
Scope 3 Emissions: The Core Climate Challenge
The emissions profile of the World Cup highlights a clear imbalance. Most emissions fall under Scope 3, which includes indirect sources such as travel, logistics, and supply chains.
Scope 1 and Scope 2 emissions, which cover direct operations and energy use, represent only a small share of the total footprint. These can be reduced through renewable energy and efficient design.
Scope 3 emissions are different. They come from activities outside FIFA’s direct control. These include fan travel, team transport, global logistics, and services linked to the event. This creates a structural challenge. Even if FIFA reduces emissions from stadiums and operations, total emissions can remain high due to travel demand.
In simple terms, the World Cup’s carbon footprint is driven more by movement than by infrastructure.
Scope 3 is also the hardest category to reduce. It depends on global travel patterns, geography, and individual choices. FIFA cannot fully control how fans travel or how often they move between cities.
This is why Scope 3 emissions are central to the climate challenge. They account for the largest share of emissions and the biggest barrier to reducing the World Cup’s overall footprint.
Cuts vs. Credits: The Ongoing Offset Debate
To meet its climate targets, FIFA uses both emissions reduction and carbon offsetting. Reduction focuses on lowering emissions at source. This includes improving energy efficiency, using renewable electricity, and optimizing event operations.
Offsetting is used to balance emissions that cannot be eliminated. This involves investing in projects that reduce or remove carbon emissions elsewhere.
Carbon offsets can include projects such as reforestation, renewable energy development, and carbon capture. However, their effectiveness depends on project quality, verification, and long-term impact.
This has led to debate in climate policy. Some experts argue that offsets should not replace real emissions reduction. Others point out that offsets can support the transition when used carefully.
The key issue is transparency. Clear reporting and verified data are needed to ensure that net-zero claims reflect real outcomes.
Why Net Zero Is Difficult for Mega Sports Events
Mega sporting events like the World Cup have unique challenges. They are temporary, global, and highly mobile. Their emissions come from:
International travel,
Temporary infrastructure,
Large-scale logistics, and
Global audience participation.
Even with strong sustainability measures, these factors create a high baseline of emissions.
Take for example, the Paris 2024 Olympics. The event’s total footprint hit 1.7 million tonnes CO₂e. Travel caused 72%, that’s 1.2 million tonnes, from 720,000+ international visitors. Stadiums run on 100% renewables, but aviation emissions? Untouched.
Super Bowl LIX in 2025 told the same story. The event generated 400,000 tonnes CO₂e, with 85% coming from 150,000+ out-of-state fans flying to New Orleans. The NFL bought 400,000 offsets for carbon-neutral claims. Still, travel cuts? Zero.
This pattern is industry-wide. Organizers control stadium power. Fans control flights. These mega-events lean on offsets, not aviation reductions. FIFA faces the same problem that other organizers couldn’t easily resolve.
Thus, decarbonization becomes more complex. It also means progress may be slower compared to sectors with more direct control over emissions.
What a Credible Net Zero World Cup Requires
For FIFA’s net-zero goals to be credible, several conditions need to be met.
Emissions must be clearly measured and reported across all scopes. This includes full disclosure of total emissions before offsets are applied. Transparency is essential for trust.
There must also be a stronger focus on reducing emissions at source. While offsets can play a role, long-term progress depends on real reductions.
Independent verification of emissions data can improve credibility. Better coordination of travel and logistics can also help reduce unnecessary emissions.
In the long term, advances in low-carbon transport, including sustainable aviation fuels, may help reduce travel-related emissions.
Final Whistle: Can FIFA Turn Climate Targets Into Reality?
FIFA has set clear climate targets, including net zero emissions by 2040. These targets reflect growing pressure on global organizations to reduce their environmental impact.
However, the data shows a clear challenge. Most emissions from the World Cup come from indirect sources, especially global travel. Scope 3 emissions dominate the total footprint and remain difficult to control. This makes them the key factor in any net-zero strategy.
As the World Cup continues to grow in scale, emissions challenges will also increase. Operational improvements can reduce part of the impact, but they cannot fully address the larger system.
The future of football’s climate strategy will depend on how this gap is managed. The goal is not only to set targets, but also to achieve measurable and transparent progress in a global, complex system.
In this field, will FIFA lead or lag? We will watch this space closely.
Europe’s climate transition is entering a new phase. In the space of a few weeks, three major developments have emerged across the continent: the launch of the first commercial robotaxi service, a historic surge in electric vehicle (EV) sales, and another drop in carbon emissions under the EU’s flagship trading system.
Each story is different, but together, they point in the same direction. Europe is rapidly reshaping how people move, how energy is consumed, and how emissions are controlled. At the same time, the pace and stability of this transition remain uneven.
Robotaxis Arrive: Europe’s First Commercial Deployment
Europe has officially entered the autonomous mobility era. In Zagreb, the Croatian company Verne launched the first robotaxi service in Europe. This service uses the seventh-generation system from the Chinese firm Pony.ai. The service allows the public to book and pay for fully autonomous rides using the Verne app.
The launch marks a shift from testing to real-world deployment. The service operates in a defined zone of around 90 square kilometers across central Zagreb, including the airport. It runs daily from 7:00 a.m. to 9:00 p.m., according to company disclosures.
The fleet uses Arcfox Alpha T5 electric vehicles, built by BAIC and equipped with Pony.ai’s Gen-7 autonomous driving technology. For safety, trained operators stay in the front seat during this early rollout. The system is fully autonomous for passengers in the back.
Each vehicle carries up to two passengers per trip, reflecting the controlled nature of this early deployment stage.
Verne, a spin-off from Rimac Group, operates the fleet. The company was originally planning a custom-built robotaxi but has now launched using existing vehicle platforms. It has already tested dozens of prototype vehicles and is preparing for scale-up.
This launch is significant for Europe. Until now, autonomous ride-hailing has been largely concentrated in the United States and China. Europe has been slower due to stricter safety rules and regulatory frameworks.
But the commercial rollout changes that narrative. As Verne’s leadership noted, Europe now needs autonomous systems that move beyond pilots into real services.
Expansion is already planned. Partners plan to expand to thousands of robotaxis in over 20 cities worldwide. Uber will also help with future deployments and investment talks. This suggests Zagreb is not the endpoint, but the starting point.
EV Sales Break Records as Fuel Prices Surge
At the same time, Europe’s electric vehicle market is accelerating at an unexpected pace.
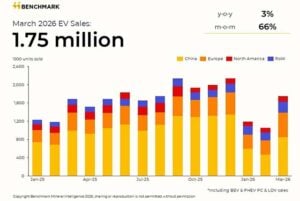
In March, the region hit over 500,000 monthly EV sales for the first time. Registrations jumped about 37% from last year, reaching nearly 540,000 units, based on data from Benchmark Mineral Intelligence. The region’s EV sales reached 1.2 million units in the first quarter, up 27% year-on-year.
This surge is not happening in isolation. Rising fuel costs are tied to geopolitical disruptions that have increased global oil prices. As petrol and diesel became more expensive, consumers increasingly shifted toward electric alternatives.
In Germany, the biggest car market in Europe, battery electric vehicle registrations soared 66.2% from last year. In March alone, over 70,000 units were registered, as reported by the Federal Motor Transport Authority (KBA). EVs now account for roughly 24% of all new car registrations in the country, overtaking petrol in monthly sales for the first time.
This is a major shift for a market that struggled just a year earlier. Germany cut subsidies in 2024, leading to a sharp drop in demand. Then, in 2026, it reversed the policy and reintroduced incentives of up to €6,000 for each electric vehicle. At the same time, fuel prices surged. Diesel crossed €2.50 per litre, one of the highest levels on record.
Elsewhere in Europe, similar trends are visible.
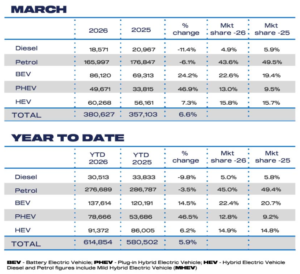
The UK saw 86,120 new battery electric vehicle registrations in March. This is a 24.2% increase compared to last year, according to the Society of Motor Manufacturers and Traders. EVs now represent over 22% of the UK market, although still below mandated targets for 2026.
Source: whicheve.net
Across the continent, fuel prices have become a key driver of change. Gasoline prices jumped about 17% in key EU countries. Diesel surged up to 30% in some areas. This followed supply issues tied to geopolitical tensions and unstable oil routes.
Even after oil prices eased from earlier peaks near $120 per barrel, they remain significantly above pre-crisis levels, keeping pressure on consumers.
Online car platforms show how quickly sentiment is shifting. EV searches and inquiries have surged in Germany, the UK, and Spain. This shows a rising consumer urgency, not just slow adoption.
But questions remain about durability. Previous fuel-driven EV surges have faded once prices stabilized. This time, however, structural forces are stronger: tighter EU emissions rules, more affordable EV models, and expanding charging infrastructure are reinforcing demand.
A key economic factor is running cost. In markets like Belgium, driving an EV now costs 45–56% less per kilometre than petrol or diesel vehicles when charged at home.
Emissions Continue to Fall—but Progress Is Uneven
While transport electrification accelerates, Europe’s emissions trend continues downward.
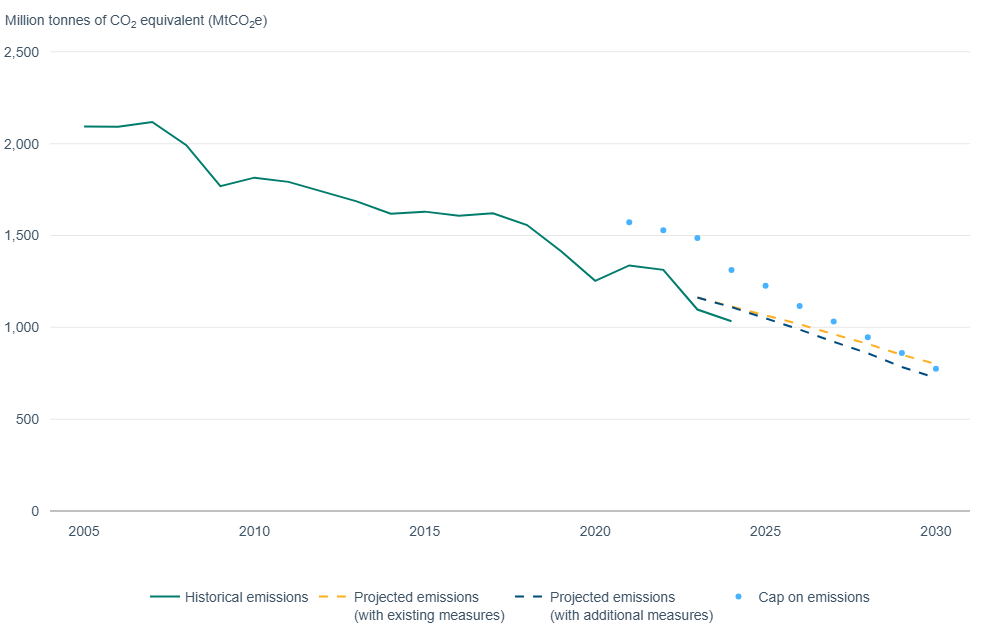
The European Commission reports that emissions under the EU Emissions Trading System (EU ETS) dropped by 1.3% in 2025. This decline continues a long-term trend in the bloc’s industrial and energy sectors.
The EU ETS covers around 45% of total EU greenhouse gas emissions, including power generation, heavy industry, aviation, and maritime transport. It operates under a declining cap system designed to force emissions reductions over time.
Since 2005, emissions in covered sectors have fallen by roughly 50%, placing the EU broadly on track toward its 2030 target of a 62% reduction.
Source: EU
A major driver of recent progress is the power sector. Renewables continue to expand rapidly. Solar generation rose over 20% in 2025. Together, wind and solar made up about 30% of EU electricity. This marked the first time they surpassed fossil fuels in total share.
Overall, renewables supplied roughly 48% of Europe’s electricity in 2025, compared with declining fossil fuel contributions. Coal has seen the sharpest decline, falling to just 9.2% of electricity generation, down from nearly 25% a decade ago.
However, the transition is not linear.
Natural gas usage has remained volatile, and in some cases increased, as it continues to play a balancing role in the energy system. Aviation emissions have also risen as travel demand recovered after the pandemic, highlighting one of the hardest sectors to decarbonize.
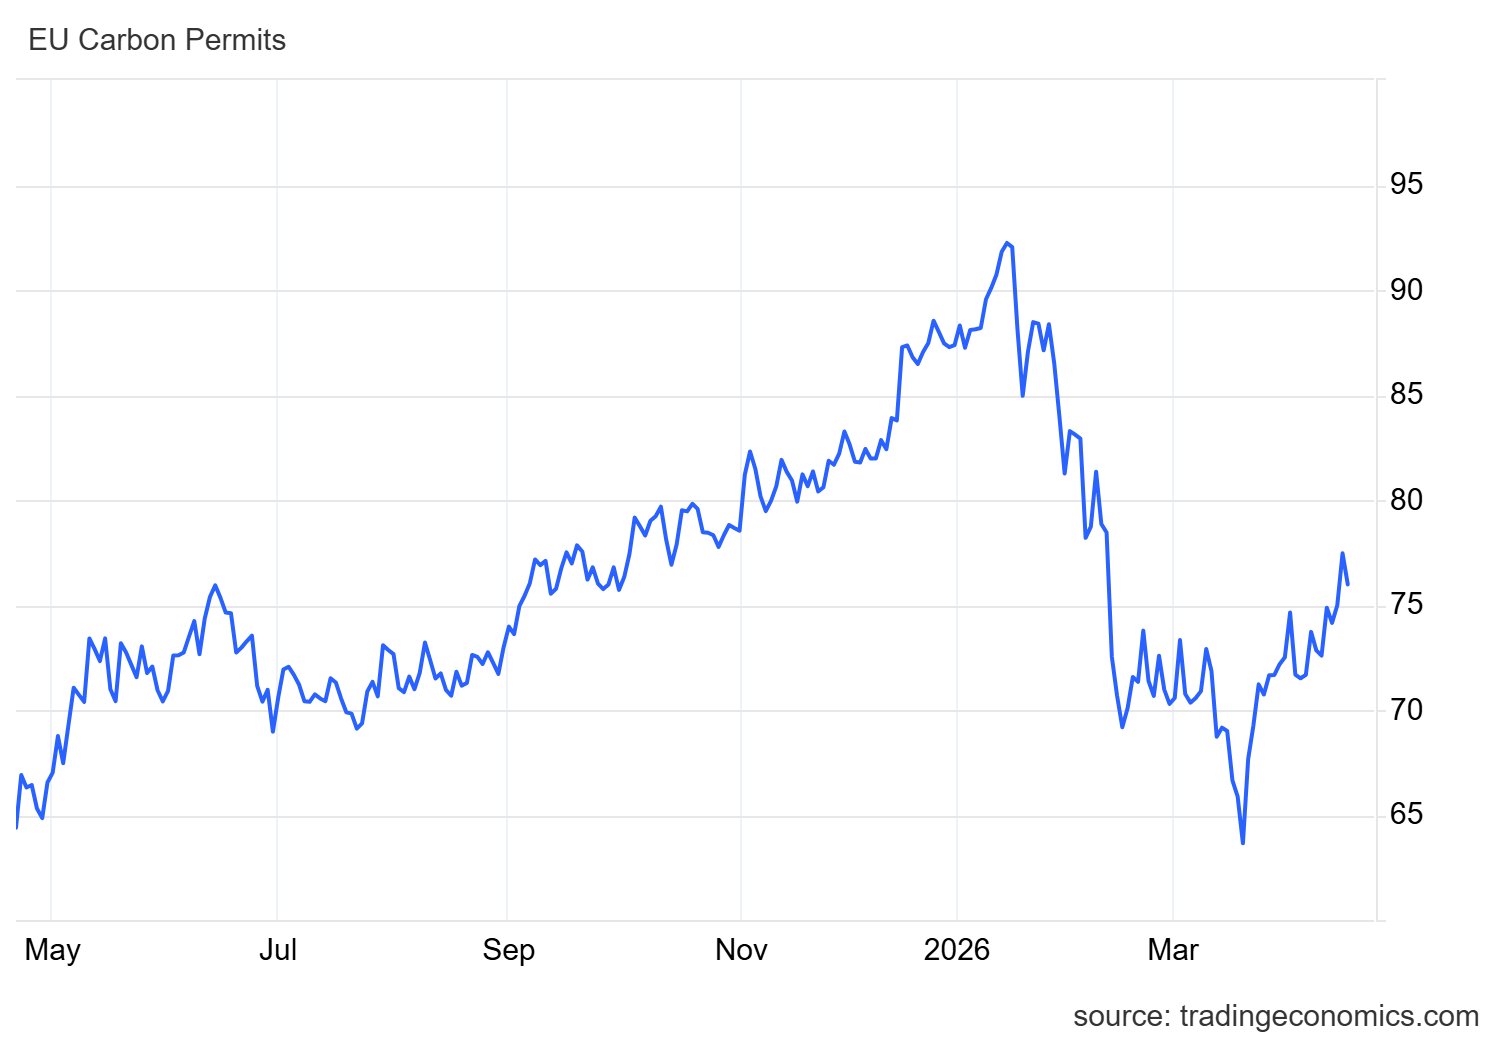
Carbon markets reflect this mixed picture. EU carbon allowance prices have remained around €70–75 per tonne, supported by steady demand but influenced by shifting energy dynamics.
A Transition Moving at Uneven Speeds
Taken together, these three developments reveal a Europe that is transforming quickly—but not evenly. Robotaxis in Zagreb show how fast mobility innovation is moving when regulation, technology, and investment align.
Record EV sales show how sensitive consumer behaviour is to energy prices, incentives, and infrastructure. And falling emissions show that policy frameworks like the EU ETS are still effective in driving long-term reductions.
But they also show limitations. Electrification is rising, but unevenly across countries. Emissions are falling, but not fast enough in harder sectors like aviation and gas-heavy power systems. And innovation is advancing, but still constrained by regulation and scale.
Europe’s climate transition is no longer theoretical. It is visible in cities, car markets, and industrial emissions data. The path forward may be complex, and there are constraints; still, progress is real.
Europe is not just decarbonizing but is redesigning how mobility, energy, and industry interact. And that process is only just beginning.
American EV maker Rivian and battery recycling leader Redwood Materials are showing how retired EV batteries can do more than power cars. Their new partnership at Rivian’s Illinois manufacturing plant uses second-life batteries as stationary energy storage, creating a model that could support factories, strengthen the grid, and lower electricity costs.
The project starts with more than 100 used Rivian battery packs. Together, they will deliver 10 megawatt-hours of dispatchable energy at Rivian’s Normal, Illinois facility. That stored energy will help the plant reduce electricity use during peak-demand periods, cut costs, and ease stress on the power system.
The numbers behind the opportunity are much larger. The press release reveals that by 2030, the U.S. is expected to need more than 600 gigawatt-hours of energy storage to support rising electricity demand, stabilize peak loads, and power expanding digital infrastructure. Simply put, it is equivalent to the total energy output of the Hoover Dam running continuously for two months.
Rivian Founder and CEO RJ Scaringe said,
“EVs represent a massive, distributed and highly competitive energy resource. As energy needs grow, our grid needs to be flexible, secure, and affordable. Our partnership with Redwood enables us to utilize our vehicle’s batteries beyond the life of a vehicle and contribute to grid health and American competitiveness.”
Second-Life Batteries Move Beyond Recycling
The Rivian-Redwood system gives retired EV batteries a second job before recycling. Redwood will integrate the battery packs into a stationary storage system using its Redwood Pack Manager software. The technology allows batteries with different levels of degradation and chemistries to work together safely.
This is important because EV batteries often remain healthy long after vehicles retire. Many can still serve for years as stationary storage assets. This creates a powerful circular economy model. Instead of going straight to recycling, batteries can generate added value while supporting energy needs.
Source: Redwood Materials
The supply potential is significant. Redwood already receives more than 20 GWh of batteries each year, equal to roughly 250,000 EVs. The company says that by 2030, end-of-life batteries could supply more than 50% of the entire energy storage market.
And this could make second-life batteries a major domestic energy resource.
JB Straubel, Redwood Materials Founder and CEO, also commented on this development. He said,
“Electricity demand is accelerating faster than the grid can expand, posing a constraint on industrial growth. At the same time, the massive amount of domestic battery assets already in the U.S. market represents a strategic energy resource. Our partnership with Rivian shows how EV battery packs can be turned into dispatchable energy resources, bringing new capacity online quickly, supporting critical manufacturing, and reducing strain on the grid without waiting years for new infrastructure. This is a scalable model for how we add meaningful energy capacity in the near term.”
The timing is critical because electricity demand is accelerating.
Artificial intelligence, cloud computing, and hyperscale data centers are pushing power demand sharply higher. Research from the Belfer Center cited,
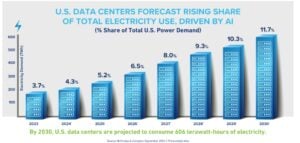
The Lawrence Berkeley National Laboratory predicts that data center demand will grow from 176 terawatt hours (TWh) in 2023 (or, about 4.4% of total U.S. electricity consumption) to between 325-580 TWh (6.7-12.0%) by 2028.
Secondly, according to the Battery Council International, data center demand is expected to quadruple by 2030, again driven by AI and cloud computing. This surge is one reason stationary battery systems are becoming essential.
Battery Energy Storage Systems, or BESS, help store electricity and release it when demand spikes. They support peak shaving, frequency regulation, microgrids, and backup power.
Uninterruptible Power Supply (UPS) systems play a different role. They provide immediate short-term power support for critical systems such as data centers, telecom networks, and emergency infrastructure, where even brief outages can cause major disruption.
Together, UPS and BESS are becoming critical to keeping digital infrastructure running.
Market Size
Speaking about market size, the global commercial and industrial battery energy storage market is forecast to reach $21 billion in value by 2036, driven by AI-fueled data center construction, according to research from Globe Newswire.
This is where the Rivian-Redwood model becomes useful. It connects second-life batteries to one of the fastest-growing needs in the energy system. The modular structure of repurposed battery systems may also allow faster deployment than traditional infrastructure, which can take years to build.
Circular Economy Meets Energy Security
The project also supports energy security. Using domestic battery assets for storage can reduce dependence on imported energy storage systems. It may also help defer billions of dollars in grid infrastructure upgrades. This is vital when the U.S. is looking for ways to expand electricity capacity faster.
Second-life batteries can also help during high-stress events. During heat waves or peak demand events, stored energy can be discharged instantly to reduce strain on the grid and avoid buying higher-cost electricity.
It creates economic and reliability benefits at the same time.
The partnership also shows how batteries are evolving from transportation assets into broader infrastructure assets. And this shift can have wide implications for manufacturing, utilities, defense facilities, and digital infrastructure.
Market Competition and Technology
Redwood faces competition from established players in the energy storage market. Tesla has been running Megapack as a first-life business, while Redwood is building a parallel market in second-life batteries.
The Redwood Pack Manager technology acts as specialized software that enables battery packs with different degradation levels and chemistries to work together safely. This capability is crucial for second-life applications where batteries have varying performance characteristics.
Second-life batteries are gaining traction in industrial applications. Battery costs have fallen to historic lows, making these projects increasingly viable economically.
A Blueprint for the Next Phase of Clean Energy
Rivian and Redwood’s 10 MWh deployment represents a practical solution to two major challenges: managing retired EV batteries and meeting surging industrial energy demand. The project demonstrates how automakers can extract additional value from their battery investments while supporting grid stability.
As AI-driven electricity demand continues climbing and EV adoption accelerates, second-life battery projects could become standard practice across the automotive industry. The success of this Illinois pilot may influence how other manufacturers approach end-of-life battery management, creating a new revenue stream while supporting America’s clean energy transition
This project suggests one answer is to connect those two problems. Old EV batteries can become new energy infrastructure.
Disseminated on behalf of Alaska Energy Metals Corporation
The global nickel market is shifting fast. Years of oversupply pushed nickel prices lower and delayed new mining investments. But recent price gains suggest the cycle may be turning. In early 2026, nickel prices jumped about 18% in a single month, highlighting how sensitive the market is to supply expectations.
For investors, this shift creates a high-risk, high-reward opportunity. Early-stage developers advancing projects today could benefit disproportionately when deficits emerge. Alaska Energy Metals Corporation (AEMC) sits at the center of this narrative, with its Nikolai Nickel Project moving toward a Preliminary Economic Assessment (PEA) in 2026 and growing momentum in the U.S. critical minerals policy landscape.
Nickel Prices Are Rising, and the Market Is Fragile
Nickel’s recent rally reflects growing concerns about future supply. Indonesia dominates global nickel production, and any policy shift there can move prices instantly. Markets reacted strongly to speculation about Indonesian output controls, showing how fragile the supply balance remains.
Despite today’s inventories, analysts warn that the world will need massive investment to meet future demand. Estimates suggest roughly $66 billion in global nickel supply chain investment may be required to avoid shortages later this decade.
This gap creates a structural opportunity. Low prices discourage new mines today, but demand from EVs, grid storage, and stainless steel continues to rise. And companies advancing projects during the downturn could benefit when the cycle flips.
Nikolai Nickel Project: A Strategic U.S. Critical Minerals Asset
AEMC’s flagship Nikolai Nickel Project in Alaska ranks among the largest undeveloped nickel resources in the United States. The project also contains copper, cobalt, chromium, platinum, palladium, and iron, making it a polymetallic critical minerals asset.
This resource mix strengthens the investment case. Nickel and cobalt are essential for batteries. Platinum group metals support hydrogen and industrial applications. Chromium and iron add potential by-product revenue streams.
Thus, domestic critical minerals projects like Nikolai are becoming strategic priorities as governments seek to reduce reliance on foreign supply chains.
New Work Program Accelerates Path to PEA
In October 2025, AEMC closed a $1 million non-brokered private placement, issuing roughly 11.8 million units at $0.085 per unit. Each unit included one common share and one warrant exercisable until October 2030. Insider participation and no finder’s fees signaled management confidence in the project.
The company outlined a focused work program designed to move Nikolai toward economic evaluation:
Metallurgical studies to produce concentrates
Hydrometallurgical testing to assess on-site metal production
Permitting for road extensions and camp upgrades
Internal economic evaluations for a PEA
Planning for a 2026 field program and investor outreach
These steps are critical. Metallurgy, infrastructure, and early economics determine whether large deposits can become mines.
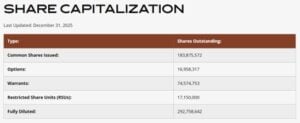
The current share structure shows:
Source: AEMC
Hydrometallurgy, RecycLiCo, and Lucid Partnership Add Value
AEMC’s Memorandum of Understanding with RecycLiCo Battery Materials adds a downstream processing angle. RecycLiCo’s U.S. subsidiary will test whether its hydrometallurgical technology can refine metals from Nikolai ore.
Alongside, the nickel miner has also signed an MOU with Lucid Group, Inc (NASDAQ: LCID), maker of the world’s most advanced electric vehicles.
AEMC confirmed hydrometallurgical studies as part of its development plan. On-site refining could reduce reliance on foreign smelters, improve margins, and strengthen U.S. supply chain security.
Integrated mining and refining projects often command premium valuations. They also attract government support and strategic partnerships.
U.S. policy momentum around critical minerals accelerated during former President Donald Trump’s administration and continues to influence today’s strategy. Trump’s executive orders declared critical minerals a national security priority and directed federal agencies to support domestic mining, processing, and recycling.
This policy shift led to:
Funding programs under the Defense Production Act
Streamlined permitting initiatives
Federal grants for mining, processing, and battery supply chains
Public-private partnerships for domestic critical minerals
These initiatives laid the foundation for today’s expanded funding and permitting reforms. Projects like Nikolai align directly with this policy framework, positioning AEMC to benefit from federal incentives, grants, and offtake partnerships.
Nikolai is listed on the U.S. Permitting Council’s FAST-41 Transparency Dashboard. FAST-41 aims to accelerate permitting and improve coordination across federal agencies.
AEMC has also reported ongoing engagement with U.S. government departments regarding Nikolai’s role in domestic supply chains. This alignment matters for investors. Government backing can reduce permitting risk, unlock funding, and attract strategic partners.
Emily Domenech, Permitting Council Executive Director.
“I am excited to welcome the Nikolai Nickel project to the FAST-41 program. We are proud to support more mining projects that will strengthen the U.S. economy and reduce our reliance on foreign nations. I look forward to working with the Alaska Energy Metals Development Corporation to provide a transparent and predictable federal permitting process while achieving President Trump’s vision for American energy dominance.”
2026 PEA: A Major Valuation Catalyst
AEMC has initiated internal scoping studies to evaluate mining rates, sequencing, and economics. Early plans focus on extracting higher-grade near-surface zones first to improve project economics.
The Preliminary Economic Assessment is a major milestone. It converts geological resources into financial metrics like net present value and internal rate of return. Mining equities often re-rate significantly after a credible PEA.
With a PEA targeted for 2026, AEMC could hit this milestone as nickel markets tighten—a powerful combination for valuation.
Valuation Leverage to Nickel Prices
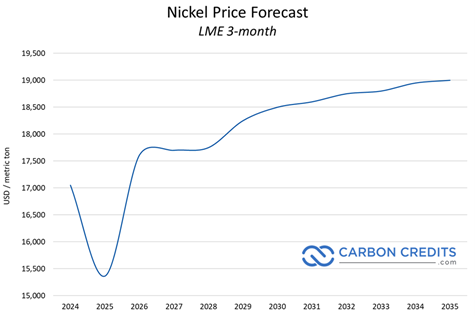
Junior miners offer strong leverage to commodity prices. A 10–20% increase in nickel prices can dramatically improve project economics for bulk tonnage deposits. The recent 18% monthly nickel rally highlights how quickly sentiment can change. If prices stabilize near $18,000–$20,000 per tonne, project valuations could rise sharply.
Key upside catalysts include:
Sustained nickel price recovery
Positive metallurgical and hydromet results
Completion of the PEA
Permitting and infrastructure progress
Government funding or strategic partnerships
Each milestone reduces risk and increases valuation multiples.
Macro Tailwinds: EVs, Grid Storage, and Infrastructure
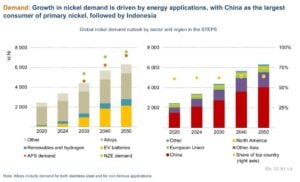
Stainless steel demand also continues to grow with global infrastructure and urbanization. Combined demand growth will strain supply, especially as Indonesian ore grades decline and regulatory pressures increase.
Western governments are pushing to localize critical minerals supply chains. This macro backdrop supports long-term bullish scenarios for domestic nickel developers.
Source: IEA
M&A and Strategic Optionality
Large miners, automakers, and battery manufacturers increasingly seek secure North American supply. Nikolai’s scale, polymetallic (high-grade Ni-Cu-PGE massive sulphide mineralization) profile, and location make it a potential joint venture or acquisition target.
Downstream processing partnerships further increase strategic value. Domestic refining capability could attract OEMs, defense contractors, and federal agencies seeking supply security.
This optionality adds upside beyond commodity price appreciation.
Investment Outlook: From Oversupply to Opportunity
The nickel market’s surplus today hides a structural supply challenge. Massive investment is needed to meet electrification demand, yet low prices discourage new projects. This disconnect creates asymmetric opportunities for developers advancing projects during downturns.
AEMC’s Nikolai Nickel Project sits at the intersection of rising demand, domestic supply chain policy, and improving market sentiment. The company has secured financing, launched metallurgical and hydromet studies, engaged government stakeholders, and targeted a 2026 PEA.
Trump-era critical minerals policies and ongoing federal funding programs further strengthen the domestic mining investment thesis. If nickel prices continue to recover and AEMC delivers on technical milestones, the company could see a significant valuation re-rating.
In a world racing to electrify and localize supply chains, domestic nickel developers are becoming strategic assets. AEMC could emerge as one of the most leveraged plays on America’s critical minerals push.
To sum up, AEMC CEO Gregory Beischer commented,
“The cost and time savings for further exploration and development once ground access is established will be quite significant. It is very encouraging to see proactive streamlining and coordination amongst permitting agencies. We are grateful to the Permitting Council for including the Nikolai Nickel project in the FAST-41 program. With Nikolai hosting six Critical Minerals – nickel, cobalt, copper, chromium, platinum and palladium, two of which, nickel and cobalt, are Defense Production Act Title III materials deemed to be in shortfall, we are extremely well aligned with the U.S. national security objective of developing long-lived, domestic sources of metals and minerals essential to the national economy and national defense. Nikolai is a project potentially capable of significantly reducing US nickel and cobalt import dependency and vulnerability.”
New Era Publishing Inc. and/or CarbonCredits.com (“We” or “Us”) are not securities dealers or brokers, investment advisers, or financial advisers, and you should not rely on the information herein as investment advice. Alaska Energy Metals. (“Company”) made a one-time payment of $90,000 to provide marketing services for a term of three months. None of the owners, members, directors, or employees of New Era Publishing Inc. and/or CarbonCredits.com currently hold, or have any beneficial ownership in, any shares, stocks, or options of the companies mentioned.
This article is informational only and is solely for use by prospective investors in determining whether to seek additional information. It does not constitute an offer to sell or a solicitation of an offer to buy any securities. Examples that we provide of share price increases pertaining to a particular issuer from one referenced date to another represent arbitrarily chosen time periods and are no indication whatsoever of future stock prices for that issuer and are of no predictive value.
Our stock profiles are intended to highlight certain companies for your further investigation; they are not stock recommendations or an offer or sale of the referenced securities. The securities issued by the companies we profile should be considered high-risk; if you do invest despite these warnings, you may lose your entire investment. Please do your own research before investing, including reviewing the companies’ SEDAR+ and SEC filings, press releases, and risk disclosures.
It is our policy that information contained in this profile was provided by the company, extracted from SEDAR+ and SEC filings, company websites, and other publicly available sources. We believe the sources and information are accurate and reliable but we cannot guarantee them.
CAUTIONARY STATEMENT AND FORWARD-LOOKING INFORMATION
Certain statements contained in this news release may constitute “forward-looking information” within the meaning of applicable securities laws. Forward-looking information generally can be identified by words such as “anticipate,” “expect,” “estimate,” “forecast,” “plan,” and similar expressions suggesting future outcomes or events. Forward-looking information is based on current expectations of management; however, it is subject to known and unknown risks, uncertainties, and other factors that may cause actual results to differ materially from those anticipated.
These factors include, without limitation, statements relating to the Company’s exploration and development plans, the potential of its mineral projects, financing activities, regulatory approvals, market conditions, and future objectives. Forward-looking information involves numerous risks and uncertainties and actual results might differ materially from results suggested in any forward-looking information. These risks and uncertainties include, among other things, market volatility, the state of financial markets for the Company’s securities, fluctuations in commodity prices, operational challenges, and changes in business plans.
Forward-looking information is based on several key expectations and assumptions, including, without limitation, that the Company will continue with its stated business objectives and will be able to raise additional capital as required. Although management of the Company has attempted to identify important factors that could cause actual results to differ materially, there may be other factors that cause results not to be as anticipated, estimated, or intended.
There can be no assurance that such forward-looking information will prove to be accurate, as actual results and future events could differ materially. Accordingly, readers should not place undue reliance on forward-looking information. Additional information about risks and uncertainties is contained in the Company’s management’s discussion and analysis and annual information form for the year ended December 31, 2025, copies of which are available on SEDAR+ at www.sedarplus.ca.
The forward-looking information contained herein is expressly qualified in its entirety by this cautionary statement. Forward-looking information reflects management’s current beliefs and is based on information currently available to the Company. The forward-looking information is made as of the date of this news release, and the Company assumes no obligation to update or revise such information to reflect new events or circumstances except as may be required by applicable law.
Disclosure: Owners, members, directors, and employees of carboncredits.com have/may have stock or option positions in any of the companies mentioned: .
Additional disclosure: This communication serves the sole purpose of adding value to the research process and is for information only. Please do your own due diligence. Every investment in securities mentioned in publications of carboncredits.com involves risks that could lead to a total loss of the invested capital.
Apple’s latest Environmental Progress Report shows a clear shift in how the company is approaching sustainability. It shows that 30 percent of materials across all products shipped in 2025 came from recycled content, up from the previous year. This represents a steady year-on-year increase of around 6% points, showing consistent progress rather than one-time gains.
The company now uses 100% recycled cobalt in all its batteries. It also uses 100% recycled rare earth elements in all magnets. All of these show how circular manufacturing is becoming a core part of the way Apple designs, builds, and scales its products.
The shift reflects a broader strategy. The tech giant is working to reduce reliance on virgin mining and move toward a more circular supply chain. This is central to its long-term goal of reaching carbon neutrality across its entire value chain by 2030.
Recycled Materials Move Into Core Product Architecture
The most important change is not just how much recycled material Apple uses, but where it is being used. In its newest product line, including the MacBook Neo, Apple has significantly increased recycled content in critical components. According to the company’s 2026 Environmental Progress Report:
Around 90% of the aluminum in the MacBook Neo enclosure is recycled
100% of cobalt in Apple-designed batteries is recycled
The device overall reaches around 60% recycled content across key materials
These figures matter because aluminum and cobalt are among the most carbon-intensive materials in electronics manufacturing. Primary aluminum production uses a lot of energy. Cobalt extraction causes high emissions and comes with supply chain risks.
By shifting toward recycled inputs, Apple reduces emissions at the earliest stage of production. And that’s before devices are even assembled. This approach is part of a broader design philosophy.
The iPhone maker is increasingly engineering products around material recovery, not just performance or cost. That shift is central to its decarbonization strategy.
Emissions Avoidance Becomes a Key Climate Lever
Apple’s report highlights a clear link between recycled materials and emissions reduction.
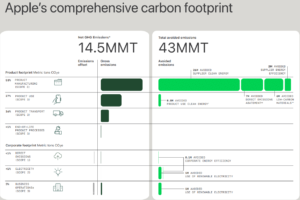
In 2024, the company says that its use of recycled and lower-carbon materials helped avoid 6.2 million metric tons of greenhouse gas emissions. Over the same period, Apple’s total carbon footprint was 15.1 million metric tons. This means that material strategy alone accounted for a meaningful portion of the emissions reduction impact.
The logic is straightforward. When recycled materials replace virgin mining and refining, emissions fall sharply. This is especially important for metals like aluminum, copper, and cobalt, which carry high embedded carbon.
Source: Apple
Apple is effectively shifting emissions reductions upstream — reducing impact before manufacturing even begins.
Meet Daisy, Dave & Cora: The Robots Powering Apple’s Recycling Revolution
A key part of Apple’s system is automation in recycling. The company has developed a set of specialized robotics platforms designed to recover materials from used devices at scale.
The first system, Daisy, can disassemble up to 36 different iPhone models and process as many as 1.2 million devices per year. Engineers designed it to efficiently recover high-value components that traditional recycling systems often miss.
Another system, Dave, focuses on dismantling the taptic engine, a component rich in rare earth magnets, tungsten, and steel. These materials are critical for electronics production but difficult to recover without precision engineering.
The newest system, Cora, expands Apple’s recycling capability further. It uses smart shredding and sensor sorting to boost recovery rates for more types of materials.
Together, these systems form a structured recovery pipeline. Devices returned through Apple’s trade-in and recycling programs are not simply dismantled. They are processed with the goal of reintroducing materials back into future product cycles.
This is a key shift. Instead of linear production — mine, build, dispose — Apple is moving toward closed-loop manufacturing.
Why Materials Are Now the Heart of Apple’s Net-Zero Plan
Apple’s recycled materials strategy is directly tied to its climate target.
The company aims to be carbon neutral by 2030. This commitment includes its business, supply chain, and product lifecycle. It also includes not just its own operations but also supplier emissions and product use emissions.
Source: Apple
Within this framework, materials and manufacturing are the largest drivers of Apple’s emissions. The company’s lifecycle analysis reveals that most of its carbon footprint comes from product manufacturing. This mainly happens in Scope 3 supply chain activities like raw material extraction, component production, and assembly.
Apple also sees materials, electricity, and transportation as the top three sources of product emissions. Materials are key because metals like aluminum, cobalt, and rare earth elements have high carbon intensity.
This is why recycled content is central to Apple’s decarbonization roadmap. It reduces emissions in Scope 3 categories, which are typically the hardest to control.
Apple has also pushed suppliers to adopt renewable energy and lower-carbon production methods, particularly in high-impact manufacturing regions. This creates two ways to reduce emissions: cleaner energy and cleaner inputs.
Emissions Profile Shows Progress, But Not a Straight Line
Apple’s emissions profile reflects both progress and complexity. The company’s total footprint is in the tens of millions of metric tons each year, reflecting the scale of its global operations.
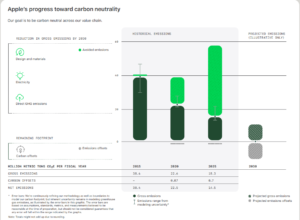
In 2025, the company reported a total net carbon footprint of 14.5 million metric tons of CO₂e, down from 15.3 million metric tons of gross emissions before offsets.
Product manufacturing is still the main source of emissions, accounting for the largest share of emissions within Scope 3. In fact, manufacturing alone contributed about 8.15 million metric tons of CO₂e, or more than half of total product lifecycle emissions.
Source: Apple
However, Apple reports gradual reductions in emissions intensity per product over time. Emissions have dropped by over 60% since 2015, while revenue has risen sharply during this time.
This means each device is now easier to make with less carbon. Total emissions can still change based on product cycles and demand.
The increasing use of recycled materials is a key driver of this improvement. It reduces the need for mining, refining, and high-energy processing — all of which sit upstream in the supply chain.
However, Apple’s emissions trajectory is not linear. Like many hardware companies, its reach depends on global demand, new product launches, and supply chain limits. This makes structural changes like material redesign more important than incremental operational gains.
Apple’s Carbon Credit Portfolio
Moreover, Apple uses carbon credits in a targeted way to address a small portion of its remaining emissions as it works toward its 2030 net-zero goal. The 2026 Environmental Progress Report states that the company retired verified credits from nature-based projects in 2025.
The portfolio includes the Lumin/Eucapine reforestation project in Uruguay, which accounted for 422,395 metric tons CO₂e (vintage 2020). It also includes the Windrock Improved Forest Management project in the United States, covering 319,785 metric tons CO₂e (vintage 2022).
These projects focus on restoring degraded land, improving forest management, and increasing long-term carbon sequestration. Apple sees carbon credits as a complement, not as substitutes, to its main decarbonization strategy.
This strategy focuses on reducing emissions first. It emphasizes using recycled materials, renewable energy, and improving the supply chain. Only after these efforts does Apple use high-quality credits to tackle leftover emissions.
The Real Shift: Apple Is Redesigning How Electronics Are Made
Apple’s recent report shows a clear direction for tackling its environmental footprint. The company is no longer treating sustainability as an external offset mechanism. Instead, it is embedding it directly into product architecture.
The increase to 30% recycled materials in products shows a big change in how the tech giant makes things. Key parts, like cobalt and aluminum, are almost entirely made from recycled content. Robotics-driven recycling systems reinforce this direction, creating a closed-loop system where old devices feed directly into new production.
At the same time, Apple’s emissions profile shows both progress and constraint. Reductions are real, but scaling global hardware production means absolute emissions remain significant.
Still, the direction is clear. Apple is moving away from linear electronics manufacturing and toward a circular model where materials are continuously recovered, reused, and reintroduced into production.
In doing so, it is reshaping what sustainability looks like in the global tech industry — not as an add-on, but as a design principle built into the product itself.
On April 18th, Reuters reported that the U.S. direct air capture (DAC) sector received a major boost after the Department of Energy (DOE) decided to retain funding for two flagship carbon removal hubs originally backed under the Biden administration.
The move removes months of uncertainty and protects more than $1 billion in federal support for the South Texas DAC Hub and Louisiana’s Project Cypress. The decision also reinforces that carbon removal remains part of the United States’ long-term climate and industrial strategy, even as policy priorities evolve.
From Funding Risk to Revival: DOE Keeps Landmark Direct Air Capture Hubs Moving Forward
The Department of Energy had previously placed several clean energy awards under review, including major carbon capture, hydrogen, and industrial decarbonization projects. Among the most closely watched were the two large DAC hubs in Texas and Louisiana, both of which risked losing federal backing.
South Texas DAC Hub, developed with Occidental’s carbon management arm 1PointFive, holds a $500 million federal award.
Project Cypress in Louisiana received $550 million in support.
Although both projects were awarded significant funding, only an initial $50 million tranche had been disbursed so far, leaving most capital still pending deployment.
Once fully operational, both facilities are expected to remove more than 2 million metric tons of CO₂ annually from the atmosphere. That scale places them among the most ambitious carbon removal projects globally and positions the United States as a leader in early DAC commercialization.
Energy Secretary Chris Wright noted that the agency retained projects with credible delivery pathways following extensive review discussions with applicants. The DOE’s Hydrocarbons Geothermal and Energy Office will now help guide next steps, including fund disbursement and project execution.
U.S. Direct Air Capture Market Gains Policy and Investment Support
The funding confirmation strengthens confidence across the growing U.S. DAC ecosystem, which depends heavily on long-term policy signals and federal incentives.
The country already leads global carbon removal development, supported by programs such as the $3.5 billion DAC Hubs initiative and the Section 45Q tax credit, which can provide up to $180 per ton for permanent carbon storage under current structures.
In parallel, corporate demand for high-quality carbon removals continues to expand. Technology firms, airlines, and industrial players are signing long-term agreements to secure carbon removal supply, reflecting a shift from low-cost avoidance credits toward durable carbon storage solutions.
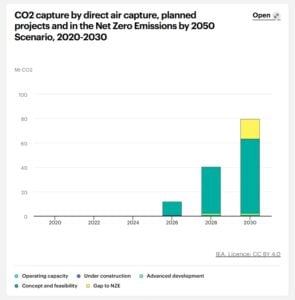
According to the International Energy Agency (IEA), more than 130 large-scale DAC facilities are now in development globally, with the United States holding a significant share of planned capacity. This pipeline highlights growing commercial interest even as the technology remains in its early deployment phase.
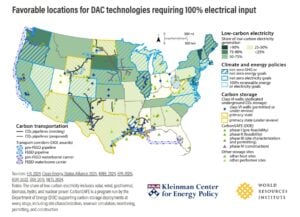
At the same time, regional DAC clusters are beginning to take shape. West Texas, for example, has emerged as a leading hub due to its combination of renewable energy access, subsurface storage potential, and industrial infrastructure. Projects like STRATOS, targeting 500,000 tons of annual CO₂ capture, illustrate how scaling could evolve through concentrated deployment.
Source: IEA
DAC Cost Challenges and Fuel Market Link Drive Long-Term Outlook
Despite strong policy backing, cost remains the most significant barrier for direct air capture expansion. Current estimates place DAC costs between $500 and $1,000 per ton of CO₂ removed, depending on technology type, energy sourcing, and storage logistics. While costs are expected to decline with scale and innovation, near-term economics remain challenging.
From Carbon Credits to SAF, DAC’s Business Case Is Getting Stronger
However, the value proposition is expanding beyond carbon credits. Captured CO₂ is increasingly viewed as a potential feedstock for synthetic fuels, including sustainable aviation fuel (SAF). This integration could improve project economics while also supporting fuel supply diversification.
Recent geopolitical tensions affecting global oil markets have added further urgency to alternative fuel development. In this context, DAC-linked synthetic fuel production could play a dual role by reducing emissions while supporting energy security.
Texas and Louisiana Lead the Transition
Texas and Louisiana are particularly well-positioned for this transition. Both states offer strong industrial infrastructure, access to geologic storage formations, and proximity to energy and chemical industries. Texas also benefits from expanding renewable energy capacity, which is important for powering energy-intensive DAC systems.
Even so, scaling from today’s million-ton projects to gigaton-scale removal pathways will require sustained investment, policy support, and continued technological improvements. Some research suggests that large-scale DAC deployment may still require carbon prices or subsidies above $200 per ton for economic viability in the early phases.
Thus, the DOE’s decision to keep funding for the South Texas and Louisiana DAC hubs signals stability for a sector still shaping its commercial future. While cost and scale challenges remain, rising demand, broader policy support, and growing industrial interest suggest DAD is moving from experimental climate technology toward early-stage infrastructure development in the United States.
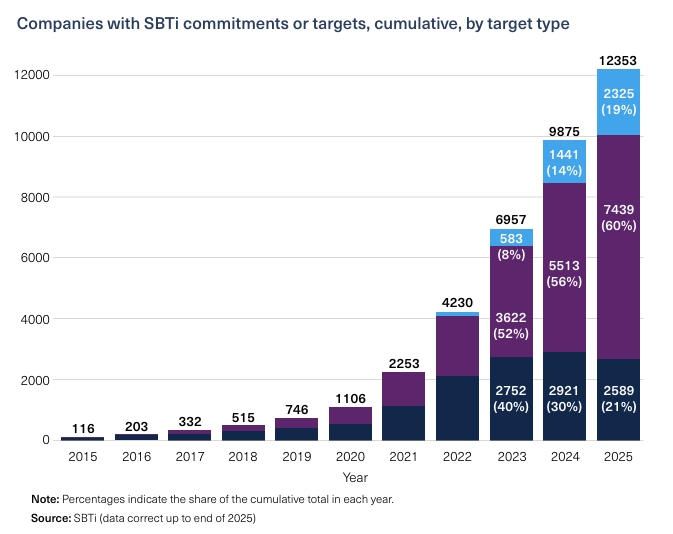
Corporate climate action is no longer a niche effort. It is now a core business strategy. Fresh data from the Science Based Targets initiative (SBTi) confirms this shift. By January 2026, nearly 10,000 companies had validated science-based targets. Even more striking, over 12,000 firms had either set or committed to setting these goals by the end of 2025.
This momentum reflects a clear trend. Companies are aligning faster with climate science. They are also embedding net-zero goals into long-term planning. Despite economic uncertainty, the pace of adoption continues to rise. That signals a structural change in how businesses view emissions, risk, and growth.
Rapid Rise: 2025 Marks a Breakout Year
The year 2025 stands out as a major growth phase. The number of companies with validated science-based targets increased by 40% year over year. At the same time, firms adopting both near-term and net-zero targets surged by 61%.
Target-Setting Critical Mass: Global Growth of Companies with Validated Targets and Active Commitments
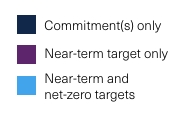
These numbers tell a simple story. Businesses are not just making promises. They are moving toward validated, science-backed action. Interestingly, the number of companies that only committed to targets remained stable. This suggests a shift away from pledges toward measurable progress.
As a result, the SBTi crossed a major milestone in early 2026. It surpassed 10,000 validated companies. That achievement highlights how quickly climate accountability is becoming mainstream.
While Europe still dominates in total numbers, Asia is now the fastest-growing region. In 2025 alone, the region recorded a 53% increase in companies with validated targets. This growth puts Asia on par with Europe in terms of expansion speed.
Countries like China, Japan, Taiwan, and India led among high-penetration markets. At the same time, emerging economies such as Indonesia, Pakistan, Singapore, Thailand, and South Korea showed strong gains. These markets are moving quickly from low adoption to rapid scaling.
Refer to the chart below to understand the current shift.
Asian Territories’ Target-Setting Cements: High Penetration Markets Continue to Dominate, Lower Penetration Territories Become More Prominent
This shift matters. It shows that climate ambition is no longer concentrated in Western economies. Instead, it is spreading across emerging markets. As supply chains globalize, this broader participation strengthens overall impact.
Meanwhile, other regions are not far behind. Africa grew by 48%, while Latin America and the Caribbean saw a 42% rise. Europe still holds the largest share, accounting for 49% of all targets. Asia follows with 36%, and North America trails at 11%.
Market Leaders: Who Is Driving Adoption?
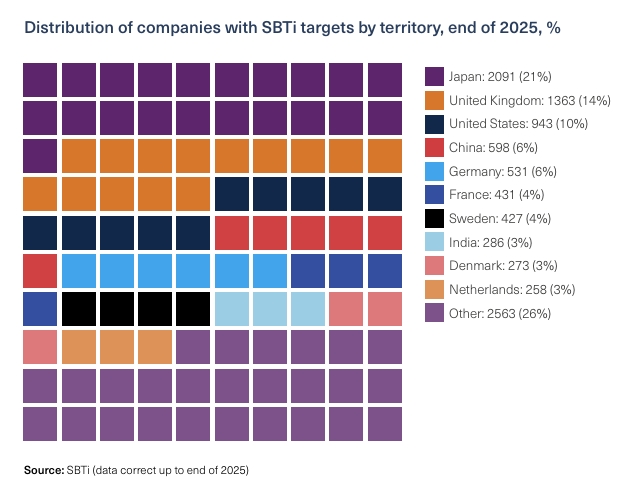
Some countries and markets stand out. Japan leads globally with over 2,000 companies holding validated targets. The United Kingdom and the United States follow behind.
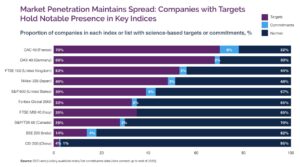
In financial markets, Europe shows the strongest penetration. Major indices such as France’s CAC 40, Germany’s DAX 40, and the UK’s FTSE 100 lead adoption. These benchmarks reflect how deeply climate goals are embedded in European corporate strategy.
However, global benchmarks like the Nikkei 225 and S&P 500 are catching up. The Forbes Global 2000 also shows rising participation. This indicates that the world’s largest companies are increasingly aligning with science-based frameworks.
Sector Momentum: Healthcare, Tech, and Materials Step Up
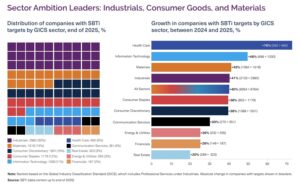
Growth is not limited to regions. It is also spreading across industries. In 2025, healthcare led sectoral expansion. This is notable because the sector has traditionally been slower to decarbonize.
At the same time, information technology and materials sectors showed strong momentum. These industries play a key role in global supply chains. Their progress can drive wider emissions reductions across multiple sectors.
This trend highlights an important point. Climate action is no longer confined to energy or heavy industry. It now spans both service-based and industrial sectors. That broad participation increases the chances of meeting global climate goals.
Understanding the Net-Zero Standard: A Clear Framework
The key pillar of this growth is the SBTi’s Corporate Net-Zero Standard. This framework gives companies a structured way to set and achieve net-zero targets.
The standard focuses on alignment with climate science. Specifically, it requires companies to follow pathways consistent with limiting global warming to 1.5°C. That ensures targets are not just ambitious, but also credible.
To reach net zero, companies must do two things. First, they must deeply reduce emissions across their operations and value chains. This includes Scope 1, 2, and 3 emissions. Second, they must address any remaining emissions through permanent neutralization.
In simple terms, net zero is not about offsetting everything. It is about cutting emissions as much as possible first. Only then can companies neutralize the small amount that remains.
Four Pillars of Corporate Net Zero
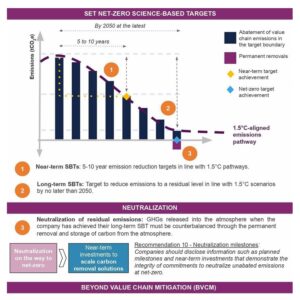
The SBTi framework is built on four key elements. Together, they define a complete net-zero strategy.
First, companies must set near-term targets. These drive immediate emissions reductions. Second, they need long-term targets that align with net-zero timelines. These ensure sustained progress.
Third, companies must neutralize residual emissions. This step addresses emissions that cannot be eliminated. Finally, firms are encouraged to go beyond their value chains. This is known as beyond value chain mitigation (BVCM).
BVCM includes actions like investing in climate solutions outside a company’s direct operations. While not mandatory, it plays a critical role in supporting global climate goals.
Source: SBTi
Why This Growth Matters Now
The rapid rise in science-based targets signals a deeper shift. Climate action is becoming a standard part of business strategy. It is no longer driven only by regulation or reputation.
Instead, companies see clear benefits. These include risk management, investor confidence, and long-term resilience. As a result, climate targets are now tied to financial and operational decisions.
Moreover, the growing alignment across regions and sectors increases impact. When more companies follow the same science-based approach, collective progress accelerates.
Challenges Ahead: Growth Meets Complexity
Despite strong momentum, challenges remain. Setting targets is only the first step. Delivering real emissions reductions is far more complex.
Companies must deal with supply chain emissions, technology gaps, and policy uncertainty. In addition, measuring and verifying progress can be difficult.
However, the structured approach of the SBTi helps address these issues. Providing clear guidance reduces confusion and improves consistency. That makes it easier for companies to move from ambition to action.
The Bottom Line: From Momentum to Mainstream
David Kennedy, Chief Executive Officer of the Science-Based Targets initiative, said:
“There is clear evidence about the business benefits of science-based target-setting—this is a key lever for companies to manage transition risk and strengthen business resilience, remaining competitive now and in the future. The data in this report shows that despite political headwinds, increasing numbers of companies in every region are setting science-based targets. In doing so they are part of a market transformation that is good for business while contributing to achieving global climate objectives.”
In conclusion, the latest data paints a clear picture. Corporate climate action is scaling rapidly. With nearly 10,000 validated companies, the SBTi milestone marks a new phase.
More importantly, growth is no longer limited to a few regions or sectors. It is global, diverse, and accelerating. Asia’s rise, sector-wide adoption, and strong frameworks all point in the same direction.
Looking ahead, the focus will shift from target-setting to execution. Companies will need to turn commitments into measurable results. If they succeed, the current momentum could drive real progress toward global net zero.
In short, the era of climate pledges is fading. The era of climate delivery has begun.
Australia’s reformed Safeguard Mechanism is reshaping how large industrial emitters manage carbon. The policy, updated in 2023, sets declining emissions limits for the country’s biggest facilities, including mining and energy operations. Companies that exceed their baselines must either cut emissions or purchase carbon credits.
This has triggered a sharp rise in demand for Australian Carbon Credit Units (ACCUs). According to the Australian government, the Safeguard Mechanism covers about 215 facilities, responsible for roughly 28% of Australia’s total greenhouse gas emissions. These sites must collectively reduce emissions by 4.9% per year through 2030.
Instead of cutting emissions immediately, many companies are turning to carbon credits to stay compliant. This includes major players like Rio Tinto and Woodside Energy, which are among the largest emitters in the system.
Mining Giants are the Biggest Buyers of Australia’s Carbon Credits
The mining and energy sectors dominate Australia’s emissions profile. Together, they account for a large share of industrial output and carbon intensity.
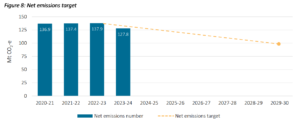
Under the Safeguard Mechanism, companies can use ACCUs or Safeguard Mechanism Credits (SMCs) to offset emissions above their limits. This flexibility has led to a surge in credit purchases. Moreover, entities covered by this scheme must cut net emissions to 100 MtCO2-e by 2029–30.
Source: Australian Government Clean Energy Regulator
The ACCU Scheme supports projects that either reduce emissions or remove carbon from the atmosphere. These projects aim to:
Enhance vegetation for better carbon storage.
Adjust land practices to reduce emissions.
Upgrade equipment to lower energy use and methane output.
Project developers earn one ACCU for every tonne of CO₂-equivalent emissions avoided or stored. These credits can then be sold to companies or governments, creating a financial incentive for emissions reduction.
The scheme continues to expand. In November 2024, a new reforestation method was introduced. This new approach builds on past models. It supports projects that boost carbon storage through environmental or mallee plantings.
Activity in the market has been strong. In 2024–25, over 380 new project applications came in, and 1,183 crediting applications were processed.
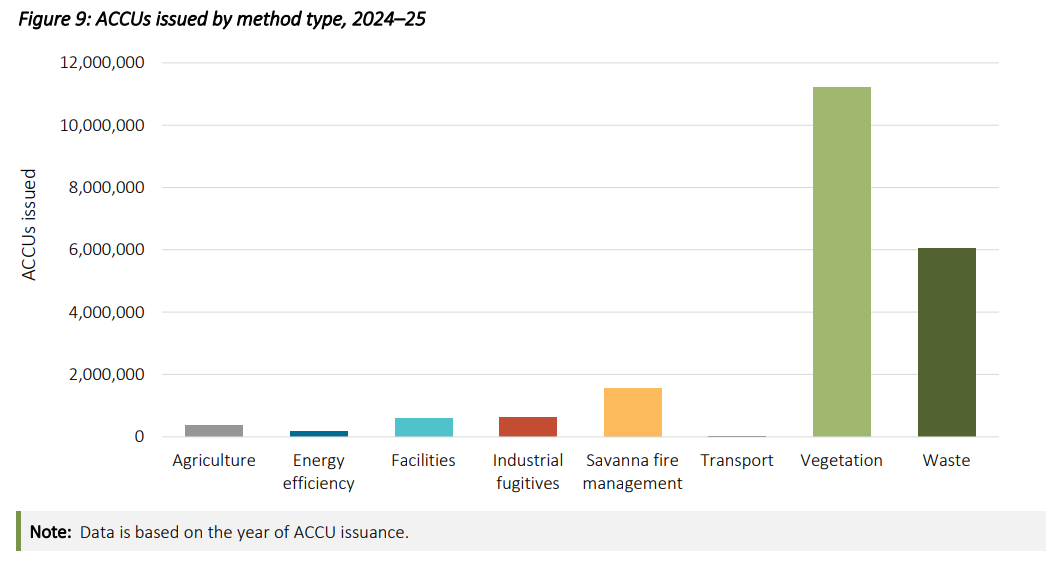
Source: Australian Government Clean Energy Regulator
Credit supply has also reached new highs. A record 20.6 million ACCUs were issued in 2024–25, up from 18.7 million the year before. Over half of these credits—about 54%—came from vegetation projects. Meanwhile, 29% were from waste-related projects.
At the same time, spot prices are currently around AUD $30 to $35 per ton and are expected to stay relatively stable through 2028. However, the government’s cost containment price, used for companies facing higher emissions obligations, is much higher, set at $82.68 for 2025–26.
This imbalance reflects a broader trend. Companies are using credits as a short-term solution while longer-term decarbonization projects take time to develop.
Rio Tinto’s Tightrope: Balancing Cuts and Offsets
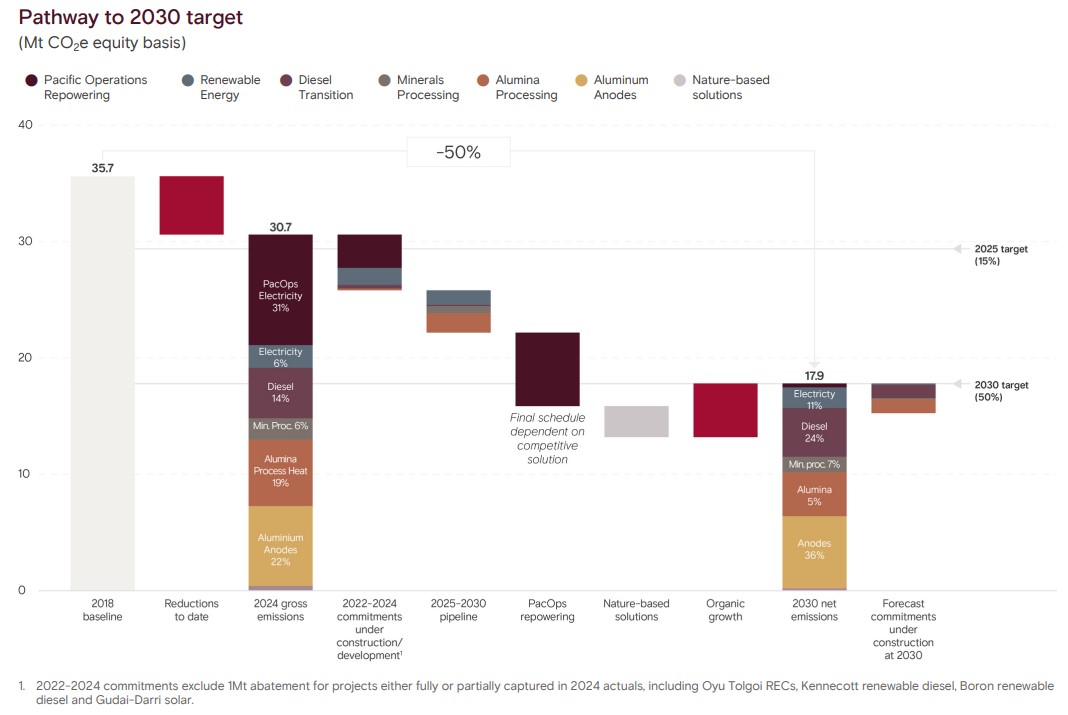
Rio Tinto is one of the world’s largest mining companies and a major emitter in Australia. The company has set a target to cut Scope 1 and 2 emissions by 50% by 2030, using a 2018 baseline. It also aims for net-zero emissions by 2050.
Source: Rio Tinto
To reach these goals, Rio Tinto is investing in renewable energy, electrification, and low-carbon technologies. For example, it is developing large-scale solar and battery projects to power its iron ore operations in Western Australia.
However, emissions reductions in mining are complex. Heavy equipment, remote locations, and energy-intensive processes limit how fast emissions can fall. As a result, Rio Tinto has also used carbon credits to manage near-term compliance under the Safeguard Mechanism.
The mining giant retired 1.1 million ACCUs in 2024 and plans to scale it to 3.5 million credits annually by 2030.
The use of credits reflects a broader strategy. The company combines direct emissions cuts with offset purchases to stay within regulatory limits while transitioning operations over time.
Woodside’s Climate Dilemma: Oil, Gas, and the Offset Dependence
Woodside Energy faces similar challenges. As Australia’s largest independent oil and gas company, it operates in a high-emission sector with limited short-term alternatives.
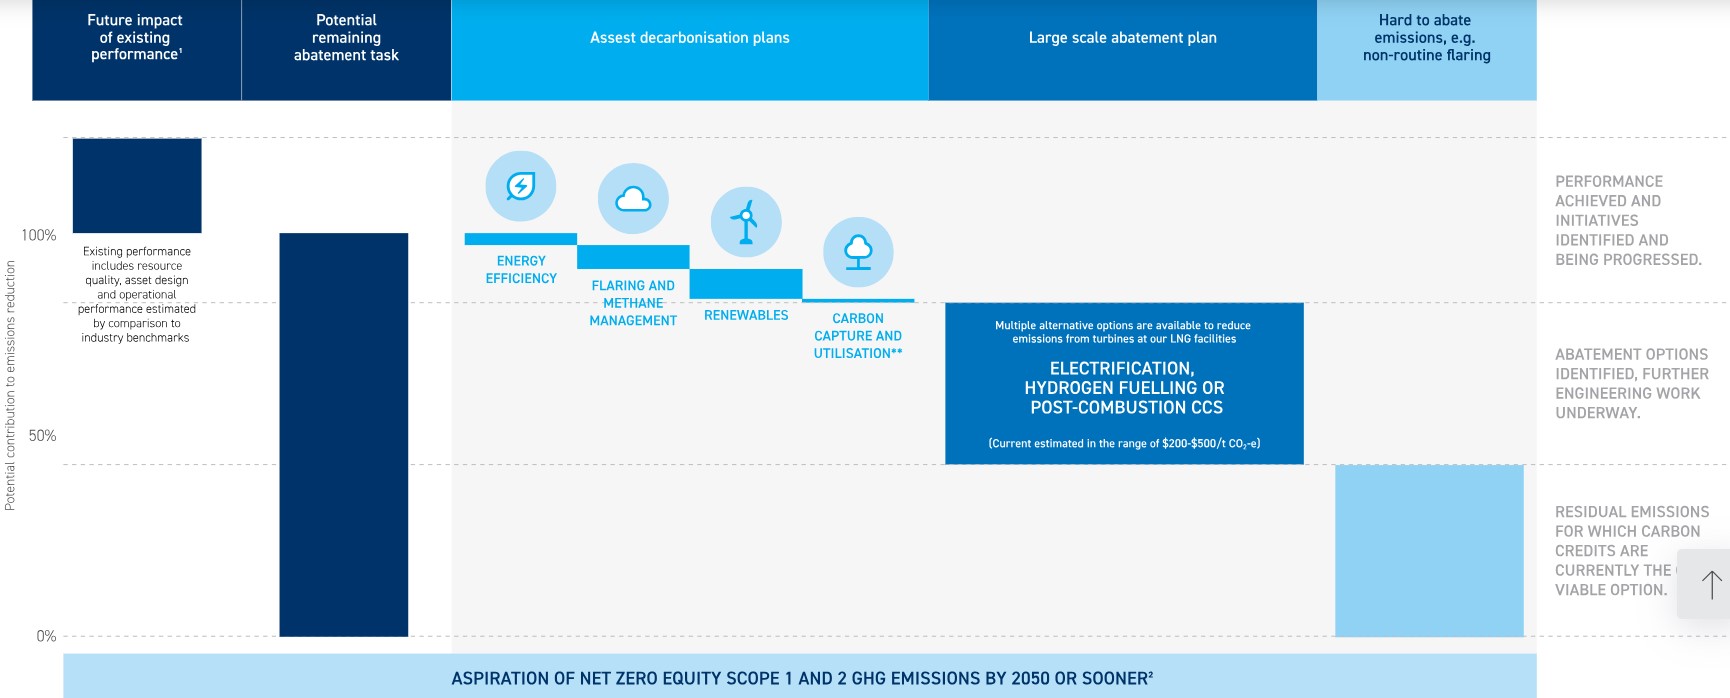
Woodside has set a target to reduce net equity Scope 1 and 2 emissions by 30% by 2030, based on a 2020 baseline. It also aims for net zero by 2050.
Source: Woodside Energy
The company plans to invest in carbon capture and storage (CCS), hydrogen, and renewable energy. However, these technologies are still scaling.
In the meantime, Woodside has relied on carbon credits to offset emissions. This includes purchasing ACCUs to meet compliance requirements and support its climate targets. This approach highlights a key issue. For sectors like oil and gas, offsets remain a major tool in the transition.
Carbon Markets Are Growing—But Trust Issues Are Growing Too
Australia’s carbon market is growing, but it faces ongoing scrutiny. The Clean Energy Regulator oversees ACCU issuance and compliance, aiming to ensure credit quality and transparency.
At the same time, independent reviews have raised concerns about the integrity of some nature-based credits. This has led to tighter rules and increased oversight.
Globally, similar trends are emerging. According to the World Bank, carbon pricing mechanisms now cover about 24% of global emissions, with carbon prices ranging widely across regions.
In voluntary markets, demand is shifting toward higher-quality credits. Buyers are prioritizing projects with clear, verified emissions reductions and long-term impact. However, supply remains limited. This creates price pressure and increases competition for high-integrity credits.
Offsets vs Real Cuts: The Debate Behind Net Zero Strategies
Offsets play a growing role in corporate climate strategies, especially for hard-to-abate sectors. But they are not a complete solution.
Most net-zero frameworks require companies to reduce emissions first, then use carbon offsets only for residual emissions. This principle is reflected in global standards such as the Science Based Targets initiative (SBTi).
Still, the reality is more complex. Large industrial companies often face technical and economic limits on how fast they can decarbonize. As a result, many firms use a mix of strategies:
Direct emissions reductions through efficiency and clean energy,
Investment in new technologies like CCS and hydrogen, and
Carbon credits to manage remaining emissions.
This blended approach is now common across the mining and energy sectors.
A Climate Transition Under Pressure: Progress or Delay?
The surge in carbon credit use under Australia’s Safeguard Mechanism highlights both progress and tension in climate policy. On one hand, the system is driving emissions accountability and creating a market for carbon reductions. On the other hand, heavy reliance on credits raises questions about how quickly real emissions cuts are happening.
For companies like Rio Tinto and Woodside, the path to net zero is complex. It requires balancing operational realities, regulatory pressure, and long-term investment.
The next phase will depend on several factors. These include the availability of low-carbon technologies, the integrity of carbon markets, and the pace of policy tightening.
For now, carbon credits remain a key tool. But their role is likely to evolve as the transition to lower emissions accelerates.
The disruption in the Strait of Hormuz—one of the world’s key oil and gas routes—raised fears of a fossil fuel shortage. However, instead of a return to coal or a spike in fossil fuel use, the global power system moved in the opposite direction. Clean energy quietly took the lead.
New analysis from the Centre for Research on Energy and Clean Air (CREA) shows that global fossil fuel power generation fell by about 1% in March, the first full month after the disruption began. What stands out is not just the drop, but what replaced it. Solar and wind grew fast enough to fully cover the gap left by fossil fuels.
Gas power fell by around 4%, while coal stayed mostly flat. At first, many expected coal to rise and fill the gap. But that did not happen. Instead, renewable energy took the lead.
No Sign of a Coal Comeback
The shift was not limited to one region. Outside China, coal power fell by about 3.5%, while gas dropped by 4%. This trend was seen in major economies like the US, India, the EU, Turkey, and South Africa. At the same time, wind and solar grew fast enough to cover the drop in fossil fuels.
China showed a slightly different trend. Coal use rose by about 2% in coastal areas as high gas prices pushed some power plants to switch from gas to coal. Even so, China’s overall coal use stayed below last year’s levels. In fact, March 2025 still showed a 6% yearly decline. This suggests short-term fuel switching, not a long-term change.
Talk of a global “coal comeback” does not match the data. Even with high gas prices and supply stress, there has been no major restart of old coal plants or big new coal expansion. Most coal plants were already running near full capacity, so there was little room to increase output.
Global trade data supports this view. Seaborne coal shipments fell by about 3% in March, reaching their lowest level since 2021 during the Covid period. Demand dropped in key importers like China and India. Shipments also fell to South Korea, Turkey, and Vietnam. Only a few countries, such as Japan and some parts of Southeast Asia, saw small increases.
Renewables Reshape the Power System
Another key point is that electricity demand did not fall during the crisis. In fact, total power use in countries with real-time data rose in March after a weak start to the year. This shows that the crisis did not reduce demand; it only changed how electricity was produced.
The growth of clean energy is now large enough to matter at a global level. Solar and wind capacity added in 2025 alone is expected to produce about 1,100 terawatt-hours (TWh) of electricity each year. That is nearly twice the electricity that could be generated from all LNG that normally passes through the Strait of Hormuz.
Solar and Wind Take Spotlight
Breaking down further, Solar power rose by 14%, and wind increased by 8%. This growth came from record new installations in 2025. Hydropower also rose slightly, while nuclear power dipped. CREA’s data covers major markets like China, the US, the European Union, and India, which together account for most global coal and gas use. This makes the trend a strong signal of what is happening worldwide.
This matters because about 19% of global LNG trade flows through this route. That gas would produce around 590 TWh of electricity if used in power plants. But new solar and wind projects added in just one year now produce far more than that. This shows how fast clean energy is growing.
Ember Data Reveals Fossil Fuel Fragility, Rising Electrotech Alternative
At the same time, the broader narrative of fossil fuel security is also under pressure. A parallel analysis from Ember highlights a structural vulnerability: three-quarters of the world’s population lives in countries that import fossil fuels. Many major economies, including Spain, Italy, Germany, Japan, South Korea, and India, rely heavily on imported energy. This makes them highly exposed when trade routes like Hormuz are disrupted.
However, Ember also points to a rapidly emerging alternative—electrotech. Technologies such as electric vehicles, solar panels, wind power, batteries, and heat pumps are reducing reliance on imported fuels. Unlike fossil fuels, these systems rely on domestic resources like sunlight and wind, which are widely available across most regions.
Thus, this change is already visible. Electric vehicles alone are estimated to have reduced oil use equal to about 70% of Iran’s exports in 2025. At the same time, more solar power is replacing gas-based electricity, cutting the need for LNG imports. Clean energy is slowly becoming a buffer against global shocks.
Energy Security Is Entering a New Phase
The impact goes beyond short-term price changes. When fossil fuel prices rise during crises, import costs increase sharply. For every $10 rise in oil prices, global import bills go up by about $160 billion each year. This puts pressure on countries that rely on imports.
Because of this, clean energy is now seen not only as a climate solution but also as a way to improve energy security.
Looking ahead, many experts believe this crisis may speed up the energy transition. Solar and wind are now cheaper and faster to build than fossil fuel projects in many regions. Liquefied natural gas, once seen as a “bridge fuel,” is now facing stronger competition from renewables and storage systems.
At the same time, forecasts for oil demand are changing. The International Energy Agency has already reduced its growth outlook, and some analysts think global oil demand could peak earlier than expected, possibly before 2029. If that happens, the Strait of Hormuz disruption may be seen as a turning point rather than just a short-term shock.
Overall, the data shows a clear direction. Even during geopolitical stress, the world is becoming less dependent on fossil fuels. Solar and wind are no longer just extra sources of power. They are now strong enough to replace fossil fuels during crises.
In the end, the Strait of Hormuz disruption did not lead to a fossil fuel comeback. Instead, it showed how quickly clean energy is changing the global power system.
To provide the best experiences, we use technologies like cookies to store and/or access device information. Consenting to these technologies will allow us to process data such as browsing behavior or unique IDs on this site. Not consenting or withdrawing consent, may adversely affect certain features and functions.
Functional
Always active
The technical storage or access is strictly necessary for the legitimate purpose of enabling the use of a specific service explicitly requested by the subscriber or user, or for the sole purpose of carrying out the transmission of a communication over an electronic communications network.
Preferences
The technical storage or access is necessary for the legitimate purpose of storing preferences that are not requested by the subscriber or user.
Statistics
The technical storage or access that is used exclusively for statistical purposes.The technical storage or access that is used exclusively for anonymous statistical purposes. Without a subpoena, voluntary compliance on the part of your Internet Service Provider, or additional records from a third party, information stored or retrieved for this purpose alone cannot usually be used to identify you.
Marketing
The technical storage or access is required to create user profiles to send advertising, or to track the user on a website or across several websites for similar marketing purposes.