Fortescue Targets Fossil-Free Mining with Massive Solar and Battery Expansion for Pilbara

Fortescue, the Australian mining giant, is building its 690MW Turner River solar farm in Western Australiaโ€™s Pilbara region. This project is key to its goal of eliminating fossil fuels from iron ore operations by 2030 as part of its โ€œReal Zeroโ€ strategy.

Fortescue is also developing a 650MWh battery energy storage system (BESS) at Cloudbreak. Together, these projects will strengthen the โ€œPilbara Green Grid,โ€ which supplies clean electricity to mines, railways, and ports.

In the broader context, Australia is increasing its renewable energy supply. This aims to meet rising electricity demand and help industries cut carbon emissions.

australia energy consumption
Source: Australian Energy Statistics – Update Report 2025

Fortescue Builds One of Australiaโ€™s Largest Mining Renewable Networks

Fortescueโ€™s โ€œReal Zeroโ€ strategy is the companyโ€™s plan to eliminate fossil fuel use and operational emissions from its iron ore operations without relying heavily on carbon offsets.

Unlike many net-zero plans that use carbon credits to balance emissions, Fortescueโ€™s Real Zero approach focuses on directly cutting emissions at the source through renewable energy and electrification.

Key Goals of the Real Zero Strategy

  • Achieve โ€œReal Zeroโ€ emissions across Fortescueโ€™s terrestrial iron ore operations by 2030
  • Replace diesel and gas with renewable electricity, battery storage, and green technologies
  • Electrify mining equipment, rail systems, and haul trucks
  • Build large-scale solar, wind, and battery projects across the Pilbara region
  • Reduce exposure to volatile fossil fuel prices and improve long-term energy security
fortescue
Source: Fortescue

The Turner River solar project is the last major solar installation needed for Fortescueโ€™s Real Zero target. When completed in 2028, the solar farm will have more than one million solar panels in the Pilbara.

This facility will join three other significant solar projects currently underway:

  • Solomon Airport Solar Farm โ€“ 440MW
  • Cloudbreak Solar Farm โ€“ 190MW
  • North Star Junction Solar Farm โ€“ 100MW

With Turner River, Fortescueโ€™s solar capacity will top 1.4GW. This can power almost half a million Australian homes each year.

The company is boosting battery storage for reliable power at remote mining sites. The Cloudbreak BESS will provide 74MW for about eight hours. It uses 124 battery units connected to the Cloudbreak solar farm.

Fortescue has activated battery systems at Eliwana and North Star Junction. This boosts the reliability of renewable power in the Pilbara mining network.

Fortescue Speeds Up Australiaโ€™s Industrial Energy Transition

Fortescueโ€™s investment marks a significant shift in Australiaโ€™s energy landscape. The country is rapidly increasing its renewable electricity as governments and industries push for decarbonization.

Australiaโ€™s electricity demand is expected to rise strongly over the next 20 years due to the growth of electric vehicles, hydrogen production, industrial electrification, and decarbonization efforts.

  • According to the Australian Energy Market Operator (AEMO), renewables supplied more than 50% of electricity in Australiaโ€™s main power grid for the first time in late 2025, while electricity demand increased by 2.2%.
  • In Western Australia, where Fortescue works, electricity demand is high. This is due to mining and mineral processing. The Pilbara region hosts some of the largest iron ore operations in the world. These operations have relied heavily on diesel and gas.

Australia energy consumption

Global investors and steelmakers want lower-carbon supply chains. So, mining companies need to cut emissions but keep production steady.

Pilbara Green Grid Expands Beyond Solar

Fortescueโ€™s Pilbara Green Grid includes more than just solar power. The company is also investing in wind energy and transmission infrastructure to create a diverse clean energy system.

  • Construction is underway for the 133MW Nullagine Wind Farm, which will supply renewable electricity when solar generation decreases.

To connect these renewable assets, Fortescue has built over 480 kilometers of high-voltage transmission lines in the Pilbara. The complete network is expected to extend beyond 620 kilometers.

This grid will directly link renewable energy to Fortescueโ€™s mines, rail operations, and export facilities. This integrated system aims to reduce reliance on diesel and gas while improving long-term energy security.

The scale of this infrastructure shows how mining companies are becoming renewable energy developers instead of relying solely on utility power.

Electrification of Mining Equipment Gains Speed

Fortescue is not just replacing fossil fuel-based electricity generation. The company is also electrifying its mining fleet.

Currently, 16 electric excavators and one electric drill are in use at Fortescueโ€™s iron ore sites. The company expects about half of its excavator fleet to be electric by the end of 2026.

Fortescueโ€™s first battery-electric haul truck is set to start operations before the year ends. These trucks are among the largest mining vehicles, marking an important milestone.

  • To support this transition, Fortescue has begun commissioning its first in-house developed 6MW fast charger. This charger can fully recharge a haul truck in about 30 minutes, helping maintain productivity while reducing diesel use.

The company is also working with Chinese manufacturer XCMG to test prototype battery-electric mining equipment, including wheel loaders and dozers.

Additionally, Fortescue has commissioned battery-electric locomotives for its rail network, expected to cut around one million liters of diesel consumption each year.

forescue
Source: Fortescue

Rising Fuel Costs Strengthen the Case for Renewables

Fortescue executives say the economics now favor renewable energy and electrification.

CEO Dino Otranto noted that while many industries debate large-scale decarbonization, Fortescue is moving ahead.

Otranto pointed out that better technology and lower renewable energy costs are making clean energy investments more attractive. Ongoing fluctuations in global fuel markets also add to this appeal.

This trend impacts Australiaโ€™s power market. Recent data shows that electricity generation costs dropped in early 2026. This change comes as renewable energy and battery storage lessen the need for costly gas.

Mining companies globally face pressure from investors and governments to cut emissions. Renewable-powered mining can help Australia maintain its top spot in iron ore and critical minerals exports as supply chains focus more on carbon reduction.

A Global Test Case for Green Mining

Fortescueโ€™s Pilbara Green Grid is emerging as one of the largest renewable energy systems for mining. This project could serve as a model for heavy industries wanting to reduce emissions while remaining reliable.

Solar farms, wind generation, battery storage, high-voltage transmission, and electric mining vehicles show how large operations can shift from fossil fuels.

If successful, Fortescueโ€™s strategy could transform how mining companies use energy and cut carbon emissions worldwide.

AI Data Center Market to Hit $1.7 Trillion in 2030, Bank of America Reports as Energy and Emissions Pressures Rise

The global race to build artificial intelligence (AI) infrastructure is accelerating at a historic pace. Bank of America (BofA) now estimates the AI data center systems market could hit about $1.7 trillion by 2030. This is a big jump from earlier predictions.

The updated outlook shows a rising need for AI computing power, cloud infrastructure, advanced semiconductors, and electrical systems. These are essential for large-scale AI deployment.

At the center of this expansion are hyperscale data centers. These facilities train and run advanced AI models that power chatbots, enterprise tools, automation systems, and cloud services.

However, the rapid buildout also raises concerns about electricity demand, carbon emissions, water use, and strain on existing power grids. The result is a growing tension between digital expansion and environmental sustainability.

BofA Sees a Trillion-Dollar AI Buildout Ahead

Bank of America increased its forecast for the AI data center systems market to about $1.7 trillion by 2030. This is up from earlier estimates of around $1.2 trillion and later $1.4 trillion. The bank expects the market to grow at a compound annual rate of roughly 38% to 45%, depending on the segment analyzed.

The bank also sharply increased its semiconductor outlook. In April 2026, BofA analyst Vivek Arya increased the global semiconductor revenue forecast for 2026 to $1.3 trillion. This was $300 billion more than the estimates from just four months prior.

BofA projects the broader chip market could reach $2 trillion by the end of the decade. Several parts of the AI hardware market are expanding rapidly:

  • AI accelerator forecasts increased to around $1.2 trillion.
  • AI networking projections rose to roughly $316 billion.
  • Data center server CPU forecasts increased to around $110 billion.

BofA also expects AI infrastructure spending to remain strong for years. The bank describes 2026 as roughly the midpoint of an eight-to-ten-year AI expansion cycle.

NVIDIA Emerges as the Core Engine of the AI Buildout

No company is more closely tied to the AI infrastructure boom than NVIDIA Corporation. As demand for AI computing accelerates, NVIDIA has become the leading supplier of GPUs and AI systems powering hyperscale data centers worldwide.

Bank of America recently called NVIDIA its โ€œtop sector pickโ€ and raised its stock price target on the company to $320, citing the expanding $1.7 trillion AI infrastructure market.

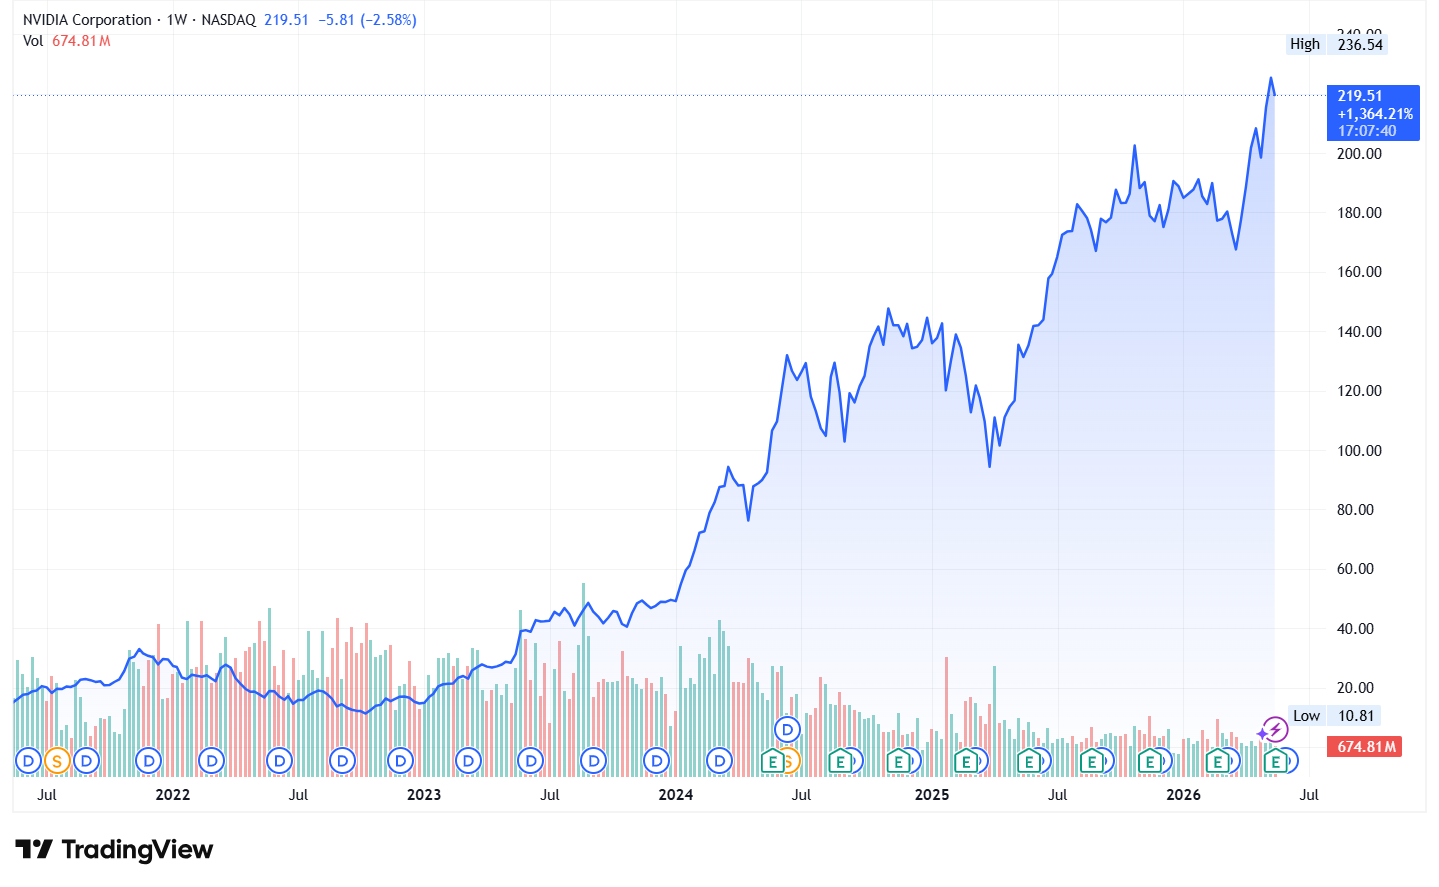
NVIDIA’s stock recently reached a new all-time high above $236 on May 14, pushing its market capitalization toward $5.7 trillion.

NVIDIA NVDA stock price

Analysts expect Nvidiaโ€™s Blackwell and upcoming Rubin platforms to remain central to the next phase of AI deployment. Recent forecasts also highlight the companyโ€™s growing scale:

  • NVIDIAโ€™s data center revenue surpassed a US$200 billion annual run rate
  • The company is estimated to hold around US$500 billion in bookings through 2026
  • AI accelerator demand is expected to rise sharply as hyperscalers expand capacity

NVIDIAโ€™s growth is also reshaping the wider technology supply chain, benefiting firms involved in optics, advanced packaging, power systems, server assembly, and liquid cooling.

Big Tech and Governments Drive Spending Surge

Other major technology firms and national AI strategies further fuel the AI expansion.

The BofA report states that Microsoft, Amazon, Meta, and Alphabet plan to spend over $670 billion on data center development in 2026. Some estimates, like that by Statista, say combined spending is around $725 billion. This shows the fierce competition for AI computing capacity.

big tech AI spending 2026

At the same time, sovereign AI programs are becoming a major source of demand. Governments now see AI infrastructure as a key part of national resources. It’s like energy systems or telecom networks. This is pushing countries to build domestic computing capacity rather than rely entirely on foreign cloud providers.

The market is also expanding beyond semiconductors and servers. BofA introduced a ranking of 67 electrical infrastructure companies expected to benefit from data center construction. The list includes firms involved in transformers, power systems, cooling equipment, and grid connectivity.

BofA says that electrical infrastructure is a major bottleneck for AI growth. Many power systems aren’t built to handle the rapid increase from data centers.

Grid Strain and Electricity Demand Become Central Challenges

The AI boom is increasing pressure on electricity systems worldwide.

BofA estimates that U.S. electricity demand could grow at a 2.5% annual rate through 2035, compared with only 0.5% growth during the previous decade. Data centers are expected to be one of the main drivers of this increase.

The bank stated that about 67% of U.S. utility spending in 2024, roughly $63 billion, will go to replacing and upgrading old systems instead of building new capacity. This creates concerns about whether grids can expand fast enough to support AI growth.

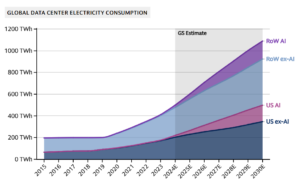
Other forecasts show even steeper increases. Goldman Sachs estimates that global data center electricity use may rise by over 220% by 2030. This could hit about 1,350 terawatt-hours each year.

global data center electricity use 2030 goldman

In the United States alone, data centers could account for nearly 11% of national electricity demand by 2030, almost double current levels.

Research also suggests that AI infrastructure is becoming concentrated in a few regions. North America, Western Europe, and the Asia-Pacific are expected to account for more than 90% of projected AI compute capacity by 2030.

Some areas, like parts of Virginia, Oregon, and Ireland, might experience rising grid stress. This stress comes as data center demand outpaces local energy infrastructure.

AIโ€™s Climate Footprint Is Expanding Fast

The environmental impact of AI infrastructure goes far beyond energy consumption.

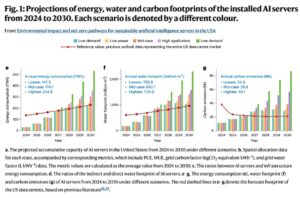
A study suggests that by 2030, AI data centers in the United States alone are projected to generate an additional 24 to 44 million metric tons of carbon dioxide annually. That is roughly equal to adding 5 to 10 million cars to American roads.

US data centers energy and carbon emissions
Source: Xiao, T., Nerini, F.F., Matthews, H.D. et al. Environmental impact and net-zero pathways for sustainable artificial intelligence servers in the USA. Nat Sustain 8, 1541โ€“1553 (2025). https://doi.org/10.1038/s41893-025-01681-y

One reason is that data centers often rely on electricity sources with higher carbon intensity than the national average. Data centers currently use electricity that is 48% more carbon-intensive than the average U.S. grid mix. This is mainly because operators still rely on fossil-fuel baseload power.

Even under aggressive renewable energy scenarios, analysts estimate that around 11 million tons of residual emissions could remain by 2030. Reaching net-zero emissions would require roughly:

  • 28 gigawatts of wind capacity, or
  • 43 gigawatts of solar capacity.

Water use is also emerging as a major concern. AI data centers could consume between 731 million and 1.125 billion cubic meters of water annually by 2030. A large hyperscale AI facility may use 3 to 7 million gallons of water per day for cooling systems. Some facilities reportedly source up to 57% of cooling water from potable drinking supplies.

These pressures are especially important in regions already facing water scarcity or drought conditions.

Semiconductor Production Adds Another Layer of Emissions

The environmental footprint of AI infrastructure also includes semiconductor manufacturing.

Global chip manufacturing already generates roughly 50 megatons of COโ‚‚ emissions each year. Semiconductor facilities use highly energy-intensive processes and rely on specialized gases with extremely high warming potential.

Nitrogen trifluoride (NFโ‚ƒ) is one example. This gas is used in chip production. Its global warming potential is about 17,000 times that of carbon dioxide. If current trends continue, analysts say semiconductor manufacturing could make up about 3% of global emissions by 2040.

At the same time, AI chip demand continues to surge. TSMC recently estimated that the global semiconductor market might surpass $1.5 trillion by 2030. This growth is mainly fueled by demand for AI and high-performance computing. The company expects AI accelerator wafer demand to increase 11-fold between 2022 and 2026.

AI Infrastructure Growth Brings Economic Opportunity and Environmental Pressure

The rapid expansion of AI infrastructure is reshaping global technology investment. Bank of Americaโ€™s new $1.7 trillion forecast reflects how central data centers, semiconductors, networking systems, and electrical infrastructure have become to the next phase of economic growth.

However, the buildout carries major environmental costs. Rising electricity demand, higher emissions, growing water consumption, and grid strain are becoming structural challenges tied to AI expansion.

The industry now faces a difficult balance. Companies and governments want faster AI growth, but they also face increasing pressure to meet climate targets and strengthen energy systems.

As AI infrastructure spending rises, the ability to align digital growth with sustainable energy development may become one of the sectorโ€™s defining challenges.

Carbon Pricing Covers 29% of Global Emissions and Hits Record $107 Billion in Revenues

The World Bankโ€™s 2026 carbon pricing report shows that carbon pricing continues to expand across countries and sectors. Governments are increasingly using carbon taxes and emissions trading systems (ETSs) to manage greenhouse gas emissions. However, the system is still uneven in coverage and design across regions.

Here are our key takeaways from the report.

Carbon Pricing Quietly Becomes a Global Policy Mainstay

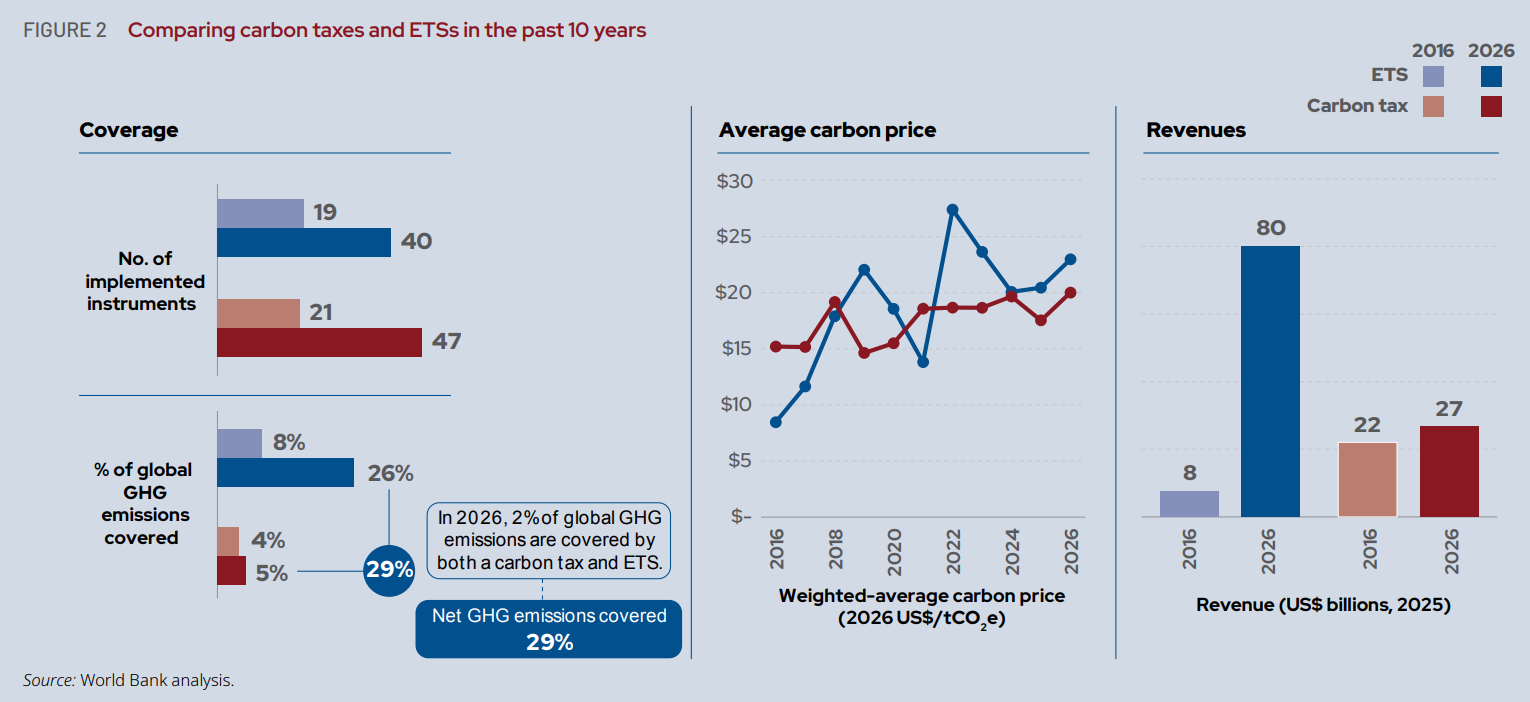
Direct carbon pricing now covers 29% of global greenhouse gas (GHG) emissions as of April 1, 2026. This coverage comes from 87 implemented policies worldwide. These policies include both carbon taxes and emissions trading systems, which are the two main tools used in carbon pricing today.

The report states that there are:

  • 47 carbon taxes
  • 40 emissions trading systems (ETSs)

In the past 12 months, five new national-level instruments were introduced. These include Indiaโ€™s CCTS, Japanโ€™s GX-ETS, Viet Namโ€™s ETS, and carbon taxes in Mauritania and Serbia. These additions show that carbon pricing is spreading beyond advanced economies into emerging and developing regions.

carbon tax and ets 2026
Source: World Bank Report

The report says that if current policies are fully put in place, global coverage might reach almost one-third of global emissions by 2030. This shows ongoing growth, but progress relies on national policies and how quickly they’re put into action.

Carbon Prices Rise, but Policy Direction Differs Across Countries

Carbon prices have increased steadily over the past decade. The report reveals that the average carbon price has doubled. It went from $10 per ton of COโ‚‚e in 2016 to almost $21 per ton in 2026. This long-term increase reflects broader adoption and gradual tightening of climate policy frameworks.

In the most recent year, prices also moved upward. The average carbon price increased by more than 7% since April 2025, showing continued momentum in several jurisdictions.

However, price changes are not uniform. Different countries have taken different policy paths. Some have raised prices significantly, while others have reduced or paused them.

  • Singapore increased its carbon tax by 80% in 2026
  • South Africa increased its carbon tax by 31%
  • Canada reduced its federal fuel charge to zero from April 1, 2025

These contrasting movements highlight that carbon pricing is still politically sensitive. While some governments are strengthening pricing signals, others are adjusting policies based on economic or political considerations. As a result, global carbon price levels remain highly uneven.

SEE LIVE CARBON PRICES HERE.ย 

Carbon Pricing Revenues Remain Strong and Above US$100 Billion

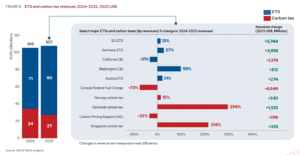
Carbon pricing continues to generate large-scale public revenue. In 2025, total global revenues from ETSs and carbon taxes reached over $107 billion, marking an increase of about 2% from 2024.

ETS and carbon tax revenues 2024โ€“2025, 2025
Source: World Bank

These revenues come from two main sources:

  • ETSs generated over $80 billion, and
  • Carbon taxes generated about $27 billion.

Importantly, the report confirms that carbon pricing revenues have remained above $100 billion every year in real terms since 2021. This indicates that carbon pricing is now a stable fiscal instrument, not only a climate policy tool.

The use of these revenues varies by country. Some governments recycle funds into households or businesses. Others direct revenues toward climate investment, clean energy development, or general budgets. The report does not assign a single global pattern but shows that revenue use is becoming a key feature of carbon pricing systems.

Major National Systems Continue to Anchor Global Market

Large national and regional systems continue to play a central role in global carbon pricing. Indiaโ€™s CCTS now covers:

  • 7 sectors,
  • 490 industries, and
  • Approximately 477 million tCOโ‚‚e.

Meanwhile, Japanโ€™s GX-ETS includes:

  • Over 700 companies,
  • More than 50 percent of national emissions, and
  • Around 524 million tCOโ‚‚e.

The report also notes that larger systems such as Chinaโ€™s national ETS, the EU ETS, and the Republic of Korea ETS still cover more emissions in absolute terms than Indiaโ€™s or Japanโ€™s systems. These systems remain the largest anchors of global carbon pricing coverage due to their scale and maturity.

Map of ETSs and carbon taxes
Source:

Together, these systems show how carbon pricing is becoming common in major industrial economies, while newer systems are expanding coverage in emerging markets.

Carbon Credit Markets Expand, but Fragmentation Deepens

Carbon credit markets continued to expand in 2025, but trends were mixed across different segments, per the World Bank’s report.

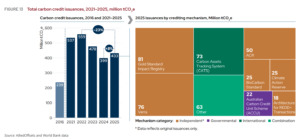
Overall carbon credit issuances increased by 8% from 2024 to 2025, amounting to 432 million credits. Over the past decade, the number of governmental crediting mechanisms rose from 24 to 34, showing long-term institutional growth.

Total carbon credit issuances
Source:

Independent crediting mechanisms still dominate the market and make up around 70% of total issuance. However, their issuance volumes dropped by about 4% over the past year.

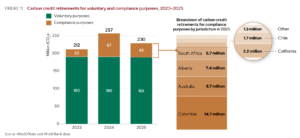
Retirements of carbon credits also declined. They fell by more than 10% from 2024 to 2025, suggesting slower demand in some parts of the market. Despite this, voluntary retirements still made up of 82% of total retirements in 2025, showing continued activity in voluntary climate action.

Carbon credit retirements for voluntary and compliance
Source:

A key development is the growth in forward-looking market activity. Offtake agreements for future carbon credits reached $12 billion in 2025, which is about three times the 2024 level. This suggests stronger expectations for future supply and demand, even as current retirements slowed.

Prices and Quality Differences Define a Fragmented Market

Carbon credit prices vary widely depending on type, eligibility, and quality.

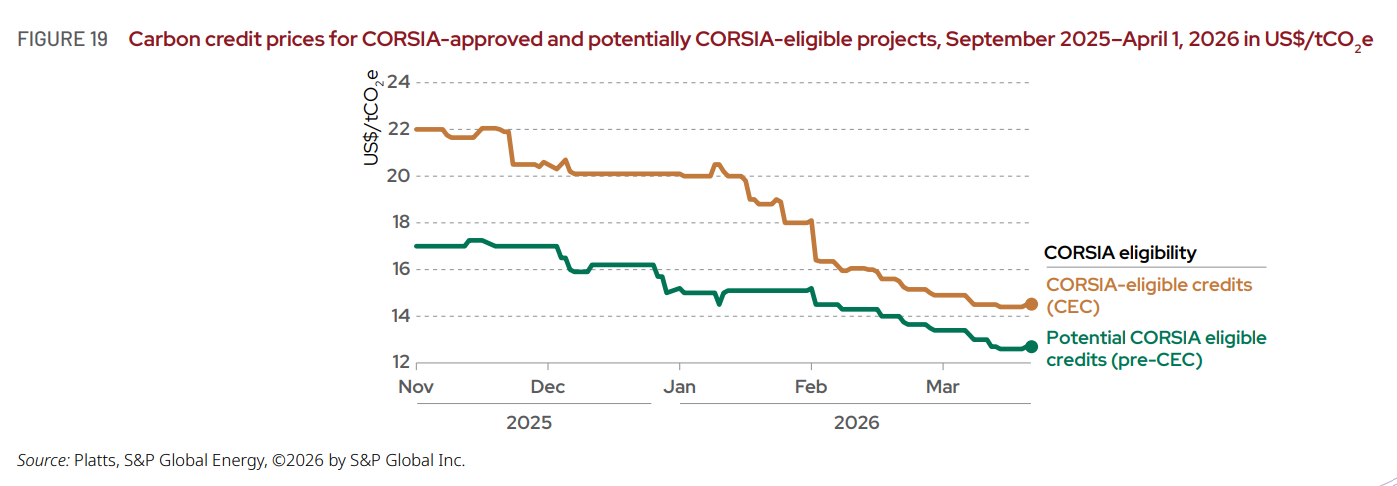
From September 2025 onward, CORSIA-eligible credits traded between $15 and $22 per ton of COโ‚‚e, making them one of the highest-priced categories in the market. In contrast, most other credit types traded between $1 and $14 per ton.

Carbon credit prices for CORSIA-approved
Source:

This gap reflects big differences in perceived quality and compliance value. The report shows that credits with better ratings and integrity labels often get price premiums. This means buyers are ready to pay more for higher-quality units.

These differences show that the carbon credit market is not unified. Instead, it is segmented into multiple price tiers, depending on credibility, usage rules, and demand conditions. This fragmentation remains one of the key structural features of the market in 2026.

Expansion Continues, but Uneven Systems Persist

The World Bankโ€™s 2026 report shows that carbon pricing is steadily expanding in scope, revenue, and market participation. Nearly one-third of global emissions are now covered by direct pricing systems, and annual revenues remain above $100 billion.

At the same time, the system remains uneven. Prices differ widely across countries, and policy directions are not fully aligned. Carbon credit markets also remain fragmented, with clear gaps between higher-quality and lower-quality segments.

Overall, carbon pricing continues to grow as a key climate policy tool. However, the report highlights that consistency, broader coverage, and improved market alignment are still ongoing challenges for global systems.

Is the India-Nordic Strategic Partnership a Big Win for Global Climate Goals?

India and the Nordic countries are strengthening their partnership in clean energy, technology, and sustainable development. At the 3rd India-Nordic Summit in Oslo, India’s Prime Minister Narendra Modi met with leaders from Denmark, Finland, Iceland, Norway, and Sweden. They launched the Green Technology and Innovation Strategic Partnership.

This summit showcased a bond built on trust, sustainability, and economic cooperation. With climate change and energy security challenges, both sides agreed that stronger partnerships are essential for a resilient future.

The partnership expands cooperation in renewable energy, digital infrastructure, defense manufacturing, Arctic research, maritime security, and trade. It also supports Indiaโ€™s goal of enhancing its clean energy transition with global partners.

India and Nordic Countries Deepen Green Cooperation

The Green Technology and Innovation Strategic Partnership focuses on climate action, energy security, water management, and the blue economy. This builds on Indiaโ€™s earlier partnerships with Norway and Denmark.

During the summit, PM Modi highlighted how the partnership combines India’s scale with Nordic strengths. Iceland offers expertise in geothermal energy and fisheries. Norway excels in the blue economy and Arctic technologies. Sweden provides advanced manufacturing and defense. Finland supports telecom and digital innovation, while Denmark leads in sustainability, health tech, and cybersecurity.

These strengths can lead to new solutions for global climate and energy challenges.

The leaders discussed how clean technologies can boost economic growth and reduce emissions. They agreed innovation and sustainability should go hand in hand. As nations aim to decarbonize, partnerships like this could be vital for scalable green solutions.

Nordic Countries Lead the Renewable Energy Transition

The Nordic region excels in renewable energy. Over the past two decades, these countries have significantly increased their renewable energy share.

As per data, in 2004, shares varied from 9.5% in Greenland to 58.9% in Iceland. By 2023, those shares grew to between 19.1% in Greenland and nearly 80% in Iceland.

Sweden, Finland, and Denmark surpassed the EUโ€™s 2030 renewable energy target of 42.5% in 2023. Iceland and Norway achieved even higher shares. This strong performance positions the Nordic countries as global leaders in clean energy.

While hydropower remains dominant, offshore wind, solar energy, and green hydrogen are rapidly growing.

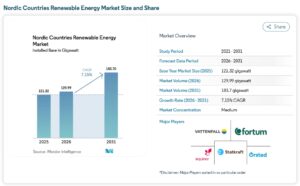
  • The Nordic renewable energy market was valued at 121.32 gigawatts in 2025 and may reach 183.7 gigawatts by 2031, with a compound annual growth rate (CAGR) of 7.15%.
Nordic renewable energy
Source: Modor Intelligence

This growth is driven by large hydropower assets, expanding offshore wind projects, rising corporate demand for clean electricity, and investments in green hydrogen. Strong carbon pricing systems and advanced power grids also support this expansion.

Solar energy is expected to grow significantly, with an 18.24% CAGR through 2031. Finland is projected to be the fastest-growing renewable energy market in the region.

Indiaโ€™s Clean Energy Goals Gain Global Support

India is rapidly increasing its renewable energy capacity. The country aims for 500 GW of non-fossil fuel energy by 2030 and net-zero emissions by 2070.

To support these goals, India has signed clean energy agreements with countries like Australia, Germany, Japan, the U.S., and now the Nordic nations. These partnerships focus on:

India allows 100% foreign direct investment (FDI) in the renewable sector. This aims to attract global investors and advanced technologies.

At the summit, Modi noted that trade between India and the Nordic region has quadrupled in the last decade. Nordic investments in India rose by nearly 200% during this time, reflecting growing economic confidence.

The leaders stressed the need for new trade agreements. Modi mentioned the Trade and Economic Partnership Agreement (TEPA) with the European Free Trade Association, which includes Iceland and Norway. He also highlighted ongoing talks for a free trade agreement with the EU, which includes Denmark, Sweden, and Finland.

According to Modi, these agreements could lead to โ€œa new golden eraโ€ in India-Nordic relations.

Defence, Digital Technology, and Arctic Cooperation Expand

Beyond renewable energy, the summit focused on defense and advanced technologies.

India and the Nordic nations agreed to boost defense cooperation. India promotes domestic manufacturing through initiatives like โ€œMake in India.โ€ Nordic companies are encouraged to invest in Indiaโ€™s defense corridors, where the government allows 100% FDI in specific sectors.

The countries also agreed to collaborate on next-gen communication technologies, like 6G, artificial intelligence, and digital infrastructure.

Arctic cooperation was another major topic. The leaders discussed joint efforts in polar research, environmental monitoring, and climate studies. As climate change accelerates ice melt in the Arctic, scientific cooperation is increasingly vital.

The summit also supported greater mobility for students, researchers, and skilled professionals between India and Nordic countries. Expanding educational and research partnerships could strengthen innovation on both sides.

A Shared Push Toward a Low-Carbon Future

This partnership comes at a crucial time for the global energy transition. Fossil fuels still dominate much of the world’s energy and are the largest source of greenhouse gas emissions, contributing to air pollution and millions of premature deaths each year.

Countries are under pressure to speed their shift to cleaner energy systems based on renewables, nuclear power, and low-carbon technologies.

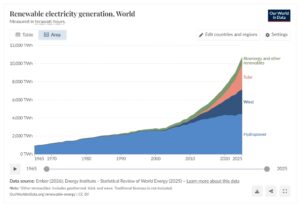
Today, renewable technologies supply about one-seventh of the world’s primary energy. While this share grows, progress must accelerate to meet global climate targets.

India and the Nordic countries are committed to being part of the solution. By combining Nordic innovation with India’s scale and growing clean energy demand, this partnership could speed up the development of affordable and scalable green technologies.

The Oslo summit showed that clean energy partnerships support economic growth, boost technology leadership, enhance energy security, and foster geopolitical cooperation.

The India-Nordic partnership is expanding in renewable energy, trade, defense, and digital innovation. This collaboration could serve as a model for future international green efforts.

Rio Tinto Locks in 30-Year Renewable Power Deal to Decarbonize Pilbara Operations

  • Rio Tinto has signed a 30-year renewable power purchase agreement to decarbonize its iron ore operations in the Pilbara region of Western Australia. The deal is one of the companyโ€™s longest clean energy contracts to date.

The Pilbara is one of the worldโ€™s most important iron ore mining hubs. It produces a large share of the global supply, but it also depends heavily on gas-fired power and diesel equipment. These energy sources drive high emissions across the region.

Rio Tinto is now trying to change that system at scale. The company is shifting away from fossil fuels and toward renewable electricity. This move supports its long-term climate strategy and helps reduce exposure to carbon costs and fuel price swings.

Rio Tintoโ€™s Climate Targets Back a Multi-Billion-Dollar Transition

The company has set a clear target to reach net-zero operational emissions by 2050. These emissions mainly come from mining machines, processing plants, and electricity use.

rio tinto net zero
Source: Rio Tinto

The new renewable agreement is designed to directly support these targets by lowering emissions from its Pilbara power network over the next several decades.

The first phase of the project includes a 75 MWac solar facility, with the option to expand to 150 MWac and add battery storage in the future. Matthew Holcz, Rio Tinto’s Iron Ore Chief Executive, stated:

“Weโ€™re proud to be part of the Jinbi project, which reflects years of work by many and led by the Yindjibarndi People… Developing renewable energy on Yindjibarndi Country, in partnership with its Traditional Custodians, creates enduring value โ€“ supporting our operations while contributing to long-term economic opportunities on Country.โ€

Rio Tintoโ€™s decarbonization plan is backed by large financial commitments and long-term targets. The company has outlined three core climate goals. It wants to:

  • Reach net zero operational emissions by 2050.
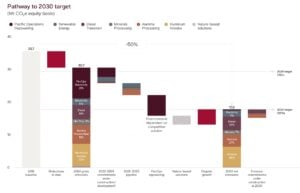
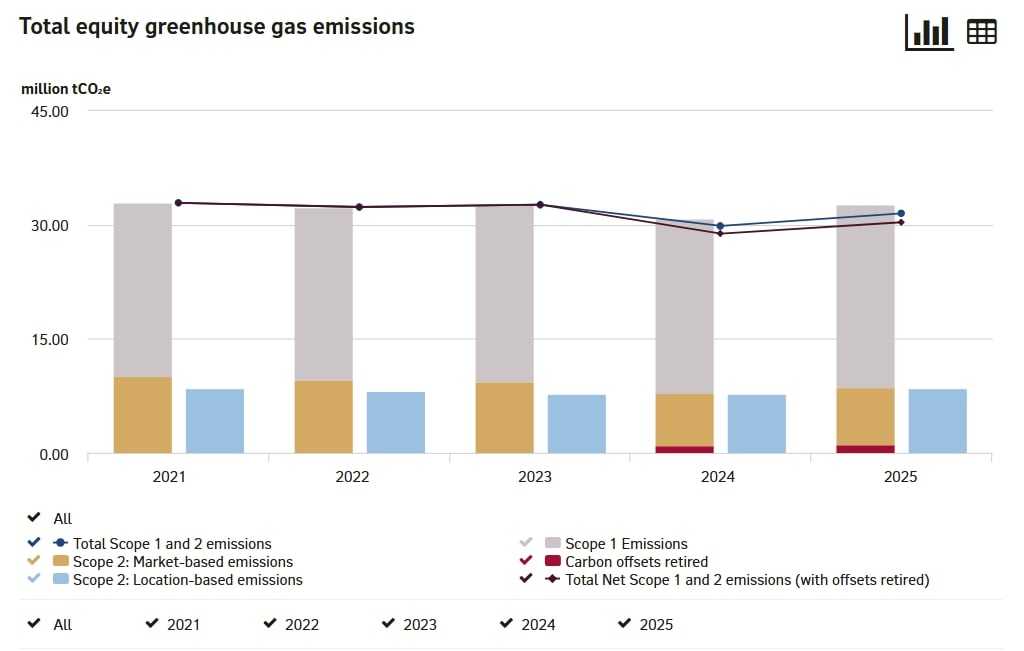
  • Cut Scope 1 and 2 emissions by 50% by 2030 (from 2018 levels).
  • Expand the use of renewable electricity across global operations.
rio tinto emissions
Source: Rio Tinto

To support this, Rio Tinto plans to invest around $5โ€“6 billion in decarbonization projects by 2030. These investments focus on several key areas, which include:

  • Electrifying mining fleets and rail systems,
  • Replacing gas-fired power with wind and solar energy,
  • Expanding battery storage for grid stability, and
  • Improving energy efficiency in processing and refining.

Rio Tinto also reports that about 78% of its global electricity already comes from renewable sources. It aims to lift that share to around 90% by 2030.

renewable energy
Source: Rio Tinto

Even with this progress, the company still faces challenges. Heavy equipment powered by diesel and high-heat industrial processes remains difficult to fully decarbonize.

Pilbara Becomes the Front Line of Miningโ€™s Energy Transition

The Pilbara iron ore system is the heart of Rio Tintoโ€™s production network. It is also one of its most carbon-intensive regions.

Mining operations in the area rely heavily on gas-fired power stations and diesel trucks. The mining giant operates multiple gas plants that supply electricity to its mines and processing facilities.

The company said in its news release that replacing gas generation in the Pilbara would require roughly 600โ€“700 MW of new renewable capacity. This would include a mix of solar, wind, and large battery storage systems.

Rio Tinto has already started building parts of this system. Its transition includes:

  • Utility-scale solar projects,
  • Grid-scale battery storage systems, and
  • Partnerships with renewable energy developers.

The new 30-year power deal strengthens this plan. It locks in a clean electricity supply over multiple decades. This is important because mining assets often operate for 20 to 40 years. It also helps reduce long-term exposure to gas price volatility and future carbon pricing risks.

Mining Giants Race to Decarbonize at Scale

The Rio Tinto agreement comes as the global mining sector faces stronger climate pressure from regulators and investors. Mining is a high-emissions industry. Major sources include diesel haul trucks, electricity-intensive processing, and metal refining.

Large mining companies are now setting net-zero targets around mid-century. Rio Tinto is aligned with peers like BHP and Vale in targeting deep emissions cuts.

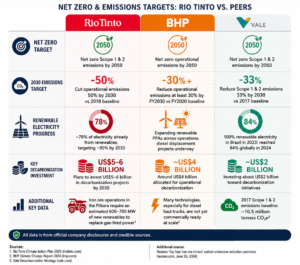
These three are among the world’s largest mining companies, and all have committed to net-zero Scope 1 and 2 emissions by 2050. But they have different emissions reduction targets for 2030. Each also has its own renewable electricity targets and progress, as well as a decarbonization financing commitment.

mining giants net zero goals

However, progress remains uneven. Studies show that while Rio Tinto has reduced emissions in some areas, it still needs faster action to meet its 2030 targets.

One of the biggest challenges is aluminum production. It requires large amounts of electricity, which makes it highly sensitive to energy sourcing. This is why renewable power procurement is becoming a core part of Rio Tintoโ€™s strategy.

The company is increasingly linking emissions reduction with long-term energy contracts instead of short-term operational changes.

Clean Energy Demand Is Reshaping Mining Strategy

Rio Tintoโ€™s decarbonization plan is also tied to rising global demand for transition metals. The company expects long-term growth in demand for:

  • Copper, used in power grids and electric vehicles,
  • Aluminum, used in lightweight transport and infrastructure,
  • High-grade iron ore is used in lower-carbon steel production.

These materials are essential for the global energy transition. Meanwhile, governments are tightening emissions rules across supply chains. This creates a dual challenge for miners. They must reduce emissions while also increasing the supply of critical materials for clean energy systems.

Rio Tinto is responding by investing more in copper and battery-related materials. It also continues to maintain its large iron ore business. This positions the company at the center of both industrial growth and decarbonization trends.

Rio Tinto’s recent stock price climb to all-time highs is a direct reflection of this successful dual-growth strategy. Investors are rerating the stock as a “diversified major” rather than just an iron ore miner.

Rio tinto stock price

Decarbonization Is Becoming Infrastructure, Not Just Targets

Rio Tintoโ€™s 30-year renewable power deal shows a clear shift in strategy. The company is moving from climate promises to physical energy infrastructure.

Its plan includes cutting emissions by 50% by 2030 and reaching net zero by 2050. These targets are supported by multi-billion-dollar investments and long-term renewable contracts.

At the same time, the mining industry is under growing pressure from governments and investors to cut emissions faster. This is happening while demand rises for metals needed in electrification and renewable energy systems.

Overall, the Pilbara agreement highlights a key trend. Decarbonization in mining is no longer just about targets. It is now about securing long-term clean power at scale. As the global energy transition accelerates, Rio Tintoโ€™s ability to secure reliable renewable electricity will play a major role in its future competitiveness.

CATL and Tencent Back $10M-Tonne Carbon Credit Push Amid Global Market Slowdown

Chinese battery giant Contemporary Amperex Technology Co. Ltd. (CATL) and tech leader Tencent are joining a new effort to revive demand in global carbon markets. The companies are teaming up with Mitsubishi Corporation, Vale S.A., and Osaka Gas. They aim to buy high-quality carbon credits through a Singapore-based coalition, Action for a Resilient Climate Coalition. The group aims to help finance at least 10 million tonnes of carbon credits by 2030.

The move comes during a challenging period for voluntary carbon markets (VCMs). Carbon credit prices and trading volumes dropped over the last two years. VCMs continued to contract in 2025 as stricter quality standards reduced liquidity. However, demand for high-integrity credits remains strong.

Still, pressure to cut emissions keeps rising. Governments are tightening climate rules. Companies are also facing stronger investor pressure to meet net-zero goals.

This is creating a major shift in the carbon market. Large corporations are no longer buying offsets casually. They are forming long-term buying partnerships that focus on better carbon credits and stronger verification systems.

XU Hao, VP of Sustainable Social Value in Tencent, remarked:

“The carbon market has immense potential to drive necessary climate finance, but it must be built on a foundation of absolute trust and scientific rigor.”

A Shift From Volume to Quality in Carbon Credits

The voluntary carbon market grew rapidly between 2020 and 2022. Hundreds of companies bought carbon credits to support climate pledges and net-zero targets.

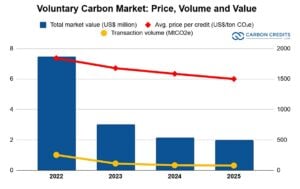
However, the market slowed after investigations questioned the effectiveness of some forestry and avoided-emissions projects. Buyers became more cautious. Many companies also reduced public use of offset-heavy climate claims. This affected carbon prices and trading activity, as shown in the chart below.

voluntary carbon market vcm price volume and value 2025

MSCI Carbon Markets reports that the VCM value dropped sharply from its 2021 peak. This decline happened as demand weakened and credit oversupply grew in many project categories.

Even so, long-term forecasts still show strong future growth.

McKinsey estimates that by 2030, global demand for carbon credits could hit 1.5 to 2 billion tonnes each year under net-zero scenarios. The World Bank also reports that carbon pricing systems now cover about 24% of global greenhouse gas emissions. This includes carbon taxes and emissions trading systems worldwide.
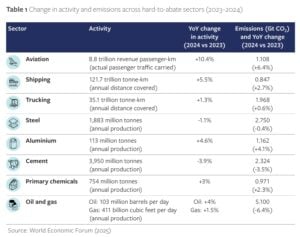
At the same time, demand is shifting toward higher-quality projects. Durable carbon removal credits from technologies like biochar, direct air capture, and enhanced weathering are gaining attention. They can store carbon for hundreds or even thousands of years.

This changing market helps explain why companies like CATL and Tencent are stepping in now.

CATL Brings Industrial Scale to Climate Action

CATL is already one of the worldโ€™s largest battery makers. The company supplies batteries to many leading electric vehicle manufacturers globally. As battery production expands, pressure is also growing to reduce emissions across mining, manufacturing, logistics, and electricity use.

CATL says it aims to achieve carbon neutrality across its core operations by 2025 and throughout its entire battery value chain by 2035. The company has already made significant progress.

CATL ZERO CARBON
Source: CATL

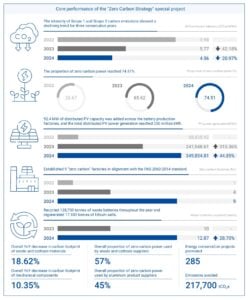
According to CATLโ€™s latest ESG updates, the company now operates several certified zero-carbon factories in China. Zhaoqing’s battery plant is now carbon neutral. It achieved this by using renewable electricity, solar power, energy efficiency upgrades, and carbon offsets.

CATL also reported that renewable electricity now powers major parts of its production network. The company reached carbon neutrality in its core operations by 2025 while continuing to cut emissions from suppliers.

Battery recycling is also becoming a larger focus.

  • In 2025, CATL recycled about 210,000 tonnes of used batteries, up more than 63% year over year. The company also regenerated 24,000 tonnes of lithium salts through recycling systems.

Battery supply chains are now a key focus in global climate policy. So, these sustainability efforts are important. Europe, China, and the United States are all introducing stricter emissions reporting and battery sustainability requirements.

Tencent Sees Carbon Markets as Part of Its Net-Zero Strategy

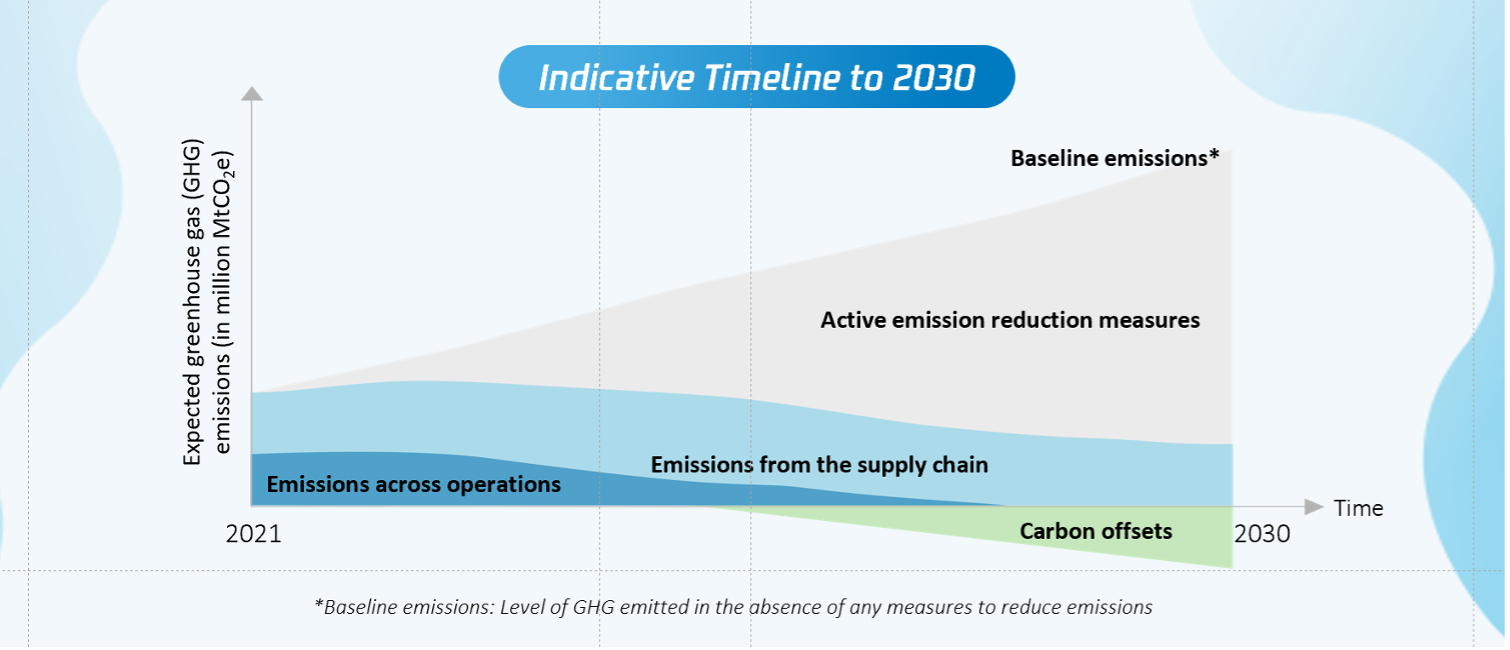
Tencent is also expanding its climate commitments. The company pledged to achieve carbon neutrality across its operations and supply chain by 2030. It also aims to use 100% renewable electricity across all operations by the end of the decade.

Tencent carbon neutrality roadmap
Source: Tencent

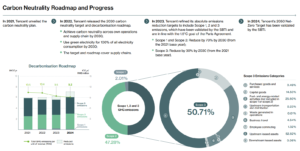
Tencentโ€™s climate targets have already been validated by the Science Based Targets initiative (SBTi). The company plans to reduce Scope 1 and Scope 2 emissions by 70% by 2030 from a 2021 baseline. It also targets a 30% reduction in Scope 3 emissions.

The companyโ€™s emissions profile shows why carbon markets are becoming important.

The Chinese tech giant reported total greenhouse gas emissions of 6.06 million tonnes of CO2e in 2024, up from 5.79 million tonnes in 2023. Roughly 54% came from supply chain emissions, while data centers and purchased electricity accounted for the remaining emissions.

Tencent carbon neutrality roadmap and progress 2024
Source: Tencent

As Tencent expands AI infrastructure and cloud computing services, electricity demand will likely continue rising. The company is investing a lot in renewable energy, green data centers, and digital emissions management systems. It also plans to use a small number of high-quality carbon offsets for emissions that are hard to eliminate directly.

This reflects a broader trend across the technology industry. AI and cloud computing are increasing electricity demand worldwide. Many technology firms are now looking for carbon-free electricity and credible carbon removal systems to help meet climate goals.

Chinaโ€™s Carbon Market Is Growing Quickly

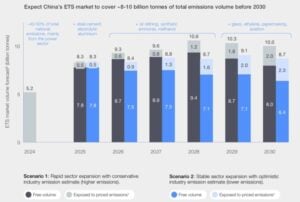
Chinaโ€™s carbon market is expanding as climate policy tightens. The national ETS launched in 2021 and now covers about 4 billion tonnes of COโ‚‚ annually, making it the worldโ€™s largest compliance carbon market by emissions covered.

china compliance carbon market ets
Source: WEF Asiaโ€™s Carbon Markets Strategic Imperatives for Corporations, 2025.

The system currently focuses on the power sector. But it is expected to expand to steel, cement, aluminum, and chemicals, which together account for a large share of Chinaโ€™s industrial emissions. As shown above, China’s ETS could cover about 10 million tonnes of emissions before the decade’s end.

China also restarted its voluntary carbon market (CCER) in 2024 after years of suspension. The updated system introduced stricter project rules and verification standards to improve credit quality and investor trust.

The world’s largest carbon emitter also aims to peak emissions before 2030 and reach carbon neutrality by 2060. Meeting these goals will require massive investment in clean energy, storage, EVs, hydrogen, and carbon capture.
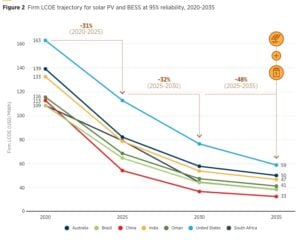
CATL is closely tied to this shift. The company expects 20%โ€“30% annual growth in battery demand over the next five years, driven by EVs, grid storage, and AI-related electricity demand.

AI and Electricity Demand Reshape Carbon Strategy

AI is now reshaping carbon and energy markets. Data centers and AI training systems use large amounts of electricity, and demand is rising fast.

The International Energy Agency (IEA) projects global data center electricity use could reach 945 TWh by 2030, more than double current levels under high-growth AI scenarios. This is pushing companies to secure cleaner and more reliable power sources. It also increases pressure to reduce emissions across supply chains.

Battery storage is becoming a key solution. CATL is expanding beyond EV batteries into grid-scale storage, which helps balance renewable energy and support AI-driven power demand.

At the same time, many companies still rely on carbon credits for emissions they cannot yet remove directly. This is linking carbon markets more closely with electricity systems, industrial supply chains, and energy infrastructure.

Carbon Markets Are Entering a More Structured Phase

The CATLโ€“Tencent initiative reflects a wider shift in carbon markets. The focus is moving from short-term offset buying to long-term, structured demand. Companies are now prioritizing:

  • stronger verification standards,
  • higher-quality carbon removal projects,
  • longer-term purchase agreements, and
  • better market transparency.ย 

For companies like CATL and Tencent, carbon credits are no longer just ESG tools. They are becoming part of core energy and net-zero strategies. As governments tighten climate rules, carbon market systems for tracking, verification, and trading emissions may become just as important as the credits themselves.

Top 5 Airports Driving Global Aviation Emissions as Expansion Fuels Climate Risks

Airports play a major role in shaping global aviation activity. When airports expand by adding new runways, terminals, and support infrastructure, they encourage more flights, more passengers, and more freight movement. As a result, greenhouse gas (GHG) emissions, air pollution, and noise pollution continue to rise.

Today, there are still no large-scale solutions capable of fully separating aviation growth from pollution. Because of this, airport expansion has become one of the biggest barriers to reducing aviationโ€™s climate impact.

Aviation Emissions Continue to Rise

The aviation industry remains a major source of climate pollution. Air travel emissions are still increasing, and current efforts to cut them are not strong enough. The sector continues to depend heavily on Sustainable Aviation Fuels (SAFs), but these fuels are not yet available at the scale needed to reduce emissions significantly.

At the same time, airlines and airports have adopted weak emission reduction strategies. This has allowed aviation pollution to continue growing even after global climate commitments under the Paris Agreement.

  • According to the Airport Tracker 2026 Policy report, airports around the world generated massive levels of pollution in 2023. The tracker studied 1,300 airports and found they produced around 1,022 million tonnes of CO2 emissions.

If the aviation sector were treated as a country, it would rank as the worldโ€™s fifth-largest emitter.

airport tracker data emissions
Source: Airport Tracker Data

Three airports alone โ€” Dubai, London Heathrow, and Los Angeles International Airport โ€” produced more than three times the CO2 emissions of the entire city of Paris in 2023.

London stood out as the most polluting airport system overall. Its six airports ranked highest for several pollutants, including:

  • Carbon dioxide (CO2)
  • Nitrous oxide
  • Carbon monoxide
  • Total hydrocarbons
  • Particulate matter

The Airport Tracker was created by ODI Global and Transport & Environment (T&E), with data support from the International Council on Clean Transportation (ICCT). The project aims to improve transparency and accountability around aviation emissions.

aviation emissions

A Threat to Paris Agreement Goals

The Paris Agreement, adopted in 2015, committed countries to limiting global warming to below 2ยฐC and ideally close to 1.5ยฐC above pre-industrial levels. However, current climate policies are not enough. Experts now project global warming could reach around 2.8ยฐC.

Although international aviation is not directly covered under the Paris Agreement, countries are still expected to include aviation emissions in their climate plans, known as Nationally Determined Contributions (NDCs).

  • The aviation sector currently produces around 2.5% of global energy-related CO2 emissions.
  • When non-CO2 effects such as contrails and other warming impacts are included, aviation has contributed roughly 4% of total global warming so far.

Compared to sectors like electricity generation and road transport, aviationโ€™s share may appear smaller. Yet there is one major difference: many industries are beginning to decarbonize, while aviation emissions continue to rise steadily.

Furthermore, the COVID-19 pandemic temporarily reduced emissions between 2020 and 2022 due to travel restrictions. But by 2024, aviation emissions had nearly returned to pre-pandemic levels across most regions.

Aviation Depends Almost Entirely on Fossil Fuels

Aviation remains one of the most oil-dependent industries in the world.

In 2024, oil supplied about 99% of all aviation fuel demand. This means any increase in air travel almost automatically leads to higher fossil fuel consumption and greater emissions.

Unlike road transport, aviation has limited alternatives. Electric vehicles, public transportation, and high-speed rail are helping reduce oil demand in other sectors. Aviation, however, still lacks scalable low-carbon solutions for long-distance travel.

As a result, aviation is expected to become one of the largest drivers of future oil demand growth.

Industry forecasts also show strong future growth. The International Air Transport Association (IATA) projects passenger demand could rise by 3.3% annually through 2050.

Passenger traffic may grow from 9 trillion revenue passenger-kilometers (RPKs) in 2024 to nearly 22 trillion RPKs by 2050.

Researchers estimate aviation alone could consume 15% of the remaining global carbon budget linked to limiting warming to 1.7ยฐC.

aviation emissions
Sourced from Airport Tracker

Why Airport Expansion Matters

Airport expansion directly increases aviation activity. Even today, many airports do not operate at full capacity. However, expanding them creates room for more flights and stronger long-term growth in passenger demand.

airport emissions
Source: Airport Tracker

Authorities around the world continue to plan new airport projects. In 2017 alone, developers planned or built 423 airport expansions and 121 new runways.

These projects have long-term consequences because airports are built to last for decades. Once new runways and terminals become operational, they lock countries into higher traffic levels and greater emissions far into the future.

Expansion also increases dependence on oil-based jet fuels. This creates another problem: countries become more vulnerable to unstable fuel prices and geopolitical tensions.

As global energy markets face increasing uncertainty, this growing reliance on fossil fuels adds financial and energy security risks alongside environmental damage.

Airport Emissions Are Deeply Unequal

The environmental impacts of aviation are not shared equally around the world.

Most aviation emissions come from wealthier countries and frequent flyers. Studies show that just 1% of the global population is responsible for half of all commercial aviation emissions.

Airport-level data reveals an even stronger concentration of pollution.

  • In 2023, the 20 highest-emitting airports produced 280 million tonnes of CO2. That represented more than 27% of all emissions generated by the 1,300 airports included in the Airport Tracker.

Eighteen of these top 20 airports were located in high-income countries, including eight in the United States.

The Top 5 Airports with the Highest CO2 Emissions Were:

    1. Dubai International Airport
    2. Heathrow Airport
    3. Los Angeles International Airport
    4. Incheon International Airport
    5. John F. Kennedy International Airport

Earlier studies compared major airports to coal plants that release about 4 million tonnes of CO2 each year. Based on this measure, the largest airports produced emissions equal to at least two coal plants each, while some matched the emissions of four coal plants.

The comparison becomes even more striking when airports are measured against the biggest cities, or even entire countries:

Top 5 Most Polluting Airports comparison chart

More than half of the worldโ€™s most polluting airports created over twice the emissions of Paris in 2023. Dubai, Heathrow, and Los Angeles airports each produced more than triple Parisโ€™ emissions.

Meanwhile, emissions from the Los Angeles International Airport alone equaled about 62% of all other emissions generated across the city of Los Angeles.

Top Airport Cities Produce Huge Emissions and Air Pollution

In some cases, looking at emissions from a single airport does not show the full picture. Many large cities have several airports, and together they create a much bigger pollution problem.

Data grouped by city shows that airport networks in London, New York, Dubai, and Tokyo each produced more than 20 million tonnes of CO2 in 2023. Refer to the infographic above for the emissions breakdown.

  • Together, the top 20 airport cities generated around 32% of the total CO2 emissions from the 1,300 airports covered in the study.

The report also revealed serious local air pollution in these major aviation hubs. In 2023, airports connected to London alone released more than 9,500 tonnes of nitrogen oxides (NOx) and 5,900 tonnes of carbon monoxide (CO).

They also emitted 556 tonnes of hydrocarbons (HC) and 36 tonnes of fine particulate matter (PM2.5), pollutants that can damage air quality and human health.

The United States Dominates Flight Activity

The United States leads the world in flight activity, especially domestic aviation.

Nine of the 10 busiest airports by flight numbers in 2023 were located in the United States. Each handled more than 230,000 departing flights annually. That equals roughly 630 flights every day.

US airports dominate freight and private jet activity, while major international hubs mainly lead in passenger traffic.

This concentration of flights increases both local pollution and global emissions. Communities living near airports also face worsening air quality and growing noise pollution.

united states
Source: Airport Tracker

Aviation Faces a Difficult Climate Future

The aviation sector continues to move in the opposite direction of global climate goals. While many industries are slowly reducing emissions, aviation demand keeps growing.

Airport expansion is accelerating this trend by encouraging more flights and locking in fossil fuel use for decades.

Without stronger policies, cleaner technologies, and limits on unchecked airport growth, aviation emissions will remain a major challenge in the fight against climate change.

The Cost of “Firm” Solar and Wind Power Is Entering a New Phase: Prices Could Fall Below $50/MWh by 2035, IRENA Finds

Solar and wind energy are now the cheapest sources of new electricity in many parts of the world. Over the last decade, costs have dropped sharply, making renewable energy more affordable than coal and gas in several markets. However, the biggest challenge today is no longer just producing clean electricity. The real challenge is making sure renewable power is available all day and night, even when the sun is not shining or the wind is weak.

That is where battery storage and hybrid renewable systems come in.

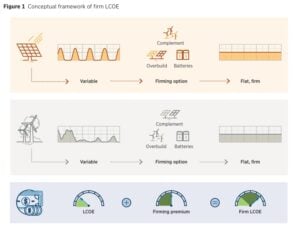
A new report from the International Renewable Energy Agency, titled 24/7 Renewables: The Economics of Firm Solar and Wind, explains how solar, wind, and battery energy storage systems (BESS) can now provide reliable round-the-clock electricity at competitive prices. The report shows that in regions with strong renewable resources, clean energy systems can already compete with fossil fuels on both cost and reliability.

The Rise of โ€œFirmโ€ Renewable Power

Solar and wind are variable energy sources. Solar panels only generate power during the day, while wind output changes depending on weather conditions. Because of this, renewable systems need support from storage or backup systems to provide continuous electricity.

This process is known as โ€œfirming.โ€ It means transforming variable renewable electricity into a dependable power supply that can operate 24/7.

Battery storage plays a major role in this transition. Batteries store excess renewable electricity during periods of high generation and release it later when demand rises or renewable output falls. Developers also use larger renewable systems, called โ€œgeneration overbuild,โ€ to make sure enough electricity remains available during weaker weather conditions.

According to IRENA, the economics of these systems have improved dramatically because renewable and battery costs have fallen at record speed.

irena firm renewable
Source: IRENA

Renewable and Battery Costs Have Collapsed

Since 2010, the renewable energy industry has gone through a major cost revolution.

IRENA said:

  • Solar installation costs declined by 87%
  • Onshore wind costs dropped by 55%
  • Battery storage costs plunged by 93%

These declines completely changed the economics of clean electricity.

In 2020, firm solar-plus-storage systems often cost more than $100 per megawatt-hour (MWh). By 2025, costs in high-quality solar regions fell to around $54/MWh to $82/MWh.

That already places renewable electricity in direct competition with fossil fuels.

For comparison:

  • New coal generation in China costs around $70/MWh to $85/MWh
  • New gas-fired electricity globally often exceeds $100/MWh

China solar pv

IRENA expects costs to continue falling. The agency projects another 30% decline by 2030 and roughly 40% by 2035. At the best-performing renewable sites, firm renewable electricity could fall below $50/MWh.

Geography Determines Success

The report highlights that geography is one of the most important factors in renewable economics.

Regions with strong sunlight and stable wind conditions need less storage and less overbuilding. This lowers total system costs.

High-irradiance desert regions and strong wind corridors perform especially well because renewable generation remains more stable over time.

However, not every region has ideal renewable conditions.

Some locations experience long periods of weak wind and low sunlight simultaneously. These events are known in the energy sector as โ€œDunkelflauteโ€ or โ€œdark doldrums.โ€ During these periods, renewable output can remain low for several days.

IRENA said these prolonged low-generation events have a bigger impact on costs than normal day-to-day variability.

In weaker renewable regions, firm renewable power becomes more expensive because systems require larger batteries and more backup generation capacity. In such cases, countries may need additional solutions like:

  • Long-duration energy storage
  • Geothermal energy
  • Regional electricity interconnections
  • Flexible grid systems

The report makes it clear that storage alone cannot solve every challenge if renewable resources are poor.

Wind Plus Storage Also Gains Momentum

The report also analyzed wind-plus-storage systems.

In 2025, firm wind-plus-storage costs ranged from:

  • Around $59/MWh in Inner Mongolia
  • Roughly $88/MWh to $94/MWh in Brazil, Germany, and Australia

IRENA projects costs could decline further to around $49/MWh to $75/MWh by 2030.

The agency also noted that combining wind and solar together improves economics even more. Because wind and solar often generate electricity at different times, hybrid systems reduce storage requirements and improve reliability.

This lowers total system costs while increasing overall energy availability.

wind
Source: IRENA

The UAEโ€™s Al Dhafra Project Shows Whatโ€™s Possible

Large renewable projects are already proving that round-the-clock clean electricity is commercially viable. One major example is the Al Dhafra Solar PV project in the United Arab Emirates.

The project combines:

  • 5.2 gigawatts (GW) of solar power
  • 19 gigawatt-hours (GWh) of battery storage

Together, the system will deliver a firm 1 GW of continuous clean electricity. That output is similar to a large traditional thermal power plant.

IRENA estimates the projectโ€™s firm electricity cost at around $70/MWh.

This demonstrates that renewable systems can now provide services once considered possible only with coal or gas plants.

Data Centers and AI Could Drive Demand

The report says hybrid renewable systems are becoming increasingly attractive for industries that need uninterrupted electricity.

This includes:

  • Artificial intelligence infrastructure
  • Data centers
  • Advanced manufacturing facilities
  • Clean hydrogen production

These industries require constant, high-quality power. As electricity demand from AI and digital infrastructure grows rapidly, many companies are looking for reliable, clean energy solutions that reduce exposure to fossil fuel price volatility.

Battery-backed renewable systems also help companies stabilize long-term energy costs because they are not tied to fuel markets.

This advantage has become more important after recent geopolitical disruptions, including shipping tensions in the Strait of Hormuz, which affected global fossil fuel markets.

Clean Energy Standards Are Changing

Another major trend supporting firm renewable systems is the growing focus on hourly clean electricity matching.

Traditionally, companies could claim renewable electricity use through annual accounting systems. However, critics argued this approach ignored whether clean electricity was actually available at the time electricity was consumed.

Now, regulators and climate frameworks are moving toward stricter hourly and location-based accounting systems.

These changes are already appearing in:

  • European renewable hydrogen certification rules
  • Carbon Border Adjustment Mechanism (CBAM) policies
  • Emerging granular certificate systems

These new frameworks reward flexible renewable systems with storage because they provide electricity exactly when it is needed.

Renewable Energy Is Becoming a Strategic Asset

IRENA Director-General Francesco La Camera said the long-standing argument that renewables are unreliable no longer holds true.

According to the agency, renewable energy is now offering more than environmental benefits. It is also becoming a tool for economic stability, energy security, and resilience.

Construction timelines for hybrid renewable projects are also relatively short. Many projects can now be completed within one to two years after securing permits and grid access.

That speed gives renewables another advantage over many conventional power projects.

The report ultimately shows that the energy transition is entering a new phase. The focus is no longer only on generating cheap renewable electricity. It is now about building systems that can deliver reliable, clean power every hour of every day.

And in many parts of the world, that future has already started.

Copper Prices Rise Past $14,000 as AI Demand, Peru Supply Shock, and Global Deficit Concerns Tighten Market

Copper prices hit new multi-year highs in 2026. This rise is due to supply disruptions, increased industrial demand, and structural shortages in global mining markets.

On the London Metal Exchange (LME), copper rose to $14,153 per metric ton on May 13, 2026. This marks its first time over $14,000 since January. Itโ€™s now approaching its all-time high, which is above $14,500 per ton.

In the United States, COMEX copper futures also hit a record near $6.64 per pound on May 13, 2026, marking one of the strongest rallies in recent years.

Global copper markets showed little volatility in trading (Aug 14, 2026), posting a marginal 0.01% increase with global prices at $6.59/lb and Chinese spot rates at ยฅ98,000/Ton. Prices are balancing acute supply constraints against macroeconomic headwinds. Strong underlying support stems from rapidly shrinking LME warehouse inventories, surging US imports, and the DRC concentrate export ban. However, downstream demand hesitation and looming tariff uncertainties continue to cap further upside momentum.

Copper Price

Unit: USD/lb
---
---
Loading Chart...

The metal is now up roughly 40% over the past year and about 75% since late 2023, showing a sustained upward trend rather than a short-term spike.

Peru Energy Crisis Raises New Supply Risks

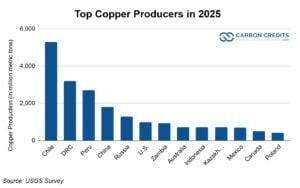
One of the biggest recent drivers of copperโ€™s rally is growing supply uncertainty in Peru, the worldโ€™s third-largest copper producer in 2025. This is according to data from the latest U.S. Geological Survey.

top copper producers 2025 usgs data

On May 11, Peru issued an emergency decree (Decreto de Urgencia 003-2026) to manage a worsening energy crisis. The government said it would prioritize electricity for households and essential services. This raises concerns that industrial users, including copper mines, could face power restrictions.

  • LME copper jumped as much as 1.2% in a single session to $14,106.50 per ton following the announcement.

The timing is critical because the global copper supply is already under pressure. Analysts say Peru’s disruption worsens production issues in other areas. This tightens the global supply of refined copper.

Global Mine Disruptions Push Market Into Deficit Risk

Supply challenges are not limited to Peru. One of the worldโ€™s largest copper mines, Freeport-McMoRanโ€™s Grasberg operation in Indonesia, has also faced delays after a major incident last year. Full recovery has now been pushed to 2027โ€“2028, with current output running at only 40โ€“50% capacity.

These disruptions are now feeding into global supply forecasts. The International Copper Study Group estimates a deficit of 150,000 tonnes in 2026. In contrast, J.P. Morgan predicts a shortfall of up to 330,000 tonnes. This gap is due to supply cuts and increased demand.

CITIC Securities has also flagged that global copper production forecasts for 2026 are now trending downward due to ongoing mine disruptions.

At the same time, Chinaโ€™s refined copper imports reached 452,000 tonnes in April 2026, showing that demand remains strong even as supply tightens.

AI, Clean Tech, and Electrification Turn Copper Into a Strategic Metal

While supply tightens, demand is accelerating from multiple long-term growth sectors. Copper is a critical material for electricity grids, electric vehicles, renewable energy systems, and now artificial intelligence infrastructure.

AI data centers, in particular, are emerging as a major new source of demand. JPMorgan estimates that AI-related data centers could add around 110,000 tonnes of additional copper demand by 2026. BloombergNEF predicts that data center infrastructure could hold over 4.3 million tonnes of copper by 2035.

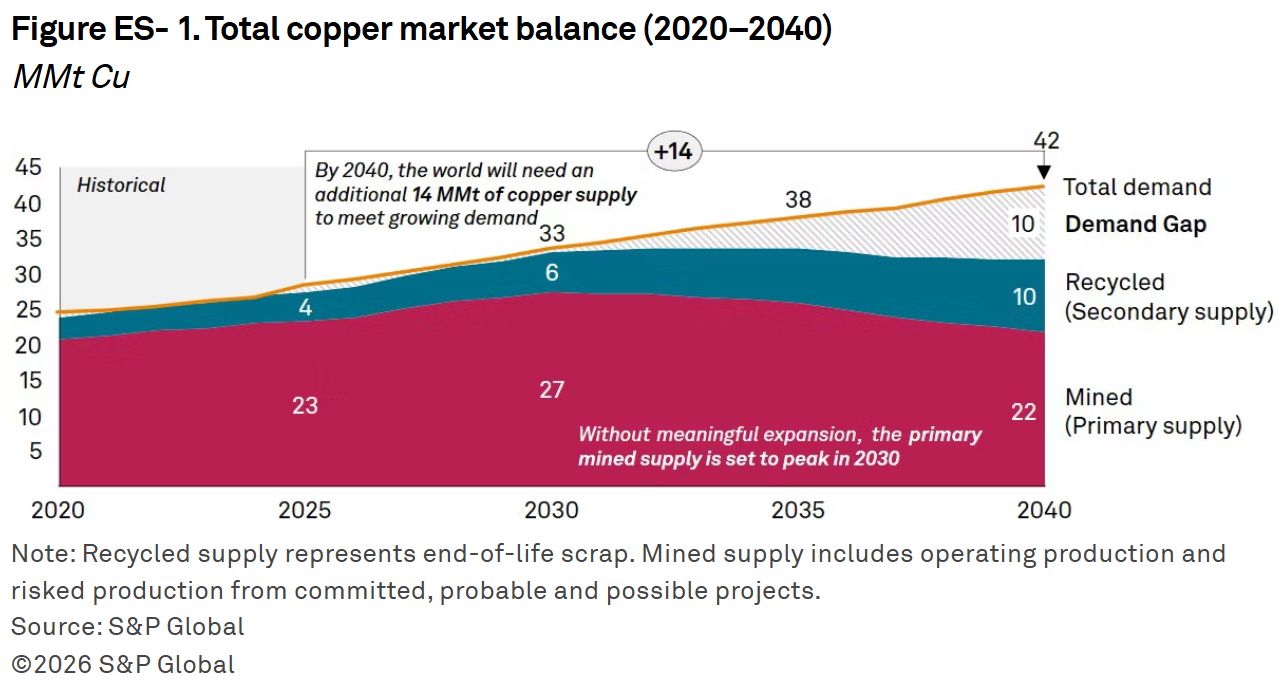
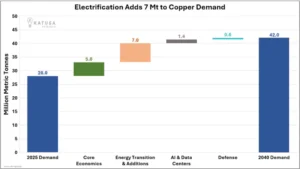
S&P Global predicts that global copper demand will grow by 50% by 2040, meaning it will hit around 42 million tonnes each year. Electrification and advanced technologies will drive this increase.

copper market 2040 s&p global

China is also reinforcing demand momentum. Export data revealed a 14.1% increase in April 2026 compared to last year. This rise exceeded expectations, driven by strong demand for copper-intensive goods. Key items included electric vehicles, lithium batteries, and solar panels.

  • EV exports rose 53% year-on-year
  • Solar exports increased 80% year-on-year
  • Battery exports climbed 34% year-on-year

These trends reinforce copperโ€™s role as a core input in the global energy transition.

RELATED: Rio Tintoโ€™s FY25 Profit Falls 14%, but Copper Projects and Sustainability Efforts Stand Out

Hidden Bottleneck: The Sulfuric Acid Crunch No One Is Pricing In

Beyond mining disruptions, copper is facing a less visible but critical constraint: input shortages.

A key issue is the global shortage of sulfuric acid, which is essential for copper extraction. Export restrictions from China, Russia, and other countries have tightened supply. Spot prices have doubled since February in some markets.

Chile, which relies heavily on imported sulfuric acid for copper production, has been particularly affected. The country produces roughly 20% of global copper output, meaning input shortages there have global consequences.

Energy markets are also playing a role. Copper production uses a lot of energy. Higher costs for electricity and fuel are adding pressure on production in key mining areas. These combined bottlenecks are limiting the industryโ€™s ability to respond quickly to rising demand.

Tariffs and Geopolitics Add Fuel to an Already Heated Market

Trade policy is also tightening global copper flows. The United States has set a 50% tariff on copper-heavy products under Section 232.ย  This has changed how refined copper flows into the U.S. market. It has also tightened availability in other regions and added volatility to global pricing.

Geopolitical tensions, including risks around key shipping routes like the Strait of Hormuz, have also contributed to market uncertainty. While the direct impact has been limited so far, traders continue to price in potential disruptions to energy and industrial supply chains.

Market Outlook: Structural Tightness Likely to Continue

Despite short-term volatility, most market analysts expect copper prices to remain elevated. Major banks forecast prices to stay between $13,000 and $15,000 per ton, depending on supply conditions and global demand trends.

J.P. Morganโ€™s estimated 330,000-tonne global deficit for 2026 highlights how tight the market could become if disruptions continue. Even modest demand growth from AI and electrification could deepen the imbalance.

  • Electrification in various sectors will require 7 million tonnes of copper by 2040.ย 
copper demand by electrification 2040
Chart from Katusa Research

Some analysts say copper is acting less like a cyclical commodity. Instead, it seems more like a strategic metal linked to long-term infrastructure growth.

Overall, copperโ€™s surge above $14,000 reflects more than a traditional commodity rally. Three overlapping forces are driving it:

  • Supply shocks in key producers like Peru and Indonesia.
  • Rapid demand growth from AI, electrification, and clean energy.
  • Rising input constraints and geopolitical pressure.

With global deficits emerging and demand accelerating, copper is entering a structurally tight phase. If current trends continue, the metal will remain central not only to industrial growth but also to the global energy transition and digital infrastructure expansion.

Singapore-Based FlyORO and Aether Fuels Team Up to Explore Smarter SAF Blending and Fuel Delivery Solutions

Singapore-based companies FlyORO Technologies Pte. Ltd. and Aether Fuels have signed a non-binding Memorandum of Understanding (MOU) to develop sustainable aviation fuel (SAF) infrastructure. Their focus includes blending, logistics, and supply chain development.

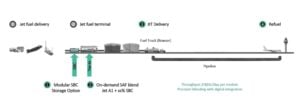
This agreement supports Aetherโ€™s SAF initiative, Project Beacon, and future projects. The partnership will explore advanced fuel production, blending systems, storage, certification, and delivery networks.

The aviation industry needs to cut carbon emissions. Airlines worldwide seek cleaner fuel options to meet climate goals and reduce fossil fuel use. However, SAF production is still limited. Better infrastructure and scalable technologies are essential to meet future demand.

And this partnership aims to tackle these challenges.

FlyORO and Aether believe that advanced fuel production and modular blending systems can improve SAF availability and efficiency. They also want to enhance Singapore’s role as a hub for aviation innovation and sustainable growth.

Jonathan Yeo, Chief Executive Officer, FlyORO Technologies Pte. Ltd. said:ย 

Project Beacon: Southeast Asia’s First Next-Generation SAF Facility

At the heart of this collaboration is Project Beacon, Aetherโ€™s planned facility at the Aster Pulau Bukom refinery.

Aether claims this project could be the first commercial-scale SAF facility in Southeast Asia. It will use advanced fuel conversion technology, applying its Aurora technology to convert industrial waste gas and biomethane into SAF.

The facility aims to produce about 50 barrels of SAF daily, or nearly 2,000 tonnes annually. Aether estimates this fuel could reduce lifecycle greenhouse gas emissions by over 70% compared to traditional jet fuel.

Why It Stands Out

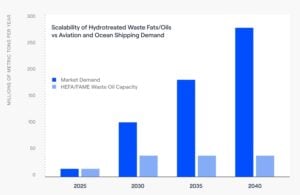
Project Beacon is unique because it uses a different production method than many existing SAF projects. Most current SAF production relies on the HEFA pathway, which mainly uses waste fats, oils, and greases. While this method has grown the market, feedstock availability is still a concern.

Aether believes its Aurora technology can address this challenge.

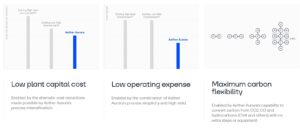
Instead of relying on a single feedstock, Aurora can use various waste carbon sources, such as industrial off-gases and biomethane. This flexibility may boost fuel yields, lower costs, and support larger SAF production in the future.

ather aurora
Source: Aether

The gap between SAF demand and supply is a growing concern for aviation. Governments, airlines, and corporate customers are increasing their sustainability commitments, leading to strong long-term demand for cleaner fuels.

Conor Madigan, Founder and Chief Executive Officer, Aether Fuels, noted:

โ€œProject Beacon is intended to demonstrate Aetherโ€™s breakthrough Aurora technology in commercial operation and unlock new and more abundant waste carbon feedstocks for SAF production. Working with FlyORO on this project gives us an opportunity to evaluate how downstream blending and supply-chain innovation can support commercialization in Singapore and accelerate overall SAF industry development.โ€

Aether Fuels: Pioneering Flexible and Scalable SAF Growth

Aether Fuels emphasizes that the future of SAF relies on scalable, flexible, and cost-effective production.

The aviation and shipping sectors may need nearly one billion metric tonnes of sustainable fuel annually by 2050 to achieve global net-zero goals. Replacing high-energy fuels for long-distance travel with battery technology is challenging.

SAF
Source: Aether
  • Thus, sustainable liquid fuels will remain vital for reducing emissions in these industries.

However, the SAF industry faces a major hurdle. Demand is rising quickly, but supply is limited due to existing pathways that depend on restricted feedstock and costly infrastructure.

Aether believes next-generation technologies must leverage abundant waste-carbon sources to close this supply gap. Aurora was developed with this goal in mind.

Producing SAF is just one part of the process. The fuel must also flow efficiently through the supply chain to reach airports and airlines. Thatโ€™s where FlyOROโ€™s blending technology is crucial.

FlyORO: Innovating Blending Technology for the Partnership

FlyOROโ€™s role in this collaboration focuses on blending and fuel logistics. The company will assess how its AlphaLite blending system can support Project Beacon and future Aether SAF initiatives.

AlphaLite is a modular SAF blending unit housed in a 40-foot container. It can integrate with existing fuel infrastructure and function at various points in the aviation fuel supply chain, including production sites, terminals, and airport fuel farms.

  • One key advantage of AlphaLite is its flexibility. Operators can choose where blending is most efficient based on logistics, costs, infrastructure, or regulations.

FlyORO also highlighted AlphaLiteโ€™s โ€œlast-mile blendingโ€ capability. This allows blending closer to airports or final delivery points instead of transporting pre-blended fuel over long distances.

  • This approach enhances traceability, transparency, and operational efficiency.
  • It can also help airlines and fuel suppliers manage sustainability reporting and book-and-claim systems better.

The company designed the AlphaLite platform to align with evolving global SAF standards and regulations. As international SAF policies change, the company expects its technology to adapt while maintaining fuel quality and safety.

FlyRo saf alphalite
Source: FlyORO

Real-World Airport Deployment Proves AlphaLiteโ€™s Effectiveness

FlyORO has already tested AlphaLite in a real airport setting. In 2025, the company deployed the system with Wagner Sustainable Fuels and Boeing at Toowoomba Wellcamp Airport.

flyro
Source: FlyORO

This project marked the worldโ€™s first SAF blending terminal at an airport. It showed that modular blending systems can operate effectively in live aviation conditions.

The deployment also helped AlphaLite achieve Technology Readiness Level 9 (TRL 9), confirming its success in commercial operations.

  • As of May 2026, FlyORO reported blending over 500,000 liters of SAF through AlphaLite deployments.

This experience could help assess how modular blending systems might support Project Beacon and future Aether projects.

Singapore Strengthens Its Role in Sustainable Aviation

The proposed partnership highlights Singapore’s rising role in clean energy and sustainable aviation.

Singapore is already a global hub for aviation, shipping, and fuel trading. Now, it aims to be a center for low-carbon fuel technologies and sustainable projects.

Aether and FlyORO are joining forces. By combining Aetherโ€™s waste-carbon tech with FlyOROโ€™s blending skills, they aim to boost SAF use in aviation.

Both firms believe this partnership could increase SAF availability. It may also enhance supply chain flexibility and support long-term aviation decarbonization goals.

However, the MOU remains non-binding and non-exclusive. Future commercial partnerships will depend on technical studies, regulatory approvals, negotiations, and final agreements.

The agreement shows that the aviation industry is dedicated to scalable and practical SAF solutions. Airlines are working hard for lower-carbon operations.