Enel Unveils €20B Renewables Push to Add 15GW by 2028

Enel, the Italian energy giant, is increasing its commitment to clean power for the coming years. The company has unveiled its new 2026–2028 Strategic Plan, which outlines a major expansion in renewable energy and grid investment.

Under the plan, Enel will invest €53 billion over three years. This marks a 23% increase compared with the previous strategy. Of this total, nearly €20 billion will go directly into renewable energy projects.

The renewable spending will support the addition of 15 gigawatts (GW) of new clean energy capacity by 2028. This expansion will bring Enel’s total installed renewable capacity to about 80 GW globally.

The plan reflects the company’s effort to grow clean energy while maintaining financial discipline. The company aims to strengthen earnings and improve returns, while accelerating the shift to low-carbon electricity.

Flavio Cattaneo, CEO of the Enel Group, said:

“Today, Enel presents an ambitious and credible Strategic Plan with a sharp acceleration in growth thanks to an increase of Greenfield and Brownfield investments, which will lead to further improvement of the Group’s risk/return profile. The managerial actions carried out in the last three years provide us with the financial flexibility to invest in the most dynamic markets in terms of electricity demand.”

€20 Billion Commitment: The Clean Power Blueprint

Under Enel’s 2026–2028 Strategic Plan:

Enel renewable investments 2026-2028
Source: Enel
  • €20 billion will fund renewable energy projects.
  • Enel will add 15 GW of new renewable capacity by 2028.
  • Total renewable capacity will rise to about 80 GW.
  • The company’s total gross investment across all businesses will reach €53 billion over three years.
  • These figures show a strong push toward carbon-free power. Renewables now represent one of the largest components of Enel’s capital plan.

The new capacity will focus mainly on wind and solar power. These technologies remain cost-effective and scalable. Enel will also invest in hydroelectric plants and battery storage systems. These technologies help balance wind and solar output.

By adding 15 GW, Enel is positioning itself among the largest global renewable power producers.

How This Fits Into Enel’s Broader Strategy

The €53 billion investment plan covers more than renewables. A large share of spending will go to electricity networks, wherein grid modernization remains a key priority. Stronger grids allow more renewable energy to connect and flow efficiently.

The company is directing most investments toward markets in Europe and North America, which together account for more than €23 billion of total planned spending. Around €3 billion is allocated to Latin America.

Enel expects its strategy to generate solid financial results. Over the 2026–2028 period, the company projects cumulative ordinary EBITDA of €74 billion.

Enel ebitda strategic plan
Source: Enel

The company says it will maintain a disciplined approach to capital allocation. It plans to focus on projects with stable regulation, clear returns, and predictable cash flow.

Where the Renewables Will Grow

Enel’s renewable expansion will cover several key technologies, including:

  • Onshore Wind and Solar

Most of the 15 GW addition will come from onshore wind and solar farms. These projects can be built at scale and deployed quickly.

Wind and solar are central to Enel’s strategy because they deliver competitive electricity costs and support decarbonization goals.

  • Hydro and Dispatchable Renewables

Hydropower remains important for Enel. Unlike solar and wind, hydro can generate electricity on demand. This helps stabilize grids when renewable output varies.

Dispatchable renewable assets help ensure a steady supply during peak demand.

  • Battery Storage

Battery systems are essential for integrating variable renewables. Storage allows electricity to be saved and used later.

By combining wind, solar, hydro, and batteries, Enel aims to provide cleaner electricity around the clock.

From Coal Exit to Renewable Leadership

Renewables are central to Enel’s long-term climate goals. The company aims to achieve 100% renewable generation and fully exit coal by 2040. This objective aligns with global decarbonization targets and European climate policy.

Electricity demand continues to rise worldwide. Growth is driven by the electrification of transport, industry, and heating. Data centers and digital services also increase demand.

As more sectors shift from fossil fuels to electricity, utilities must expand clean generation capacity. Enel’s investment plan responds directly to this trend.

By scaling renewables and strengthening networks, the company aims to support both climate goals and rising electricity consumption.

What’s Inside Enel’s 2040 Net-Zero Goals?

Enel has set clear goals to fight climate change. The company aims to reach net zero greenhouse gas emissions by 2040, a full decade sooner than the global 2050 target set under the Paris Agreement. This means Enel plans to eliminate all direct and indirect emissions across its operations and value chain.

A key part of this strategy is switching all energy production to sustainable sources like wind, solar, and hydroelectric power. Enel also plans to exit the natural gas sector, so renewable electricity will be the only type of energy it supplies to its customers.

Enel’s climate targets align with the 1.5°C limit — the most ambitious goal of the Paris Agreement. These targets have been validated by the Science-Based Targets initiative (SBTi), meaning they follow science-based methods for emissions reduction.

enel ghg footprint and net zero
Source: Enel

The company has outlined milestone steps on the path to 2040. By 2025, it expects renewables to make up about 75% of its total electricity production. By 2027, Enel plans to finish phasing out all coal-fired power plants. Then by 2040, all of its installed capacity will come from renewable sources, and all direct and indirect emissions will be eliminated.

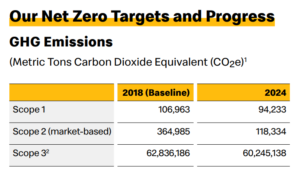
Enel has already made measurable progress. Its operational emissions (Scope 1 and Scope 2) have dropped significantly from a 2017 baseline. The company is working to reduce emissions across its value chain (Scope 3 emissions) as well.

Enel absolute ghg emissions 2024
Source: Enel

To support these goals, Enel engages with suppliers and customers. It helps them reduce their own emissions through clean energy solutions and energy efficiency programs. This broader approach aims to cut emissions not just within Enel’s operations, but across the entire energy ecosystem.

Scaling Renewables Amid Market Pressures

The energy sector faces ongoing challenges. Rising interest rates have increased financing costs. Supply chain issues have affected equipment delivery. Inflation has pushed up construction expenses.

Enel acknowledges these pressures. The company says it will prioritize projects that offer stable returns and operate in strong regulatory environments.

Partnerships and flexible financing will also help manage risk. This includes cooperation with institutional investors and local partners.

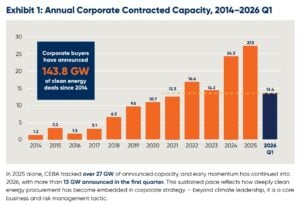
Despite these market challenges, the long-term outlook for renewables remains positive. Clean energy continues to attract capital as governments and businesses pursue decarbonization. Big tech companies are the major purchasers of clean energy, with booming data centers as the main driver.

corporate clean energy purchases BNEF 2025

Utilities Powering the Next Phase of Decarbonization

Enel’s decision to invest €20 billion in renewables and €53 billion overall through 2028 signals confidence in clean energy as a core growth driver.

The planned 15 GW capacity increase will strengthen its position as a major renewable producer. It will also support grid stability and energy security in key markets.

As countries set ambitious 2030 and 2040 climate targets, utilities like Enel play a central role. Expanding renewable capacity, modernizing grids, and maintaining financial discipline are all essential parts of the transition.

Through its 2026–2028 plan, Enel aims to balance sustainability with profitability. By scaling renewables while maintaining strong earnings, the company is positioning itself for the next stage of global energy transformation.

Microsoft Hits 100% Renewable Electricity Milestone With 40GW Clean Energy Portfolio

Microsoft has achieved a major sustainability milestone by matching 100% of its global electricity use with renewable energy. The target, set in 2020, was part of the company’s wider climate goals and originally slated for completion by 2025.

The company bought enough clean power to meet all its electricity needs. This covers the total use at its data centers, offices, campuses, and facilities around the world for the year.

It is one of the largest corporate clean energy achievements ever recorded. The milestone shows how major energy buyers can boost renewable infrastructure and cut emissions.

Microsoft’s Chief Sustainability Officer, Melanie Nakagawa, said:

“This is an important step on our path to carbon negativity. Electricity is a major source of emissions for Microsoft – and for many organizations. Microsoft’s experience building our clean energy portfolio has served as an important catalyst in driving commercial demand for infrastructure and innovation across the power sector.”

The Scale of Microsoft’s Renewable Energy Portfolio

Microsoft’s renewable matching does not mean every kilowatt-hour it uses comes directly from clean sources every hour of the day. Instead, the company matched its total annual electricity use with clean energy it helped finance.

The tech giant’s renewable energy portfolio is extensive and global in scale. Since 2013, when the company signed its first 110 MW power purchase agreement in Texas, it has grown its clean energy commitments. As of 2025, Microsoft has contracted about 40 gigawatts (GW) of new renewable energy supply across 26 countries.

Microsoft clean energy potfolio
Source: Microsoft

Of this total, roughly 19 GW is already online and delivering electricity to the grid. The remaining 21 GW are expected to become operational during the next five years.

  • To help put this scale into context, 40 GW of renewable capacity is roughly enough electricity to power 10 million U.S. homes.

The big tech company quickly grew its renewable energy contracts. It went from about 1.8 gigawatts in 2020 to 40 gigawatts by 2025, showing an increase of around 2,100% in just five years. This sharp rise reflects the company’s accelerated clean energy procurement strategy.

Microsoft Clean Energy Capacity (2020 vs. 2025)

The scale of growth shows how quickly large technology firms are securing long-term clean power contracts to support expanding data center and AI operations while reducing emissions.

Microsoft’s clean energy contracts include solar, wind, hydro, and other renewables. These projects are built under long-term agreements called power purchase agreements (PPAs). These PPAs usually last 10 to 15 years, which gives renewable energy developers steady revenue. It also helps them fund new clean energy plants.

How Renewable Matching Works

Matching 100% of electricity use with renewables means Microsoft buys as much renewable energy as it uses each year.

The company achieves this mainly through long-term PPAs, which finance new generation capacity. PPAs occur when Microsoft contracts with renewable energy developers to buy power at a set price over many years.

Microsoft buys renewable energy in key U.S. markets like PJM Interconnection, MISO, and ERCOT. It also invests in renewable capacity in Europe, the Asia Pacific, and Latin America.

Renewables from grid programs and clean tariffs count toward the matching goal. This is true when they have long-term contracts, not short-term “spot” credits.

This approach helps ensure that Microsoft’s demand supports new renewable capacity, not just transfers ownership of existing clean power. Long-term contracts allow developers to build new projects.

SEE MORE on Microsoft: 

Powering the Path to Carbon Negative by 2030

Matching 100% of electricity use with renewable energy is a central step in Microsoft’s broader climate strategy. In 2020, Microsoft announced a “moonshot” goal to become carbon negative by 2030. This means removing more carbon than it emits.

Microsoft 2030 carbon negative goal
Source: Microsoft

The renewable matching effort also helps reduce Scope 2 emissions, which are those associated with purchased electricity. Microsoft estimates it has cut its Scope 2 CO₂ emissions by around 25 million metric tons since starting its clean energy journey.

Microsoft’s renewable electricity commitment is part of a larger climate plan. This plan includes investing in carbon removal, improving efficiency, and exploring new technologies.

Microsoft carbon removals by the numbers 2025

The tech giant created a Climate Innovation Fund. It has invested hundreds of millions in energy systems, storage, and grid innovation.

The company closely tracks Scope 2 progress. It also tracks how fast artificial intelligence (AI) and cloud computing grow. This growth impacts total energy demand and emissions.

From Texas to India: A Global Procurement Strategy

Microsoft’s renewable energy contracts span many countries and energy markets.

In the United States, Microsoft has focused on major grid regions like PJM Interconnection (about 8,089 MW contracted), MISO (7,897 MW), and ERCOT (4,696 MW).

In Europe, the UK leads with about 1,666 MW of renewable capacity contracted, followed by Spain (1,496 MW) and Germany (1,425 MW).

Renewable capacity is also growing in the Asia Pacific. India leads with 1,011 MW, while Australia follows with 868 MW. This geographic diversity spreads investment. It also boosts renewable capacity in markets at different stages of energy transition.

Microsoft is exploring new procurement models and agreements. They are tailoring solutions for local markets and regulations.

Big Tech’s Expanding Role in Grid Decarbonization

Microsoft’s renewable energy milestone reflects a wider shift in corporate clean energy demand. Bloomberg New Energy Finance reports that over 200 global companies have bought almost 200 GW of clean energy since 2008. Microsoft’s efforts are part of this broader trend.

Big tech companies like Google, Amazon, and Meta have pledged to use renewable energy for their data centers and operations. These companies typically use PPAs to finance new wind and solar projects around the world.

corporate clean energy purchases BNEF 2025

The renewable energy demand from major corporations helps mobilize capital, lower financing costs, and accelerate the deployment of clean infrastructure.

This market signal can boost investor confidence. It also encourages utilities to adopt cleaner generation plans. These plans align with long-term decarbonization goals.

Analysts say that matching yearly renewable energy use with clean electricity doesn’t mean all power use is emissions-free at every moment. Balancing electricity supply with demand each hour, known as 24/7 carbon-free electricity, is a tough task.

Microsoft’s milestone is a big win for corporate climate action. This is true even with the challenges faced.

Beyond Annual Matching: The 24/7 Clean Power Challenge

Microsoft says it will continue to conduct renewable energy contracting to support future growth and climate goals.

Through 2030, the company plans to maintain 100% annual renewable matching and expand into emerging markets. This includes looking into more carbon-free sources like nuclear power. It also covers grid-enabling technologies to meet clean energy needs anytime.

The company is also scaling partnerships to extend its clean energy footprint. It has several contracts with global energy partners that each provide more than 1 GW of capacity.

As energy demand from cloud and AI services continues to grow, Microsoft’s renewable portfolio and innovation efforts will be central to balancing electrification with climate commitments.

Kazatomprom Deepens Strategic Ties with India in Major Long-Term Uranium Supply Deal

National Atomic Company Kazatomprom JSC, the world’s largest uranium producer, has moved closer to sealing a massive long-term supply deal with India. The Kazakh state miner announced that it plans to sell a significant portion of its natural uranium concentrates to India’s Department of Atomic Energy (DAE).

However, the transaction is so large that it requires shareholder approval under Kazakhstan’s Joint Stock Companies law. As a result, the company has called an Extraordinary General Meeting (EGM) at the initiative of its Board of Directors.

If approved, the agreement could tighten an already strained global uranium market.

A Deal That Could Reshape Uranium Supply

The proposed contract signed with the Directorate of Purchase & Stores (DPS) under India’s DAE, covers the long-term sale of natural uranium concentrates (U₃O₈) for physical delivery to India.

The value of the transaction equals or exceeds 50% of Kazatomprom’s total book asset value. Under Kazakh law, such a major transaction must go before shareholders for approval.

While pricing, volumes, and delivery schedules remain confidential due to commercial sensitivity, the scale alone signals its strategic weight.

Kazatomprom’s Q4 2025 Fourth-Quarter Uranium Output

Kazatomprom currently accounts for about 20% of global uranium production. In 2025, it produced 25,839 tonnes of uranium (around 67.2 million pounds U₃O₈) on a 100% basis. That marked a 10–11% increase from 2024, driven largely by ramp-up at JV Budenovskoye.

  • Meanwhile, spot transactions increased sharply. Spot volumes rose 50% year-over-year to 55.3 million pounds U₃O₈ (around 21,270 tonnes), with an average price of $72.75 per pound.
  • Group sales volumes reached 5,719 tonnes (14.87 million pounds U₃O₈), up 14% from the previous year.
Kazatomprom uranium
Source: Kazatomprom

At the same time, global uranium mine production for 2025 was projected at 62.2 kilotonnes (ktU), according to industry estimates. Reactor demand stands higher at 68.9 ktU. This gap highlights a persistent supply deficit. Therefore, removing a sizeable share of Kazakh output under long-term contracts with India could tighten spot availability even further.

global uranium output
Source: Mining.com, data from Global Data

Fueling India’s Nuclear Ambitions: Why Uranium Imports Matter

India’s nuclear expansion explains the urgency behind this deal.

The country’s domestic uranium production currently meets only about 36% of its needs. Between 2025 and 2033, imports were projected to reach roughly 9,000 tonnes of uranium (tU) to support new reactor capacity.

India holds recoverable reserves estimated at 252,500 tU below $260/kgU. In addition, the Atomic Minerals Directorate for Exploration and Research (AMD), a unit of the Department of Atomic Energy, has identified 433,800 tonnes of in-situ U₃O₈ resources across 47 deposits in states including Andhra Pradesh, Jharkhand, Rajasthan, and Telangana.

Mining at Jaduguda began in 1967 under Uranium Corporation of India Limited (UCIL). Recently, AMD discovered 26,437 tonnes of additional in-situ uranium oxide resources at the Jaduguda North–Baglasai–Mechua deposit in Jharkhand. This discovery is expected to extend the mine’s life significantly.

Still, domestic output alone cannot support India’s long-term reactor fleet expansion. Hence, securing a stable overseas supply has become a strategic priority.

The DPS, which handles procurement and inventory for India’s nuclear industry, accepted Kazatomprom’s commercial offer within its validity period. That move now awaits shareholder approval in Kazakhstan.

uranium output india
Source: Atomic Minerals Directorate for Exploration and Research (AMD)

Uranium Supply in a Shifting Geopolitical Landscape

The uranium market remains highly concentrated in 2025, and this proposed deal reflects a broader shift in global nuclear geopolitics.

  • Looking ahead, Kazatomprom’s 2026 production guidance stands at 27,500–29,000 tonnes on a 100% basis, slightly below nominal capacity due to sulphuric acid supply constraints. Group sales are expected at 19,500–20,500 tonnes.

If the India contract absorbs a major portion of future output, the free market could feel the impact quickly, especially given the structural supply gap.

Reports say that by 2050, Kazakhstan and Canada are expected to dominate uranium exports. And in this market, uranium giants like Kazatomprom and Canada’s Cameco Corp. will dominate global revenue and production. Yet pricing trends have shown volatility. As demand for nuclear energy grows, countries are likely to form tighter supply alliances to secure fuel.

global uranium output

Balancing Strategy and Market Risk

At present, we can perceive that political tensions and energy security concerns are reshaping trade routes in oil and gas. And uranium may follow a similar path. Significantly, the IAEA has repeatedly noted that primary mining will remain the main source of uranium supply. Secondary sources, such as stockpiles and recycled materials, can only play a limited role.

Therefore, policymakers must rethink production and export strategies. Uranium-rich nations may reassess how much supply they allocate to long-term bilateral deals versus the open market.

For importing nations like India, long-term contracts provide stability. They reduce exposure to spot price volatility. They also strengthen diplomatic and economic ties. However, for the broader market, such agreements may reduce liquidity and amplify price swings during supply shocks.

Verra’s First DMRV Solar Project Pushes Carbon Credits into the Digital Era

Verra approved the first carbon credits under its new digital monitoring, reporting, and verification (DMRV) pilot. This move signals a major shift in how carbon credits are issued. Instead of waiting for annual verification cycles, projects can now receive high-frequency issuances, including monthly or bi-monthly approvals. As a result, the carbon market may become faster, more transparent, and more data-driven.

The first credits under this pilot came from the Foumbouni-Mitsamiouli solar farm project (Verra Project 3788) in the Union of Comoros.

Foumbouni-Mitsamiouli Solar Project Leads Verra’s Digital Carbon Shift

The project operates on Grande Comore Island, also known as Ngazidja. It was developed and is operated by Innovent Comores and Aera Group. The project follows the Clean Development Mechanism (CDM) methodology AMS I.D, which applies to grid-connected renewable electricity generation.

The solar initiative includes two photovoltaic parks, each with a capacity of 4 megawatt-peak (MWp). One is located in Foumbouni in the south of the island, while the other is in Mitsamiouli in the north. Together, the facilities use 10,080 solar modules rated at 405 Wp each. The panels are mounted on single-axis trackers with a backtracking system, which improves efficiency by adjusting panel angles throughout the day.

solar farm
Foumbouni-Mitsamiouli solar project: Aera

In addition, the project integrates 1 MW/2 MWh of battery storage. This storage system allows the solar plants to operate in hybrid mode and islanding mode. In simple terms, the plants can stabilize the grid and export clean power even when grid conditions fluctuate.

This development marked a turning point for the island’s energy system. Before the solar farms came online, the national utility SONELEC relied almost entirely on diesel-fired power plants. Electricity access remained below 60%, and supply was often unreliable. Diesel imports were costly and exposed the country to fuel price volatility.

Now, each plant generates around 12.7 gigawatt-hours (GWh) of electricity per year. On average, the bundled project reduces 9,384 tons of carbon dioxide equivalent annually. Beyond emissions cuts, the project strengthens national energy security and creates local employment opportunities.

Most importantly, it replaces fossil fuel-based electricity with renewable solar power. For a country that depended heavily on diesel generation, this shift is significant.

Fully Digital Verification Sets a New Standard for Carbon Credit Integrity

SustainCERT acted as the validation and verification body (VVB). It conducted a fully digital verification process. Project developers submitted monitoring data electronically, and the verification process took place entirely online. This marked the first successful digital verification under Verra’s DMRV pilot.

Verra Project Hub Powers a New Digital Era

Verra launched the DMRV pilot as part of a broader plan to digitize its entire project cycle. The organization aims to improve efficiency, reliability, speed, and transparency across the voluntary carbon market.

At the center of this transformation is the Verra Project Hub. This online platform serves as a comprehensive tool for creating and managing projects under Verra’s standards programs. It allows project proponents to submit validation, monitoring, and verification documents digitally. It also integrates directly with the Verra Registry, enabling faster issuance once approvals are granted.

The platform simplifies several steps in the project lifecycle. For example:

  • It enables the digital submission of monitoring data.
  • It automates calculations of emission reductions and removals using built-in engines aligned with approved methodologies.
  • It allows VVBs to access project records and submit verification reports directly.
  • It tracks milestones, deliverables, and reviews progress in real time.

As a result, stakeholders can collaborate more efficiently. Communication between project developers, VVBs, and Verra becomes smoother. At the same time, the system enhances transparency because documentation and data are centrally managed and traceable.

Verra is also digitalizing its most widely used methodologies. Templates collect all required project information in a structured format. A built-in calculation engine then computes emission reductions or removals for a given crediting period. This reduces human error and improves consistency across projects.

Verra digital carbon credits
Source: Verra

Digital Project Submission Tool for QC

In parallel, the Digital Project Submission Tool strengthens quality control. It checks data consistency and completeness using automated validation logic. If data is missing or incorrect, the system flags it immediately. Corrections can be made quickly, and all changes are logged for traceability. This improves auditability and builds trust among credit buyers.

Safeguards and Phased Credit Issuance

Under the DMRV pilot, Verra introduced a phased issuance structure to manage risks.

If a DMRV-based verification request for a high-frequency issuance installment is approved, the project proponent may request 80% of the approved credits. Verra withholds the remaining 20% as a safeguard during the pilot phase.

After one year of high-frequency issuances, the project must undergo a full traditional verification. This broader review covers additional elements such as safeguards, stakeholder engagement, and other non-digitized parameters. If Verra approves this non-DMRV-based verification request, the proponent can request issuance of the remaining 20%.

This structure balances innovation with risk management. It allows projects to benefit from faster cash flow while maintaining environmental integrity.

Verra is currently piloting this digital process for other project types as well. These include carbon capture and storage (CCS) activities and clean cookstove projects. If successful, the DMRV approach could expand across multiple sectors.

LATEST:

Carbon Market Supply and Demand Shift in 2025

While Verra pushes digital innovation, the broader carbon market also experienced notable changes in 2025.

As of December 31, 2025, more than 10,200 projects were registered across 18 major carbon credit registries tracked by MSCI. During the year, these projects issued 294 million tonnes of carbon dioxide equivalent (MtCO2e). Since the Paris Agreement was signed in late 2016, cumulative issuances have surpassed 2.6 billion credits.

Also, according to Sylvera, new issuances declined to roughly 270 million tonnes in 2025. This marked the lowest annual issuance level since 2020.

sylvera carbon credits issuances

On the supply side, renewable energy credits saw the sharpest drop. For years, market participants debated their additionality. Many buyers increasingly viewed grid-connected renewable projects as having limited incremental climate impact, especially in markets where renewables are already competitive. As confidence weakened, fewer new renewable credits entered the market.

Nature-based projects still dominate overall volumes. Forestry and land-use projects remain the largest sources of issued and retired credits. However, even within this segment, the mix is evolving. Buyers now focus more on quality, permanence, and robust monitoring systems.

On the demand side, retirements fell slightly in 2025. Yet this does not necessarily signal declining corporate interest. The number of buyers remained relatively stable. What changed was purchasing behavior.

msci carbon credit demand and supply

Companies became more selective. They scrutinized methodologies, co-benefits, and verification standards more closely. In many cases, they shifted toward higher-integrity credits, even if volumes were lower. At the same time, price sensitivity increased in some segments.

Therefore, the market is not shrinking. Instead, it is maturing. Buyers demand stronger transparency, clearer impact, and better data.

Digitalization Could Restore Confidence

In this context, Verra’s DMRV initiative arrives at a critical moment. As the voluntary carbon market faces scrutiny over quality and additionality, digital monitoring and automated calculations can improve credibility.

High-frequency issuance also benefits project developers. Faster approvals improve cash flow and reduce administrative delays. Meanwhile, automated systems reduce manual paperwork and the risk of calculation errors.

For buyers, digital verification enhances confidence. Real-time data submission and traceable logs create a clearer audit trail. Over time, this may help rebuild trust in segments where credibility has weakened.

Ultimately, the Foumbouni-Mitsamiouli solar project represents more than just a renewable energy investment. It marks the beginning of a new digital chapter for carbon markets. If Verra successfully scales DMRV across sectors, the VCM could become more transparent, efficient, and resilient in the years ahead.

Google Taps Earth’s Heat in 150MW Geothermal Deal with Ormat Technologies to Power Data Centers

Google has signed a long-term agreement with renewable energy company Ormat Technologies to bring new geothermal power to its data centers in Nevada, U.S.A. The deal could deliver up to 150 megawatts (MW) of electricity from geothermal sources under a special tariff program.

Ormat will develop a portfolio of geothermal projects across Nevada. These projects are set to come online between 2028 and 2030. Once operational, the electricity will support Google’s growing digital infrastructure.

The guide for this arrangement is NV Energy’s Clean Transition Tariff (CTT), a utility program designed to let large energy users buy new clean power while covering costs without shifting them to other customers.

The contract will begin when the first project starts commercial operation. It will run for 15 years beyond the final project’s completion, creating a long-term revenue stream for Ormat and a stable source of clean energy for Google.

Why Geothermal Delivers 24/7 Clean Baseload Power

Geothermal energy uses heat from deep underground to generate electricity. It can run 24 hours a day, unlike solar or wind, which depend on sunlight or wind. This makes it a baseload power source — always available. That feature is critical for data centers, which require constant electricity.

Ormat is one of the world’s longest-standing geothermal power companies. It designs, builds, and runs plants that convert heat into electricity. Its global portfolio includes nearly 1,700 MW of capacity, with about 1,310 MW in geothermal and solar generation and 385 MW in energy storage.

Here’s how Ormat’s geothermal process works:

In recent years, the tech industry has shown rising interest in geothermal energy. Some operators, including Google, have already signed smaller geothermal power deals in other regions. For example, Google previously secured a 10 MW geothermal PPA in Taiwan and a separate arrangement to procure 115 MW of geothermal power from Fervo Energy in Nevada.

AI’s Energy Appetite and the Need for Clean Power

Data centers consume large amounts of electricity. They house computers that run search engines, Artificial Intelligence (AI), cloud services, and other digital tools. As digital activities grow, so does demand for power.

AI and advanced computing drive particularly strong electricity use. Without reliable clean energy sources like geothermal, data centers often depend on fossil fuels or intermittent renewables that don’t run continuously.

AI data center energy GW 2030

By partnering with Ormat, Google ensures a reliable, carbon-free power supply to meet its needs and reduce its environmental footprint. The new geothermal portfolio is expected to scale with future energy demand from AI and cloud computing workloads.

The Clean Transition Tariff (CTT) model used in this deal is designed so that Google pays full costs for its electricity. This limits cost impacts for other utility customers while enabling investment in new clean generation.

The Ormat–Google Deal: A 150MW Bet on Long-Term Clean Power

The Ormat–Google agreement covers up to 150 MW of geothermal capacity. To put that in context:

  • 150 MW can power tens of thousands of homes if it were used for residential consumption.
  • For data centers, it represents a meaningful share of electricity demand, especially as AI services expand.
The projects will ramp up over time. The first facilities are expected to start operating by 2028, with additional capacity coming online through 2030. This flexible build-out allows Ormat to expand the portfolio site by site.

The long-term nature of the contract, with a 15-year term after the final project completes, gives both Ormat and Google forecasting clarity. It assures stable revenue for Ormat and long-duration clean power for Google.

From Climate Pledges to Policy-Backed Power Deals

Google has long pledged to reduce its carbon footprint. It aims to operate on carbon-free energy 24/7 by 2030 across all its data centers and offices. This new geothermal deal aligns with that goal by adding dispatchable clean energy to its power mix.

Google carbon-free energy goal 2030
Source: Google

Geothermal energy can play a key role in meeting this aim because it provides baseload power that complements other renewables like wind and solar. Together, these sources help tech firms reach net-zero goals more reliably.

On the policy side, the extension of federal geothermal tax credits under U.S. law strengthens the economics of geothermal development. Programs such as the Oil and Gas Geothermal Tax Credit (OGBTC) and incentives in the Inflation Reduction Act (IRA) have expanded support for geothermal and other clean technologies.

The Clean Transition Tariff is another policy signal. It creates a scalable structure that utilities in other U.S. markets might adopt. This could help large users, not just Google, secure new clean generation that aligns with climate and reliability goals.

Tech Giants Turn to Deep Earth Energy

The Ormat–Google deal fits a broader industry trend. As demand for reliable, low-carbon power grows, more tech and cloud companies seek direct ties to physical clean energy projects.

Tech giants signed 14 geothermal PPAs totaling 635 MW in 2025 alone, up 3x from 2024. Data centers now drive 60% of new geothermal capacity, targeting 120 GW by 2050, per DOE’s forecast.

geothermal energy infographics

One example is Switch, a major data center operator that signed a 20-year Power Purchase Agreement (PPA) with Ormat to supply about 13 MW of geothermal power from the Salt Wells plant in Nevada. That agreement begins energy deliveries around 2030, contingent on upgrades to the facility.

Switch’s PPA also includes an option to add roughly 7 MW of solar PV to support the geothermal site’s auxiliary needs. This hybrid approach supports stability and broader sustainability objectives.

Other tech giants are exploring geothermal and other firm clean energy sources, recognizing that intermittent renewables alone cannot supply constant power for large computing loads. Key deals are:

  • Google-Fervo: 115 MW enhanced geothermal (Nevada, online 2026) via NV Energy CTT—Ormat deal doubles Google’s NV commitment.
  • Microsoft-ENEL: 120 MW Hellisheidi (Iceland, operational 2026)—world’s largest geothermal data center link.
  • Google-Taiwan: 10 MW PPA (operational).

These moves underline a broader shift toward long-term, grid-connected clean power strategies. Grid-tied PPAs signal seismic shift: tech won’t wait for battery breakthroughs.

For Google, geothermal unlocks 24/7 carbon-free baseload when it needs it online: 2028, matching the NV data center expansion phase.

A Blueprint for Future Clean Power Partnerships

The Ormat–Google geothermal deal could serve as a model for future clean power partnerships. If the Nevada Public Utilities Commission approves the agreement in late 2026, the structure may be replicated in other states.

Developers may use similar portfolio PPAs to build geothermal and other clean energy projects. Utilities and policymakers may also adopt clean transition tariffs or flexible frameworks that allow large users to co-finance new clean generation.

For Google, securing scalable clean power helps future-proof data centers against rising energy demand from AI and cloud services. For Ormat, the deal provides long-term revenue and validates its strategy to expand geothermal capacity.

Geothermal energy, once a niche clean source, is gaining traction as a firm, reliable part of the renewable mix. And as digital infrastructure grows, deals like this one show how deep underground heat can power the next wave of cloud and AI computing sustainably.

Rio Tinto’s FY25 Profit Falls 14%, but Copper Projects and Sustainability Efforts Stand Out

Rio Tinto delivered a mixed but resilient performance in the full-year 2025. While weaker iron ore prices weighed on profits, strong copper growth and disciplined cost control helped the mining giant keep earnings stable and maintain its dividend.

The world’s largest iron ore producer reported underlying earnings of $10.87 billion for the year ended December 31, unchanged from 2024. However, net profit fell 14% to $9.97 billion, compared to $11.55 billion a year earlier.

Despite the profit decline, Rio Tinto kept its shareholder payout steady. It declared an ordinary dividend of $6.5 billion, maintaining a 60% payout ratio. This marked the tenth straight year the company paid at the top end of its target range.

rio tinto earnings
Source: Rio Tinto

Iron Ore Softens, Copper and Aluminium Step Up

Lower iron ore prices hurt earnings. As the backbone of Rio Tinto’s business, iron ore remains critical. However, copper and aluminium delivered strong support.

Copper production rose 11% year over year. The key driver was the ramp-up of the Oyu Tolgoi underground project in Mongolia, where output surged 61%. This project is now complete and will play a major role in future copper growth.

Aluminium also performed well across the value chain. The company achieved record annual bauxite production of 62.4 million tonnes. As a result of higher volumes and better productivity, Rio Tinto reduced operating unit costs by 5% in real terms during 2025.

rio tinto copper
Source: Rio Tinto

Operational cash flow strengthened. Net cash from operating activities rose 8% to $16.8 billion. Meanwhile, underlying EBITDA climbed 9% to $25.4 billion. These gains reflected operational discipline and tighter cost management.

Looking ahead, the company aims to deliver a 4% compound annual unit cost improvement through 2030. It also expects productivity initiatives to generate $650 million in annual benefits by early 2026.

Big Projects Drive Future Growth

Rio Tinto made significant progress across its global project pipeline in 2025. The major milestones are explained below:

Simandou Iron Ore Project

The Simandou project in Guinea reached a major milestone. The company shipped its first high-grade iron ore in December. This project is expected to strengthen long-term supply and improve product quality.

Pilbara Replacement Mines

In Western Australia’s Pilbara region, the Western Range replacement mine opened on time and on budget. Additionally, construction began at three more brownfield iron ore mines. Four of the five major replacement projects are now either ramping up or under construction.

Copper Expansion

The Oyu Tolgoi underground development is complete. Rio Tinto also achieved first production of Nuton copper at the Johnson Camp mine. The company remains on track to deliver 3% compound annual growth in copper-equivalent production through 2030.

Lithium Growth

In March, Rio Tinto closed its acquisition of Arcadium ahead of schedule. The focus now shifts to advancing lithium projects in Argentina and Canada. The company targets 200,000 tonnes per year of lithium carbonate equivalent capacity by 2028.

Together, these projects strengthen Rio Tinto’s position in future-facing commodities like copper and lithium, which are essential for electrification and the energy transition.

Strong Balance Sheet and Capital Discipline

Despite profits falling, Rio Tinto’s financial position remains solid. Its strong cash flow supports consistent dividends and future investment. The company plans to unlock between $5 billion and $10 billion from its asset base. It is currently reviewing options for its borates and titanium dioxide (TiO₂) businesses and considering infrastructure monetization.

Management also streamlined operations. It reduced its structure from four product groups to three core divisions, i.e., iron ore, aluminium & lithium, and copper

Additionally, the company reduced contractor numbers and discretionary spending. It also placed the Jadar project into care and maintenance and stopped non-core studies. These steps sharpened its focus on value-generating assets.

Climate Action: Progress with Challenges

Sustainability remains an important part of Rio Tinto’s long-term strategy. The company spent $612 million on decarbonization initiatives in 2025, up from $589 million in 2024

In 2025:

  • Gross Scope 1 and 2 emissions were 31.5 million tonnes of CO₂ equivalent, down 14% from the 2018 baseline of 36.7 million tonnes.
  • Scope 3 emissions, which include customer use of products, reached 575.7 million tonnes of CO₂ equivalent. These emissions represent the largest share of its climate footprint. After applying high-quality carbon offsets, net emissions were 17% below baseline.
rio tinto emissions
Source: Rio Tinto

However, progress slowed compared to prior years. Emissions fell by just 0.2 million tonnes from 2024 levels. Increased production in iron ore and copper partly offset reductions.

Renewable Energy Contracts and Carbon Credits

The mining giant relies on renewable energy contracts and renewable diesel use, especially at its Kennecott site. It also retired about 1.01 million Australian Carbon Credit Units (ACCUs) to meet regulatory requirements.

Still, the path to its 2030 target of a 50% reduction in Scope 1 and 2 emissions depends on third-party renewable projects and successful commercial agreements. These factors remain outside the company’s direct control.

Around 7% of its electricity came from renewable sources, slightly lower than 78% in 2024 due to accounting adjustments in reported figures.

renewable energy
Source: Rio Tinto

Environmental and Water Management

Air quality indicators such as NOx, SOx, and fluoride levels remained relatively stable over five years. However, PM10 levels increased slightly over the past three years. To reduce emissions at the source, Rio Tinto continues to upgrade equipment with best-available technologies. It also expands air monitoring networks around its operations.

Water management improved in 2025. Total operational water withdrawals declined to 1,147 gigalitres, down from 1,250 gigalitres in 2024. Freshwater withdrawals also fell slightly to 386 gigalitres.

Water recycling increased to 374 gigalitres, showing better reuse practices. Meanwhile, total water discharges dropped to 626 gigalitres.

The company advanced several community-focused water initiatives, including implementing a new water strategy at QIT Madagascar Minerals. It also increased transparency by publishing detailed water performance data.

The Bigger Picture

Overall, Rio Tinto delivered steady underlying earnings in a challenging pricing environment. Iron ore weakness pressured profits, yet copper and aluminium provided strong support.

At the same time, disciplined capital allocation, operational efficiency, and large-scale project execution strengthened its long-term outlook.

Looking forward, growth will rely heavily on copper and lithium. These metals sit at the heart of global electrification and decarbonization trends. If Rio Tinto delivers on its cost improvements and project milestones, margins and cash flow could improve further.

However, climate targets remain ambitious. Achieving deeper emissions cuts will require faster renewable energy deployment and broader collaboration across its value chain.

In short, 2025 showed resilience rather than rapid growth. Rio Tinto balanced shareholder returns, project expansion, and sustainability progress. Now, its future depends on executing its copper-led strategy while navigating commodity cycles and climate commitments.

Booking Holdings Posts $26.9B Revenue While Advancing 2040 Net-Zero Goals

Booking Holdings closed 2025 with solid financial growth, supported by strong global travel demand. The global travel platform reported solid increases in revenue, bookings, and cash flow during the year.
At the same time, it made further progress toward its net-zero target by 2040. Operational emissions remain sharply lower than pre-pandemic levels, supported by renewable electricity and efficiency gains. As travel demand expands, the company is working to balance business growth with long-term emissions reduction commitments across its value chain.

Strong Travel Demand Lifts 2025 Financial Results

Booking Holdings reported $26.9 billion in revenue for full-year 2025, up 13% year over year. Gross bookings reached $186.1 billion, a 12% increase compared with 2024. Room nights booked totaled 1.235 billion, rising 8% year over year.

Profitability remained strong. Adjusted EBITDA reached $9.9 billion, up 20%, while the adjusted EBITDA margin improved to 36.9%, compared with 35.0% in 2024. Free cash flow increased 15% to $9.1 billion.

However, net income declined to $5.4 billion, down 8% year over year, reflecting higher expenses and investment costs. Net income margin stood at 20.1%, compared with 24.8% in 2024.

Booking Holdings 2025 financial results
Source: Booking Holdings

In the fourth quarter alone, Booking generated $6.3 billion in revenue, up 16% year over year. Gross bookings for the quarter reached $43.0 billion, also up 16%. Room nights rose 9% to 285 million.

The results show continued strength in leisure travel and alternative accommodations across major markets.

Diversified Business Drives Growth

Booking Holdings operates several major travel platforms, including Booking.com, Priceline, Agoda, KAYAK, and OpenTable. Its growth in 2025 came from multiple segments. Alternative accommodation options grew. Also, flight bookings and attraction services became more popular.

The company’s global footprint across more than 200 countries provides geographic diversification. This helps reduce exposure to single-market disruptions.

Booking continues to invest in technology and artificial intelligence to improve the user experience. The company is integrating AI tools to personalize travel planning and enhance partner services.

At the same time, cost discipline helped lift margins. The company balanced investments with efficiency measures, supporting its improved adjusted EBITDA margin.

Science-Based Targets Shape the 2040 Roadmap

Alongside financial growth, Booking Holdings continues to advance its climate goals. The company has committed to reaching net-zero greenhouse gas emissions by 2040. Its climate targets have been validated by the Science Based Targets initiative (SBTi).

Booking aims to reduce Scope 1 and Scope 2 emissions by 95% by 2030, compared with a 2019 baseline. These emissions come mainly from office energy use and direct operations.

Booking Holdings carbon emissions
Source: Booking Sustainability Report

The company has already made major progress. Operational emissions (Scope 1 and 2) have declined by approximately 85% compared with 2019 levels. This reduction mainly came from using 100% renewable electricity for office operations. It has also improved energy efficiency.

Scope 1 and 2 emissions represent only about 1% of Booking’s total emissions footprint.

The 99% Challenge: Decarbonizing the Value Chain

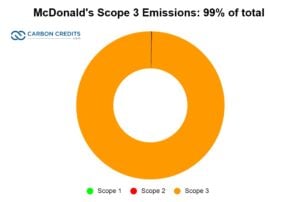
The vast majority of Booking Holdings’ emissions fall under Scope 3, which includes indirect emissions from its value chain. Scope 3 emissions account for roughly 99% of the company’s total greenhouse gas emissions.

Booking Holdings Scope 3 emissions
Source: Booking Sustainability Report

These emissions come from areas such as:

  • Purchased goods and services
  • Business travel
  • Employee commuting
  • Capital goods

Reducing Scope 3 emissions is more complex because they depend on third parties. However, Booking has committed to cutting Scope 3 emissions by 50% by 2030 and 90% by 2040, compared with 2019 levels.

The company continues to refine its emissions accounting methods to improve data quality and reporting accuracy. Better data helps identify the largest sources of emissions and target reduction strategies.

Scope 3 reductions will depend on collaboration with partners, suppliers, and travel service providers.

Expanding Sustainable Travel Options

Booking Holdings has also focused on helping travelers make more sustainable choices. Through its platforms, the company highlights accommodations with recognized sustainability certifications. This allows customers to see properties with verified environmental practices.

The company works with partners to improve sustainability standards and reporting transparency. It also collaborates with external organizations to align with global frameworks.

In previous years, Booking set a target for a large share of bookings to come from properties with sustainability certifications. The company keeps adding sustainability to product design and customer info, even as targets change.

These initiatives aim to support lower-carbon travel behavior while maintaining business growth.

Travel and tourism contribute significantly to climate change. Latest estimates show the global travel and tourism sector made up about 7.3% of total greenhouse gas emissions in 2024, down from 8.3% in 2019.

Large travel platforms such as Expedia Group and Airbnb are also working to cut their carbon footprints. Expedia has set targets to reduce operational emissions and disclose climate impacts in line with standards like the Task Force on Climate-related Financial Disclosures (TCFD). Airbnb aims to measure and lower greenhouse gas emissions linked to stays and listings.

The figures show that while the industry is working to cut emissions, travel still represents a substantial share of global greenhouse gases and remains a focus for climate action.

Managing Climate Risks

Booking recognizes that climate change presents operational and financial risks. Extreme weather events, rising temperatures, and water scarcity can affect travel demand and infrastructure. Destinations vulnerable to climate impacts may face disruptions.

The company evaluates physical and transitional climate risks in its long-term planning. It looks at how policy changes, carbon pricing, and sustainability rules might impact operations and partners.

Booking wants to boost resilience by adding climate risk assessments to its strategy. This will help meet global sustainability expectations.

Profit Expansion Meets Emissions Reduction

Booking Holdings’ 2025 results show that strong travel demand can coexist with advancing climate commitments.

Revenue growth of 13% and adjusted EBITDA growth of 20% demonstrate financial strength. At the same time, the company has significantly reduced operational emissions and set bold long-term reduction goals.

Operational emissions are already down sharply. The next phase will focus on value chain decarbonization. This area represents the largest share of its footprint.

Reaching net-zero by 2040 will require continued collaboration with travel suppliers, property owners, airlines, and technology providers.

As global travel rebounds and expands, emissions management will remain a key challenge for the sector.

Can Travel Growth Align With Net-Zero Goals?

Heading into 2026, Booking Holdings appears financially stable and operationally strong, as stated in its guidance. Solid cash flow and margin expansion provide resources for investment and innovation.

Sustainability will likely remain central to the company’s long-term strategy. Meeting Scope 3 targets and maintaining renewable electricity sourcing will be critical milestones.

The company’s performance in 2025 shows that growth and climate strategy are increasingly linked. Investors and customers alike are paying closer attention to both financial returns and environmental responsibility.

If Booking continues to align revenue expansion with emissions reduction, it could strengthen its position as both a leading travel platform and a climate-conscious global company.

Silver in 2026 and Beyond: Rising Prices, Solar Substitution, and a Market Still in Deficit

Silver entered 2026 with strong momentum. Prices surged over the past year. Industrial users adjusted to rising costs. Investors returned to the market. At the same time, solar manufacturers began cutting silver use to save money.

Even with a higher supply, the global market stayed in deficit for the sixth straight year. In short, silver’s story in 2026 is one of tight supply, shifting demand, and rising importance.

Silver Prices Rise as Investors Return

Silver prices recently stayed above $78 per ounce, helped by geopolitical tensions and light trading in Asia. After a volatile stretch, the metal was on track for its first weekly gain in four weeks.

silver prices

J.P. Morgan projects silver could average $81 per ounce in 2026, more than double its 2025 average. Yet the forecast depends on global demand and economic conditions. In 2025, silver jumped by over 130%. Industrial demand and tariff uncertainty fueled the rally. Later, U.S. Federal Reserve rate cuts boosted investor interest.

silver prices
Source: J.P. Morgan Commodities Research, $/oz, quarterly and annual averages.

However, high prices bring challenges. Investors benefit, but industrial users face rising costs. Prolonged price pressure could reduce demand and cause more volatility.

Solar Manufacturers Cut Usage as Costs Climb

One of the most significant shifts in 2026 comes from the solar sector. According to BloombergNEF, solar manufacturers—the largest industrial consumers of silver—are accelerating efforts to reduce silver intensity in photovoltaic (PV) modules.

Silver demand from PV installations is expected to fall to roughly 194 million ounces, or about 6,028 metric tons, this year, marking a 7% year-on-year decline. This drop comes even as global solar capacity continues to expand by around 15%.

Simply put, as manufacturers are using less silver per cell, total silver demand from the sector is projected to decline.

Rising costs explain the shift. Silver now accounts for an estimated 17–29% of PV module costs per watt, up sharply from just 3% in 2023. As prices climbed toward and even above $80 per ounce, manufacturers intensified substitution efforts.

silver demand

Chinese Solar Makers Lead the Silver Substitution Push

Chinese producers are leading the transition. Longi Green Energy Technology Co. announced plans to replace silver with base metals such as copper in its back-contact cells, with mass production expected in the second quarter of 2026. Similarly, Jinko Solar Co. signaled large-scale copper-based panel production, while Shanghai Aiko Solar Energy Co. has already launched silver-free solar cells.

However, substitution remains technically challenging. Copper can increase assembly costs and raise reliability concerns. Moreover, certain technologies, such as TOPCon cells, are less compatible with alternative metals due to high-temperature fabrication processes. As a result, silver continues to play a central role in high-efficiency solar designs, even as overall usage declines.

So, What’s Fueling Silver Demand in 2026?

Industrial Segments

Although solar demand softens, other industrial segments continue to support silver consumption. The Silver Institute highlighted strong structural growth in data centers, artificial intelligence infrastructure, and the automotive sector. This is because it conducts electricity better than almost any other metal. As electrification and digital growth continue, these sectors help support steady industrial demand.

silver demand

Investment Demand

On the other hand, investment demand is rising. Global physical investment is forecast to increase about 20% to 227 million ounces, reaching a three-year high. Western investors are returning after several weak years, supported by strong prices and economic uncertainty. At the same time, investment demand in India remains strong, helped by positive sentiment and recent gains.

Supply Growth Fails to Close the Gap

On the supply side, total global output is projected to increase 1.5% in 2026, reaching a decade high of 1.05 billion ounces. Mine production is expected to rise modestly to around 820 million ounces, supported by stronger output from existing operations and recently commissioned projects.

  • Growth is anticipated in Mexico’s primary silver mines and at China Gold International’s Jiama polymetallic mine.
  • In Canada, new and expanding projects such as Hecla’s Keno Hill and New Gold’s New Afton are contributing additional supply.
  • By-product silver from gold mines is also expected to increase, with gains from operations including Barrick’s Pueblo Viejo in the Dominican Republic and Gold Fields’ Salares Norte in Chile.

Recycling is expected to climb 7%, surpassing 200 million ounces for the first time since 2012. High prices encourage consumers to sell scrap, especially silverware.

Even so, the market remains undersupplied. The Silver Institute forecasts a 67 million-ounce deficit in 2026. As a result, the market relies on stored silver reserves, adding pressure to an already tight supply.
BHP and Wheaton Strike a Record Silver Deal

Corporate activity reflects silver’s strength. BHP entered a long-term streaming agreement with Wheaton Precious Metals Corp. BHP received $4.3 billion upfront in exchange for silver linked to its share of production at the Antamina mine in Peru.

This deal, the largest streaming transaction by upfront payment, lets BHP monetize silver as a by-product while keeping full exposure to copper, zinc, and lead. It doesn’t affect BHP’s joint venture rights or customer contracts.

Strategically, the deal shows how miners turn non-core metals into cash to strengthen balance sheets and fund growth projects.

2030 Outlook: Silver Demand and Supply

A research paper published recently looked at how much silver the solar industry may require by 2030. It also considered demand from other industries that use silver, such as electronics and automotive.

The findings raise concerns.

  • By 2030, total silver demand could reach 48,000 to 54,000 tons per year. However, supply may only cover 62% to 70% of that need. In other words, the world could face a serious silver shortage.

Solar is expected to be the fastest-growing source of demand. The industry alone may require 10,000 to 14,000 tons per year, which could account for 29% to 41% of total supply. At the same time, other industries will continue to use large amounts of silver. Even with slower growth, demand from these sectors could still reach 38,000 to 40,000 tons per year by 2030.

silver demand supply forecast
Source: Science Direct

In conclusion, the silver market continues to run in deficit. As long as supply lags total demand, prices may stay high. At the same time, higher prices could speed up substitution and increase volatility.

BYD Banks 6.2M Carbon Credits Potentially Worth US$217M Under Australia’s EV Efficiency Scheme

Chinese electric vehicle maker BYD has accumulated around 6.2 million carbon credits under Australia’s New Vehicle Efficiency Standard (NVES) scheme. This comes from its strong performance in low-emission vehicle production and sales in the country.

The credits reward manufacturers that make and import vehicles with low greenhouse gas emissions. BYD’s haul reflects the company’s large supply of electric vehicles (EVs) that meet or exceed strict emissions benchmarks.

These credits can be sold to other manufacturers that fall short of efficiency targets. They help other car makers comply with regulatory requirements, which can be costly to miss.

BYD’s strong carbon credit position highlights its quick growth in EV markets. This shows the importance of leading in clean vehicles, especially with carbon pricing and regulations.

How Australia’s NVES Turns Emissions Into Tradable Credits

Australia’s New Vehicle Efficiency Standard aims to cut vehicle emissions over time. It sets yearly targets for average CO₂ emissions of new light vehicle fleets sold in the country.

Australia NVES targets
Source: NVES website

Manufacturers that sell more low-emission vehicles than required earn credits. Those that sell fewer low-emission vehicles can buy credits to balance their performance.

BYD benefited because its vehicles, especially EVs, have very low tailpipe emissions. Each EV imported or sold that performs better than the standard adds credits to BYD’s account. On the other hand, makers of heavier or higher-emission vehicles might face penalties. They may also need to buy carbon credits to comply.

carbon credit earners under Australia NVES scheme
Chart from Financial Review

This system creates a market for credits linked to carbon intensity. It rewards companies that adopt clean tech quickly and penalises those that lag. The 6.2 million-credit total shows BYD’s scale in clean vehicle supply under this compliance scheme.

Why BYD Leads in Carbon Credit Generation

BYD’s strong position in carbon credits reflects its dominance in EV production and global sales trends. Per the NVES data, the Chinese EV maker tops the list of companies earning carbon credits under the scheme.

BYD is now the biggest EV maker globally, beating Tesla in 2025. It has been selling millions of electric cars each year since 2023. The company is also growing in markets like Europe, Latin America, Southeast Asia, and Australia.

BYD vs TESLA ev sales 2025

This scale makes BYD well-placed to earn credits when regulations reward low-emission vehicles. Other carmakers that depend on internal combustion engine (ICE) vehicles might find it hard to earn similar credits for efficiency or emissions programs.

In some regions — including Europe — BYD is even in talks to supply surplus carbon credits to traditional automakers. The aim is to help those automakers avoid fines under strict EU emissions rules by 2025.

These talks could expand BYD’s reach in carbon credit markets. They might go beyond Australia and into global regulatory frameworks.

From Regulation to Revenue: Carbon Credits as Strategic Assets

Carbon credits have become more important in the auto industry as regulators tighten emissions limits.

Under schemes like Australia’s NVES and the European Union’s emissions regulations, credits act as compliance instruments. They can reduce the cost of meeting regulatory targets for manufacturers.

For example, European automakers can form carbon credit pools. Carbon credit pooling, where companies share or trade surplus credits, is emerging as a compliance method. These pools allow companies that fall short of targets to buy credits from low-emission peers such as BYD or Tesla.

Tesla has also earned significant revenue from selling regulatory or carbon credits to other automakers. In 2025, the company generated almost $2 billion in total carbon credits from these sales, even as volumes shifted during the year. They are an important, though changing, revenue source for Tesla.

Tesla carbon credit revenue 2025

The pooling helps firms avoid large fines for missing emissions caps. In 2025, EU penalties for vehicles that exceed CO₂ limits could run into billions of dollars if automakers do not comply.

Under Australia’s NVES, credits are generated when a manufacturer’s fleet emissions fall below annual targets. While there is no fixed public trading price yet, industry modelling links the credit value closely to the penalty rate of A$100 per g CO₂/km per vehicle, per the NVES Act 2024.

Analysts estimate real trading values may range around A$50–A$60 per unit, or roughly US$32–US$38 at current exchange rates. Using a mid-range estimate of US$35 per credit, BYD’s 6.2 million credits could represent around US$217 million in potential compliance value.

BYD_NVES_credit_value_table
Sources: NVES Act 2024, AADA estimates

For BYD, credit generation becomes an asset as well as a compliance indicator. It can potentially sell surplus credits to others and strengthen relationships across global auto markets.

This shift reflects a broader trend. More countries are now tying vehicle emissions to tradable credits. This helps boost EV adoption and cut transport emissions.

Policy Pressure Accelerates the EV Shift

Transport is a major source of global greenhouse gas emissions. Light-duty vehicles alone account for a large share of road transport emissions worldwide. Thus, many governments are tightening emissions standards. These include late-decade targets for EV sales and fleet emissions averages.

The European Union wants carmakers to cut average CO₂ emissions a lot by 2025. They aim for zero-emission sales by 2035.

EU emissions standard for vehicles
Source: ICCT

In Asia, BYD is also pushing EV adoption hard, often outpacing legacy brands in unit sales. Its production volume helps it to be a major source of low-emission vehicles.

Australia’s NVES scheme reflects similar intentions. It seeks to shift the vehicle fleet toward cleaner technology by rewarding low emissions and penalizing high emissions. The 6.2 million credits that BYD amassed show the scale of emissions improvement achievable when a market leader focuses on EV supply.

Legacy Automakers Face a Compliance Squeeze

Traditional or legacy automakers face increasing pressure from efficiency and emissions regulations. Automakers that still sell many ICE vehicles often fall short of targets. This forces them to purchase carbon credits or pay penalties.

Both options can incur high costs. For example, if automakers don’t meet the 2025 emissions targets set by the EU, they could face fines up to $15.6 billion.

BYD’s possible participation in carbon credit pools could be significant for global emissions markets. These structures help companies with low EV production get credits from top EV sellers. The business and compliance value of credits thus goes beyond one scheme or country.

Beyond Sales: BYD’s Long-Term Climate Commitments

BYD’s strong carbon credit position supports its broader sustainability strategy. The company aims to reduce its carbon footprint and align with global climate goals.

The EV maker has committed to achieving carbon neutrality across its value chain by 2045, guided by China’s national dual-carbon goals. It also aims to cut the carbon intensity of its own operations by 50% by 2030 compared with a 2023 base year.

BYD GHG emission intensity
Source: BYD

BYD’s sustainability work spans beyond EV sales. It invests in battery technology, solar power solutions, and recycling efforts that support circular energy systems.

Each EV model is designed to support long life and high safety. These models, including those using BYD’s proprietary Blade Battery technology, also enable recycling and reuse.

These efforts reinforce BYD’s positioning not just as an EV maker but as a broader participant in low-carbon technology markets.

A Glimpse of the Auto Industry’s Carbon-Driven Future

BYD’s 6.2 million carbon credits show how regulatory incentives can amplify low-emission technology adoption. They provide a compliance advantage for BYD and a potential revenue stream if credits are sold or pooled.

Credit generation also signals strong EV market performance tied to emissions rules. BYD shows that as carbon pricing and efficiency standards grow, top EV makers can gain both environmentally and financially.

For traditional carmakers, the rise of tradable carbon credits tied to vehicle efficiency will likely remain a key part of emissions compliance strategies.

As global climate policies tighten, carbon credits may increasingly bridge technology gaps and help accelerate the transition to zero-emission mobility.

Middle East Sustainable Bonds Set to Hit $25B in 2026 as Sukuk Surge

Sustainable bond issuance in the Middle East is expected to remain strong in 2026. S&P Global Ratings projects regional issuance will reach between $20 billion and $25 billion next year. This outlook comes after a year marked by trade volatility and global uncertainty. Despite those pressures, investor appetite in the region remained resilient.

In 2025, conventional bond issuance by corporates and financial institutions in the Middle East grew by 10%–15%, reaching $81.2 billion. At the same time, sustainable bond issuance in the region increased by about 3%.

This contrasts sharply with global trends. Worldwide sustainable bond issuance declined by 21% in 2025. The Middle East, therefore, outperformed the broader global market.

Growth in 2025 was largely supported by the Gulf Cooperation Council (GCC) countries. Saudi Arabia and the United Arab Emirates (UAE) were especially important. Their strong activity offset a slowdown in Turkiye.

Middle east sustainable bond issuances 2025.S&P

Issuance Concentrated in Three Countries

Sustainable bond activity in the Middle East remains highly concentrated. Turkiye, Saudi Arabia, and the UAE captured more than 90% of the sustainable bond market in the region.

The bond market itself is mainly driven by Saudi Arabia and the UAE. Together, they accounted for a combined 80% of sustainable bond issuance by value in 2025.

Middle east bond issuances by country

Turkiye plays a different role. Sustainable loans dominate the market in that country rather than bonds. In fact, sustainable loan issuance in Turkiye represented about 60%–65% of the regional market by value, and 70%–75% by volume.

In 2025, labeled bond issuance slowed sharply in Turkiye. Banks reduced their activity in the bond market. However, renewable energy projects increased in both bond and loan markets. Wind and solar capacity growth could support issuance again in 2026.

In Saudi Arabia and the UAE, issuance remained resilient across markets. Volume stayed strong even during periods of volatility.

Sustainable Sukuk Breaks Records

One of the most notable trends is the rapid growth of sustainable sukuk. Sustainable sukuk are designed to fund projects that have environmental or social benefits, while complying with Shariah principles.

what is sukuk

Total sustainable sukuk issuance in the Middle East reached a new record of $11.4 billion in 2025, compared with $7.9 billion in 2024. This type of financing now accounts for more than 45% of regional sustainable bond issuance by value and more than 40% by number of issuances in 2025.

This represents a major increase from the end of 2024, when sustainable sukuk made up 33% of value and 24% by number. Saudi Arabia and the UAE continue to lead sukuk issuance.

Guidance published by the International Capital Market Association (ICMA) in April 2024 on green, social, and sustainability sukuk has helped improve transparency. Regulatory and government initiatives may further support growth in 2026.

Sukuk structures are particularly important in the GCC, where Islamic finance plays a central role in capital markets.

Renewable Energy Drives Issuance

Middle east issuances by sector

Renewable energy remains the main use of proceeds in the region’s sustainable bond market. Solar energy is especially popular in GCC countries because of high solar irradiance. Large-scale renewable projects require significant capital. And green bonds and sukuk help finance these investments.

Energy companies such as Masdar in the UAE are expected to continue issuing green bonds to expand renewable portfolios.

Saudi Arabia is preparing to commission the world’s largest utility-scale green hydrogen project in Neom in 2026. The project will use solar, wind, and energy storage systems. It forms part of Saudi Vision initiatives aimed at diversifying the economy and reducing reliance on hydrocarbons.

Other common project categories include:

  • Energy efficiency
  • Green buildings
  • Sustainable water management
  • Clean transportation

top sectors for middle east sustainable bond issuances

Climate adaptation projects are still limited but growing. In Saudi Arabia, the sovereign has included climate adaptation in its green bond framework. Banks in the UAE and Saudi Arabia have also started financing adaptation projects.

New Bond Types Emerging

The Middle East sustainable finance market is evolving beyond traditional green bonds.

Transition finance is expected to grow in 2026. This is particularly relevant for hydrocarbon-linked economies. Issuers with credible transition strategies may use transition bonds or transition loans. These can finance emissions reductions and methane abatement projects.

Guidelines for sustainability-linked loan financing bonds (SLLBs) were introduced in June 2024. These instruments allow issuers to finance portfolios of sustainability-linked loans aligned with international principles.

In 2025, Emirates Islamic issued the first SLLB sukuk in the region. This may encourage more banks to follow.

Blue bonds are also gaining attention. The UAE has positioned itself as a leader in this segment, in line with its UAE Water Agenda 2036.

In August 2025, First Abu Dhabi Bank issued the region’s first blue bond by a financial institution. In January 2026, Emirates NBD raised $1 billion through a dual-tranche issuance, including $300 million in blue bonds and $700 million in green bonds.

Eligible blue projects include:

  • Offshore wind
  • Wetland and coral reef conservation
  • Flood and drought-resilient infrastructure
  • Sustainable water and wastewater management

Digital bonds may also emerge. In January 2026, Emirates NBD issued the largest UAE dirham-denominated digital bond listed on Nasdaq Dubai. Although not labeled sustainable, digital issuance could improve liquidity and attract foreign investors.

Stronger Rules Lay the Foundation for Growth

Finally, regulation is gradually strengthening across the region. In April 2025, Saudi Arabia’s Capital Markets Authority published guidelines for issuing labeled debt instruments. These align closely with ICMA standards.

In the UAE, Federal Decree Law No. 11 (2024) requires all entities to measure, report, and reduce greenhouse gas emissions by May 2026. The law supports the country’s Net Zero 2050 strategy. Also, Turkiye is developing its own Green Taxonomy, largely based on the European Union framework.

Although there are currently no fully implemented local taxonomies in the region, policymakers are considering classification systems similar to Singapore’s “traffic light” approach. This system classifies activities as Green, Amber (transition), or Red (ineligible).

Such frameworks may help clarify which activities qualify for sustainable financing and could boost investor confidence.

What Will Power the $25B Forecast?

S&P Global expects issuance between $20 billion and $25 billion in 2026. The key drivers include:

  • Continued renewable energy expansion
  • Growing sustainable sukuk issuance
  • Increased transition finance activity
  • Regulatory developments and disclosure requirements
  • Rising attention to climate adaptation and water resilience

However, sustainable finance volumes remain below what is needed to meet the region’s environmental challenges. Climate adaptation and water scarcity are still underfinanced. Private and blended finance may play a larger role in closing this funding gap.

Despite global volatility, the Middle East sustainable bond market has shown resilience. Strong issuance from Saudi Arabia and the UAE, combined with innovation in sukuk and new bond types, positions the region for continued growth in 2026.

If projections hold, the region could surpass $25 billion in sustainable bond issuance next year, reinforcing its expanding role in global sustainable finance.